

Key Insights
The Froth Flotation Chemical market, valued at $1741.2 million in 2025, is projected to experience robust growth, exceeding a 4.50% CAGR through 2033. This expansion is driven by increasing demand across key end-user industries, particularly mining (driven by rising global metal consumption and exploration activities), pulp and paper (necessitated by growing paper and packaging demands), and industrial waste and sewage treatment (fueled by stringent environmental regulations). Technological advancements leading to improved reagent efficiency and selectivity are also significant contributors. The market is segmented by reagent type (collectors, frothers, modifiers, and deactivators), with collectors and frothers currently dominating the market share. Geographic growth is expected to be diverse, with the Asia-Pacific region, particularly China and India, anticipated to lead due to substantial mining and industrial activities. However, North America and Europe will also contribute significantly, driven by established industries and regulatory pressures. While challenges exist concerning raw material price volatility and environmental concerns related to reagent usage, the overall market outlook remains positive, fueled by the sustained need for efficient mineral processing and waste treatment solutions.
Froth Flotation Chemical Market Market Size (In Billion)
The substantial growth potential is further supported by the expanding global population and its increasing consumption of goods requiring raw materials extracted through froth flotation. The ongoing development of sustainable and environmentally friendly froth flotation chemicals is expected to mitigate some of the existing restraints. Competition among established players like Arkema, Air Products and Chemicals, Solvay, and BASF, alongside regional players, ensures continuous innovation and price competitiveness. The forecast period of 2025-2033 suggests a considerable expansion, driven by both existing and emerging markets, particularly in developing economies where industrialization and infrastructure development are accelerating. The market's resilience to economic fluctuations, coupled with ongoing innovation in reagent technology, signifies a long-term growth trajectory for froth flotation chemicals.
Froth Flotation Chemical Market Company Market Share
Froth Flotation Chemical Market: A Comprehensive Report (2019-2033)
This insightful report provides a comprehensive analysis of the Froth Flotation Chemical market, offering a detailed examination of market dynamics, key players, and future growth prospects. With a study period spanning 2019-2033, a base year of 2025, and a forecast period of 2025-2033, this report is an invaluable resource for stakeholders seeking to understand and capitalize on opportunities within this dynamic market. The market is segmented by reagent type (Collectors, Non-ionic: Frothers), end-user industry (Mining, Pulp and Paper, Industrial Waste and Sewage Treatment, Other End-user Industries), and chemical type (Neutral: Modifiers, Deactivators: Other Reagent Types). Key players analyzed include Arkema, Air Products and Chemicals Inc, Solvay, Chevron Phillips Chemical Company LLC, NASACO, Nouryon, BASF SE, Kemira, Dow, and Clariant, although the list is not exhaustive. The report projects a market value of xx Million by 2033.
Froth Flotation Chemical Market Market Composition & Trends
This section delves into the competitive landscape of the froth flotation chemical market, analyzing market concentration, innovation drivers, regulatory impacts, substitute product analysis, end-user profiles, and merger and acquisition (M&A) activities. The report provides a granular understanding of market share distribution among key players, revealing the dominance of established companies like Solvay and Arkema while highlighting the emergence of new players and their strategic maneuvers. M&A activities are analyzed, with specific deal values (where available) providing insights into market consolidation and growth strategies. The impact of regulatory changes on market access and product development is also evaluated, alongside an assessment of substitute product threats. Detailed profiles of end-user industries, including their specific needs and preferences for froth flotation chemicals, round out this section.
- Market Concentration: The market exhibits a moderately concentrated structure, with a few large players holding significant market share.
- Innovation Catalysts: Technological advancements, including AI-driven optimization systems like Solvay's SmartFloat, are accelerating market innovation.
- Regulatory Landscape: Stringent environmental regulations are driving the demand for environmentally friendly froth flotation chemicals.
- Substitute Products: Limited substitute products exist, reinforcing the market's overall stability.
- End-User Profiles: Mining remains the largest end-user segment, followed by pulp and paper and industrial waste treatment.
- M&A Activity: The report details a number of significant M&A deals, with an estimated total value of xx Million during the historical period.
Froth Flotation Chemical Market Industry Evolution
This section provides a detailed analysis of the froth flotation chemical market's growth trajectory, technological advancements, and evolving consumer preferences. We examine historical growth rates from 2019 to 2024, project future growth rates until 2033, and identify technological innovations that have shaped the market's evolution. The influence of shifting consumer demands, particularly the increasing focus on sustainability and environmental responsibility, is also analyzed. Data points such as adoption rates of new technologies and market penetration rates are included. The analysis considers the impacts of economic fluctuations, geopolitical events, and technological disruptions on the market's growth trajectory. The shift towards automation and digitalization within the industry, along with the increasing emphasis on data-driven decision-making, are highlighted, illustrating how these factors are redefining the market landscape.
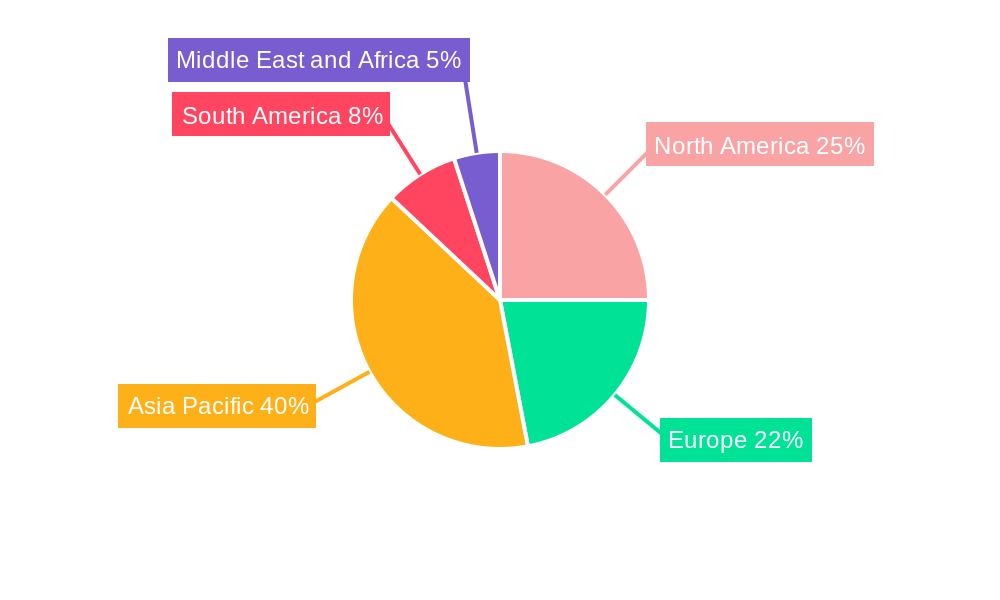
Leading Regions, Countries, or Segments in Froth Flotation Chemical Market
This section pinpoints the leading regions, countries, and market segments within the Froth Flotation Chemical market. Through comprehensive analysis, it reveals the dominant players and the underlying factors contributing to their success. The mining segment, particularly in regions with significant mining activities, is expected to drive substantial market growth. Likewise, the growing demand for sustainable solutions in the pulp and paper industry is also expected to boost segment growth. Regional variations in regulatory environments, technological adoption rates, and economic conditions are taken into account to offer a holistic perspective on market leadership.
- Key Drivers:
- Mining: High demand for efficient mineral extraction drives substantial consumption in regions with significant mining operations.
- Pulp & Paper: Growing emphasis on sustainable practices and improved process efficiency are fueling demand for innovative froth flotation chemicals.
- Regulatory Support: Government policies promoting sustainable industrial practices and resource efficiency boost market growth.
- Investment Trends: Significant investments in mining and pulp & paper expansion projects are creating favorable market conditions.
Froth Flotation Chemical Market Product Innovations
Recent innovations in froth flotation chemicals focus on enhancing efficiency, selectivity, and environmental sustainability. New collector and frother formulations offer improved performance metrics, such as higher recovery rates and reduced reagent consumption. These advancements contribute to cost savings and reduced environmental impact. Specific examples include the development of biodegradable frothers and collectors tailored for specific mineral types. The integration of digital technologies and data analytics is further optimizing reagent dosage and flotation processes.
Propelling Factors for Froth Flotation Chemical Market Growth
The Froth Flotation Chemical market is experiencing robust growth driven by several key factors. The increasing demand for minerals and metals fuels the need for efficient mineral processing, underpinning the growth of the mining sector. Technological advancements, including AI-powered optimization systems, further improve process efficiency, which in turn drives demand. The stringent environmental regulations are pushing the adoption of environmentally friendly froth flotation chemicals, fostering innovation and growth. This is augmented by a growing focus on sustainable practices and resource efficiency across various end-user industries.
Obstacles in the Froth Flotation Chemical Market Market
Despite the positive growth trajectory, the Froth Flotation Chemical market faces challenges such as fluctuating raw material prices, which can impact production costs and profitability. Supply chain disruptions, particularly those caused by geopolitical instability, can also hinder production and availability. Intense competition among established players and the emergence of new entrants create competitive pressures on pricing and market share. Stringent environmental regulations necessitate significant investments in research and development, further impacting costs. The overall impact of these constraints is estimated to reduce annual growth rates by xx%.
Future Opportunities in Froth Flotation Chemical Market
Significant opportunities exist for growth in the Froth Flotation Chemical market. The expansion into new and emerging markets, particularly in developing economies, presents substantial potential. The continued development and adoption of sustainable and environmentally friendly chemicals are major drivers of innovation and market growth. Furthermore, technological advancements, such as AI-powered optimization and the use of digital twins, offer opportunities for improved process efficiency and cost optimization.
Major Players in the Froth Flotation Chemical Market Ecosystem
- Arkema
- Air Products and Chemicals Inc
- Solvay
- Chevron Phillips Chemical Company LLC
- NASACO
- Nouryon
- BASF SE
- Kemira
- Dow
- Clariant
Key Developments in Froth Flotation Chemical Market Industry
- October 2022: Solvay launched 'SmartFloat,' an AI-based reagent optimization system for the mining industry. This development significantly impacts market dynamics by enhancing efficiency and optimizing resource utilization in froth flotation processes.
Strategic Froth Flotation Chemical Market Market Forecast
The Froth Flotation Chemical market is poised for continued growth, driven by robust demand from key end-user industries and the ongoing adoption of innovative technologies. The focus on sustainable solutions and improved process efficiency will further fuel market expansion. This positive outlook, coupled with strategic investments in research and development, positions the market for substantial growth over the forecast period, with a projected market value of xx Million by 2033.
Froth Flotation Chemical Market Segmentation
-
1. Reagent Type
-
1.1. Collectors
- 1.1.1. Cationic
- 1.1.2. Anionic
- 1.1.3. Non-ionic
-
1.2. Frothers
- 1.2.1. Acidic
- 1.2.2. Basic
- 1.2.3. Neutral
-
1.3. Modifiers
- 1.3.1. Acidic Depressants
- 1.3.2. pH modifiers
- 1.3.3. Activators
- 1.3.4. Deactivators
- 1.4. Other Reagent Types
-
1.1. Collectors
-
2. End-user Industry
- 2.1. Mining
- 2.2. Pulp and Paper
- 2.3. Industrial Waste and Sewage Treatment
- 2.4. Other End-user Industries
Froth Flotation Chemical Market Segmentation By Geography
-
1. Asia Pacific
- 1.1. China
- 1.2. India
- 1.3. Japan
- 1.4. South Korea
- 1.5. Rest of Asia Pacific
-
2. North America
- 2.1. United States
- 2.2. Canada
- 2.3. Mexico
-
3. Europe
- 3.1. Germany
- 3.2. United Kingdom
- 3.3. France
- 3.4. Italy
- 3.5. Rest of Europe
-
4. South America
- 4.1. Brazil
- 4.2. Argentina
- 4.3. Rest of South America
-
5. Middle East and Africa
- 5.1. Saudi Arabia
- 5.2. South Africa
- 5.3. Rest of Middle East and Africa
Froth Flotation Chemical Market Regional Market Share
Geographic Coverage of Froth Flotation Chemical Market
Froth Flotation Chemical Market REPORT HIGHLIGHTS
| Aspects | Details |
|---|---|
| Study Period | 2020-2034 |
| Base Year | 2025 |
| Estimated Year | 2026 |
| Forecast Period | 2026-2034 |
| Historical Period | 2020-2025 |
| Growth Rate | CAGR of > 4.50% from 2020-2034 |
| Segmentation |
|
Table of Contents
- 1. Introduction
- 1.1. Research Scope
- 1.2. Market Segmentation
- 1.3. Research Objective
- 1.4. Definitions and Assumptions
- 2. Executive Summary
- 2.1. Market Snapshot
- 3. Market Dynamics
- 3.1. Market Drivers
- 3.2. Market Restrains
- 3.3. Market Trends
- 3.4. Market Opportunities
- 4. Market Factor Analysis
- 4.1. Porters Five Forces
- 4.1.1. Bargaining Power of Suppliers
- 4.1.2. Bargaining Power of Buyers
- 4.1.3. Threat of New Entrants
- 4.1.4. Threat of Substitutes
- 4.1.5. Competitive Rivalry
- 4.2. PESTEL analysis
- 4.3. BCG Analysis
- 4.3.1. Stars (High Growth, High Market Share)
- 4.3.2. Cash Cows (Low Growth, High Market Share)
- 4.3.3. Question Mark (High Growth, Low Market Share)
- 4.3.4. Dogs (Low Growth, Low Market Share)
- 4.4. Ansoff Matrix Analysis
- 4.5. Supply Chain Analysis
- 4.6. Regulatory Landscape
- 4.7. Current Market Potential and Opportunity Assessment (TAM–SAM–SOM Framework)
- 4.8. DMV Analyst Note
- 4.1. Porters Five Forces
- 5. Market Analysis, Insights and Forecast 2021-2033
- 5.1. Market Analysis, Insights and Forecast - by Reagent Type
- 5.1.1. Collectors
- 5.1.1.1. Cationic
- 5.1.1.2. Anionic
- 5.1.1.3. Non-ionic
- 5.1.2. Frothers
- 5.1.2.1. Acidic
- 5.1.2.2. Basic
- 5.1.2.3. Neutral
- 5.1.3. Modifiers
- 5.1.3.1. Acidic Depressants
- 5.1.3.2. pH modifiers
- 5.1.3.3. Activators
- 5.1.3.4. Deactivators
- 5.1.4. Other Reagent Types
- 5.1.1. Collectors
- 5.2. Market Analysis, Insights and Forecast - by End-user Industry
- 5.2.1. Mining
- 5.2.2. Pulp and Paper
- 5.2.3. Industrial Waste and Sewage Treatment
- 5.2.4. Other End-user Industries
- 5.3. Market Analysis, Insights and Forecast - by Region
- 5.3.1. Asia Pacific
- 5.3.2. North America
- 5.3.3. Europe
- 5.3.4. South America
- 5.3.5. Middle East and Africa
- 5.1. Market Analysis, Insights and Forecast - by Reagent Type
- 6. Global Froth Flotation Chemical Market Analysis, Insights and Forecast, 2021-2033
- 6.1. Market Analysis, Insights and Forecast - by Reagent Type
- 6.1.1. Collectors
- 6.1.1.1. Cationic
- 6.1.1.2. Anionic
- 6.1.1.3. Non-ionic
- 6.1.2. Frothers
- 6.1.2.1. Acidic
- 6.1.2.2. Basic
- 6.1.2.3. Neutral
- 6.1.3. Modifiers
- 6.1.3.1. Acidic Depressants
- 6.1.3.2. pH modifiers
- 6.1.3.3. Activators
- 6.1.3.4. Deactivators
- 6.1.4. Other Reagent Types
- 6.1.1. Collectors
- 6.2. Market Analysis, Insights and Forecast - by End-user Industry
- 6.2.1. Mining
- 6.2.2. Pulp and Paper
- 6.2.3. Industrial Waste and Sewage Treatment
- 6.2.4. Other End-user Industries
- 6.1. Market Analysis, Insights and Forecast - by Reagent Type
- 7. Asia Pacific Froth Flotation Chemical Market Analysis, Insights and Forecast, 2020-2032
- 7.1. Market Analysis, Insights and Forecast - by Reagent Type
- 7.1.1. Collectors
- 7.1.1.1. Cationic
- 7.1.1.2. Anionic
- 7.1.1.3. Non-ionic
- 7.1.2. Frothers
- 7.1.2.1. Acidic
- 7.1.2.2. Basic
- 7.1.2.3. Neutral
- 7.1.3. Modifiers
- 7.1.3.1. Acidic Depressants
- 7.1.3.2. pH modifiers
- 7.1.3.3. Activators
- 7.1.3.4. Deactivators
- 7.1.4. Other Reagent Types
- 7.1.1. Collectors
- 7.2. Market Analysis, Insights and Forecast - by End-user Industry
- 7.2.1. Mining
- 7.2.2. Pulp and Paper
- 7.2.3. Industrial Waste and Sewage Treatment
- 7.2.4. Other End-user Industries
- 7.1. Market Analysis, Insights and Forecast - by Reagent Type
- 8. North America Froth Flotation Chemical Market Analysis, Insights and Forecast, 2020-2032
- 8.1. Market Analysis, Insights and Forecast - by Reagent Type
- 8.1.1. Collectors
- 8.1.1.1. Cationic
- 8.1.1.2. Anionic
- 8.1.1.3. Non-ionic
- 8.1.2. Frothers
- 8.1.2.1. Acidic
- 8.1.2.2. Basic
- 8.1.2.3. Neutral
- 8.1.3. Modifiers
- 8.1.3.1. Acidic Depressants
- 8.1.3.2. pH modifiers
- 8.1.3.3. Activators
- 8.1.3.4. Deactivators
- 8.1.4. Other Reagent Types
- 8.1.1. Collectors
- 8.2. Market Analysis, Insights and Forecast - by End-user Industry
- 8.2.1. Mining
- 8.2.2. Pulp and Paper
- 8.2.3. Industrial Waste and Sewage Treatment
- 8.2.4. Other End-user Industries
- 8.1. Market Analysis, Insights and Forecast - by Reagent Type
- 9. Europe Froth Flotation Chemical Market Analysis, Insights and Forecast, 2020-2032
- 9.1. Market Analysis, Insights and Forecast - by Reagent Type
- 9.1.1. Collectors
- 9.1.1.1. Cationic
- 9.1.1.2. Anionic
- 9.1.1.3. Non-ionic
- 9.1.2. Frothers
- 9.1.2.1. Acidic
- 9.1.2.2. Basic
- 9.1.2.3. Neutral
- 9.1.3. Modifiers
- 9.1.3.1. Acidic Depressants
- 9.1.3.2. pH modifiers
- 9.1.3.3. Activators
- 9.1.3.4. Deactivators
- 9.1.4. Other Reagent Types
- 9.1.1. Collectors
- 9.2. Market Analysis, Insights and Forecast - by End-user Industry
- 9.2.1. Mining
- 9.2.2. Pulp and Paper
- 9.2.3. Industrial Waste and Sewage Treatment
- 9.2.4. Other End-user Industries
- 9.1. Market Analysis, Insights and Forecast - by Reagent Type
- 10. South America Froth Flotation Chemical Market Analysis, Insights and Forecast, 2020-2032
- 10.1. Market Analysis, Insights and Forecast - by Reagent Type
- 10.1.1. Collectors
- 10.1.1.1. Cationic
- 10.1.1.2. Anionic
- 10.1.1.3. Non-ionic
- 10.1.2. Frothers
- 10.1.2.1. Acidic
- 10.1.2.2. Basic
- 10.1.2.3. Neutral
- 10.1.3. Modifiers
- 10.1.3.1. Acidic Depressants
- 10.1.3.2. pH modifiers
- 10.1.3.3. Activators
- 10.1.3.4. Deactivators
- 10.1.4. Other Reagent Types
- 10.1.1. Collectors
- 10.2. Market Analysis, Insights and Forecast - by End-user Industry
- 10.2.1. Mining
- 10.2.2. Pulp and Paper
- 10.2.3. Industrial Waste and Sewage Treatment
- 10.2.4. Other End-user Industries
- 10.1. Market Analysis, Insights and Forecast - by Reagent Type
- 11. Middle East and Africa Froth Flotation Chemical Market Analysis, Insights and Forecast, 2020-2032
- 11.1. Market Analysis, Insights and Forecast - by Reagent Type
- 11.1.1. Collectors
- 11.1.1.1. Cationic
- 11.1.1.2. Anionic
- 11.1.1.3. Non-ionic
- 11.1.2. Frothers
- 11.1.2.1. Acidic
- 11.1.2.2. Basic
- 11.1.2.3. Neutral
- 11.1.3. Modifiers
- 11.1.3.1. Acidic Depressants
- 11.1.3.2. pH modifiers
- 11.1.3.3. Activators
- 11.1.3.4. Deactivators
- 11.1.4. Other Reagent Types
- 11.1.1. Collectors
- 11.2. Market Analysis, Insights and Forecast - by End-user Industry
- 11.2.1. Mining
- 11.2.2. Pulp and Paper
- 11.2.3. Industrial Waste and Sewage Treatment
- 11.2.4. Other End-user Industries
- 11.1. Market Analysis, Insights and Forecast - by Reagent Type
- 12. Competitive Analysis
- 12.1. Company Profiles
- 12.1.1 Arkema
- 12.1.1.1. Company Overview
- 12.1.1.2. Products
- 12.1.1.3. Company Financials
- 12.1.1.4. SWOT Analysis
- 12.1.2 Air Products and Chemicals Inc
- 12.1.2.1. Company Overview
- 12.1.2.2. Products
- 12.1.2.3. Company Financials
- 12.1.2.4. SWOT Analysis
- 12.1.3 Solvay
- 12.1.3.1. Company Overview
- 12.1.3.2. Products
- 12.1.3.3. Company Financials
- 12.1.3.4. SWOT Analysis
- 12.1.4 Chevron Phillips Chemical Company LLC
- 12.1.4.1. Company Overview
- 12.1.4.2. Products
- 12.1.4.3. Company Financials
- 12.1.4.4. SWOT Analysis
- 12.1.5 NASACO
- 12.1.5.1. Company Overview
- 12.1.5.2. Products
- 12.1.5.3. Company Financials
- 12.1.5.4. SWOT Analysis
- 12.1.6 Nouryon*List Not Exhaustive
- 12.1.6.1. Company Overview
- 12.1.6.2. Products
- 12.1.6.3. Company Financials
- 12.1.6.4. SWOT Analysis
- 12.1.7 BASF SE
- 12.1.7.1. Company Overview
- 12.1.7.2. Products
- 12.1.7.3. Company Financials
- 12.1.7.4. SWOT Analysis
- 12.1.8 Kemira
- 12.1.8.1. Company Overview
- 12.1.8.2. Products
- 12.1.8.3. Company Financials
- 12.1.8.4. SWOT Analysis
- 12.1.9 Dow
- 12.1.9.1. Company Overview
- 12.1.9.2. Products
- 12.1.9.3. Company Financials
- 12.1.9.4. SWOT Analysis
- 12.1.10 CLARIANT
- 12.1.10.1. Company Overview
- 12.1.10.2. Products
- 12.1.10.3. Company Financials
- 12.1.10.4. SWOT Analysis
- 12.1.1 Arkema
- 12.2. Market Entropy
- 12.2.1 Company's Key Areas Served
- 12.2.2 Recent Developments
- 12.3. Company Market Share Analysis 2025
- 12.3.1 Top 5 Companies Market Share Analysis
- 12.3.2 Top 3 Companies Market Share Analysis
- 12.4. List of Potential Customers
- 13. Research Methodology
List of Figures
- Figure 1: Global Froth Flotation Chemical Market Revenue Breakdown (Million, %) by Region 2025 & 2033
- Figure 2: Global Froth Flotation Chemical Market Volume Breakdown (K Tons, %) by Region 2025 & 2033
- Figure 3: Asia Pacific Froth Flotation Chemical Market Revenue (Million), by Reagent Type 2025 & 2033
- Figure 4: Asia Pacific Froth Flotation Chemical Market Volume (K Tons), by Reagent Type 2025 & 2033
- Figure 5: Asia Pacific Froth Flotation Chemical Market Revenue Share (%), by Reagent Type 2025 & 2033
- Figure 6: Asia Pacific Froth Flotation Chemical Market Volume Share (%), by Reagent Type 2025 & 2033
- Figure 7: Asia Pacific Froth Flotation Chemical Market Revenue (Million), by End-user Industry 2025 & 2033
- Figure 8: Asia Pacific Froth Flotation Chemical Market Volume (K Tons), by End-user Industry 2025 & 2033
- Figure 9: Asia Pacific Froth Flotation Chemical Market Revenue Share (%), by End-user Industry 2025 & 2033
- Figure 10: Asia Pacific Froth Flotation Chemical Market Volume Share (%), by End-user Industry 2025 & 2033
- Figure 11: Asia Pacific Froth Flotation Chemical Market Revenue (Million), by Country 2025 & 2033
- Figure 12: Asia Pacific Froth Flotation Chemical Market Volume (K Tons), by Country 2025 & 2033
- Figure 13: Asia Pacific Froth Flotation Chemical Market Revenue Share (%), by Country 2025 & 2033
- Figure 14: Asia Pacific Froth Flotation Chemical Market Volume Share (%), by Country 2025 & 2033
- Figure 15: North America Froth Flotation Chemical Market Revenue (Million), by Reagent Type 2025 & 2033
- Figure 16: North America Froth Flotation Chemical Market Volume (K Tons), by Reagent Type 2025 & 2033
- Figure 17: North America Froth Flotation Chemical Market Revenue Share (%), by Reagent Type 2025 & 2033
- Figure 18: North America Froth Flotation Chemical Market Volume Share (%), by Reagent Type 2025 & 2033
- Figure 19: North America Froth Flotation Chemical Market Revenue (Million), by End-user Industry 2025 & 2033
- Figure 20: North America Froth Flotation Chemical Market Volume (K Tons), by End-user Industry 2025 & 2033
- Figure 21: North America Froth Flotation Chemical Market Revenue Share (%), by End-user Industry 2025 & 2033
- Figure 22: North America Froth Flotation Chemical Market Volume Share (%), by End-user Industry 2025 & 2033
- Figure 23: North America Froth Flotation Chemical Market Revenue (Million), by Country 2025 & 2033
- Figure 24: North America Froth Flotation Chemical Market Volume (K Tons), by Country 2025 & 2033
- Figure 25: North America Froth Flotation Chemical Market Revenue Share (%), by Country 2025 & 2033
- Figure 26: North America Froth Flotation Chemical Market Volume Share (%), by Country 2025 & 2033
- Figure 27: Europe Froth Flotation Chemical Market Revenue (Million), by Reagent Type 2025 & 2033
- Figure 28: Europe Froth Flotation Chemical Market Volume (K Tons), by Reagent Type 2025 & 2033
- Figure 29: Europe Froth Flotation Chemical Market Revenue Share (%), by Reagent Type 2025 & 2033
- Figure 30: Europe Froth Flotation Chemical Market Volume Share (%), by Reagent Type 2025 & 2033
- Figure 31: Europe Froth Flotation Chemical Market Revenue (Million), by End-user Industry 2025 & 2033
- Figure 32: Europe Froth Flotation Chemical Market Volume (K Tons), by End-user Industry 2025 & 2033
- Figure 33: Europe Froth Flotation Chemical Market Revenue Share (%), by End-user Industry 2025 & 2033
- Figure 34: Europe Froth Flotation Chemical Market Volume Share (%), by End-user Industry 2025 & 2033
- Figure 35: Europe Froth Flotation Chemical Market Revenue (Million), by Country 2025 & 2033
- Figure 36: Europe Froth Flotation Chemical Market Volume (K Tons), by Country 2025 & 2033
- Figure 37: Europe Froth Flotation Chemical Market Revenue Share (%), by Country 2025 & 2033
- Figure 38: Europe Froth Flotation Chemical Market Volume Share (%), by Country 2025 & 2033
- Figure 39: South America Froth Flotation Chemical Market Revenue (Million), by Reagent Type 2025 & 2033
- Figure 40: South America Froth Flotation Chemical Market Volume (K Tons), by Reagent Type 2025 & 2033
- Figure 41: South America Froth Flotation Chemical Market Revenue Share (%), by Reagent Type 2025 & 2033
- Figure 42: South America Froth Flotation Chemical Market Volume Share (%), by Reagent Type 2025 & 2033
- Figure 43: South America Froth Flotation Chemical Market Revenue (Million), by End-user Industry 2025 & 2033
- Figure 44: South America Froth Flotation Chemical Market Volume (K Tons), by End-user Industry 2025 & 2033
- Figure 45: South America Froth Flotation Chemical Market Revenue Share (%), by End-user Industry 2025 & 2033
- Figure 46: South America Froth Flotation Chemical Market Volume Share (%), by End-user Industry 2025 & 2033
- Figure 47: South America Froth Flotation Chemical Market Revenue (Million), by Country 2025 & 2033
- Figure 48: South America Froth Flotation Chemical Market Volume (K Tons), by Country 2025 & 2033
- Figure 49: South America Froth Flotation Chemical Market Revenue Share (%), by Country 2025 & 2033
- Figure 50: South America Froth Flotation Chemical Market Volume Share (%), by Country 2025 & 2033
- Figure 51: Middle East and Africa Froth Flotation Chemical Market Revenue (Million), by Reagent Type 2025 & 2033
- Figure 52: Middle East and Africa Froth Flotation Chemical Market Volume (K Tons), by Reagent Type 2025 & 2033
- Figure 53: Middle East and Africa Froth Flotation Chemical Market Revenue Share (%), by Reagent Type 2025 & 2033
- Figure 54: Middle East and Africa Froth Flotation Chemical Market Volume Share (%), by Reagent Type 2025 & 2033
- Figure 55: Middle East and Africa Froth Flotation Chemical Market Revenue (Million), by End-user Industry 2025 & 2033
- Figure 56: Middle East and Africa Froth Flotation Chemical Market Volume (K Tons), by End-user Industry 2025 & 2033
- Figure 57: Middle East and Africa Froth Flotation Chemical Market Revenue Share (%), by End-user Industry 2025 & 2033
- Figure 58: Middle East and Africa Froth Flotation Chemical Market Volume Share (%), by End-user Industry 2025 & 2033
- Figure 59: Middle East and Africa Froth Flotation Chemical Market Revenue (Million), by Country 2025 & 2033
- Figure 60: Middle East and Africa Froth Flotation Chemical Market Volume (K Tons), by Country 2025 & 2033
- Figure 61: Middle East and Africa Froth Flotation Chemical Market Revenue Share (%), by Country 2025 & 2033
- Figure 62: Middle East and Africa Froth Flotation Chemical Market Volume Share (%), by Country 2025 & 2033
List of Tables
- Table 1: Global Froth Flotation Chemical Market Revenue Million Forecast, by Reagent Type 2020 & 2033
- Table 2: Global Froth Flotation Chemical Market Volume K Tons Forecast, by Reagent Type 2020 & 2033
- Table 3: Global Froth Flotation Chemical Market Revenue Million Forecast, by End-user Industry 2020 & 2033
- Table 4: Global Froth Flotation Chemical Market Volume K Tons Forecast, by End-user Industry 2020 & 2033
- Table 5: Global Froth Flotation Chemical Market Revenue Million Forecast, by Region 2020 & 2033
- Table 6: Global Froth Flotation Chemical Market Volume K Tons Forecast, by Region 2020 & 2033
- Table 7: Global Froth Flotation Chemical Market Revenue Million Forecast, by Reagent Type 2020 & 2033
- Table 8: Global Froth Flotation Chemical Market Volume K Tons Forecast, by Reagent Type 2020 & 2033
- Table 9: Global Froth Flotation Chemical Market Revenue Million Forecast, by End-user Industry 2020 & 2033
- Table 10: Global Froth Flotation Chemical Market Volume K Tons Forecast, by End-user Industry 2020 & 2033
- Table 11: Global Froth Flotation Chemical Market Revenue Million Forecast, by Country 2020 & 2033
- Table 12: Global Froth Flotation Chemical Market Volume K Tons Forecast, by Country 2020 & 2033
- Table 13: China Froth Flotation Chemical Market Revenue (Million) Forecast, by Application 2020 & 2033
- Table 14: China Froth Flotation Chemical Market Volume (K Tons) Forecast, by Application 2020 & 2033
- Table 15: India Froth Flotation Chemical Market Revenue (Million) Forecast, by Application 2020 & 2033
- Table 16: India Froth Flotation Chemical Market Volume (K Tons) Forecast, by Application 2020 & 2033
- Table 17: Japan Froth Flotation Chemical Market Revenue (Million) Forecast, by Application 2020 & 2033
- Table 18: Japan Froth Flotation Chemical Market Volume (K Tons) Forecast, by Application 2020 & 2033
- Table 19: South Korea Froth Flotation Chemical Market Revenue (Million) Forecast, by Application 2020 & 2033
- Table 20: South Korea Froth Flotation Chemical Market Volume (K Tons) Forecast, by Application 2020 & 2033
- Table 21: Rest of Asia Pacific Froth Flotation Chemical Market Revenue (Million) Forecast, by Application 2020 & 2033
- Table 22: Rest of Asia Pacific Froth Flotation Chemical Market Volume (K Tons) Forecast, by Application 2020 & 2033
- Table 23: Global Froth Flotation Chemical Market Revenue Million Forecast, by Reagent Type 2020 & 2033
- Table 24: Global Froth Flotation Chemical Market Volume K Tons Forecast, by Reagent Type 2020 & 2033
- Table 25: Global Froth Flotation Chemical Market Revenue Million Forecast, by End-user Industry 2020 & 2033
- Table 26: Global Froth Flotation Chemical Market Volume K Tons Forecast, by End-user Industry 2020 & 2033
- Table 27: Global Froth Flotation Chemical Market Revenue Million Forecast, by Country 2020 & 2033
- Table 28: Global Froth Flotation Chemical Market Volume K Tons Forecast, by Country 2020 & 2033
- Table 29: United States Froth Flotation Chemical Market Revenue (Million) Forecast, by Application 2020 & 2033
- Table 30: United States Froth Flotation Chemical Market Volume (K Tons) Forecast, by Application 2020 & 2033
- Table 31: Canada Froth Flotation Chemical Market Revenue (Million) Forecast, by Application 2020 & 2033
- Table 32: Canada Froth Flotation Chemical Market Volume (K Tons) Forecast, by Application 2020 & 2033
- Table 33: Mexico Froth Flotation Chemical Market Revenue (Million) Forecast, by Application 2020 & 2033
- Table 34: Mexico Froth Flotation Chemical Market Volume (K Tons) Forecast, by Application 2020 & 2033
- Table 35: Global Froth Flotation Chemical Market Revenue Million Forecast, by Reagent Type 2020 & 2033
- Table 36: Global Froth Flotation Chemical Market Volume K Tons Forecast, by Reagent Type 2020 & 2033
- Table 37: Global Froth Flotation Chemical Market Revenue Million Forecast, by End-user Industry 2020 & 2033
- Table 38: Global Froth Flotation Chemical Market Volume K Tons Forecast, by End-user Industry 2020 & 2033
- Table 39: Global Froth Flotation Chemical Market Revenue Million Forecast, by Country 2020 & 2033
- Table 40: Global Froth Flotation Chemical Market Volume K Tons Forecast, by Country 2020 & 2033
- Table 41: Germany Froth Flotation Chemical Market Revenue (Million) Forecast, by Application 2020 & 2033
- Table 42: Germany Froth Flotation Chemical Market Volume (K Tons) Forecast, by Application 2020 & 2033
- Table 43: United Kingdom Froth Flotation Chemical Market Revenue (Million) Forecast, by Application 2020 & 2033
- Table 44: United Kingdom Froth Flotation Chemical Market Volume (K Tons) Forecast, by Application 2020 & 2033
- Table 45: France Froth Flotation Chemical Market Revenue (Million) Forecast, by Application 2020 & 2033
- Table 46: France Froth Flotation Chemical Market Volume (K Tons) Forecast, by Application 2020 & 2033
- Table 47: Italy Froth Flotation Chemical Market Revenue (Million) Forecast, by Application 2020 & 2033
- Table 48: Italy Froth Flotation Chemical Market Volume (K Tons) Forecast, by Application 2020 & 2033
- Table 49: Rest of Europe Froth Flotation Chemical Market Revenue (Million) Forecast, by Application 2020 & 2033
- Table 50: Rest of Europe Froth Flotation Chemical Market Volume (K Tons) Forecast, by Application 2020 & 2033
- Table 51: Global Froth Flotation Chemical Market Revenue Million Forecast, by Reagent Type 2020 & 2033
- Table 52: Global Froth Flotation Chemical Market Volume K Tons Forecast, by Reagent Type 2020 & 2033
- Table 53: Global Froth Flotation Chemical Market Revenue Million Forecast, by End-user Industry 2020 & 2033
- Table 54: Global Froth Flotation Chemical Market Volume K Tons Forecast, by End-user Industry 2020 & 2033
- Table 55: Global Froth Flotation Chemical Market Revenue Million Forecast, by Country 2020 & 2033
- Table 56: Global Froth Flotation Chemical Market Volume K Tons Forecast, by Country 2020 & 2033
- Table 57: Brazil Froth Flotation Chemical Market Revenue (Million) Forecast, by Application 2020 & 2033
- Table 58: Brazil Froth Flotation Chemical Market Volume (K Tons) Forecast, by Application 2020 & 2033
- Table 59: Argentina Froth Flotation Chemical Market Revenue (Million) Forecast, by Application 2020 & 2033
- Table 60: Argentina Froth Flotation Chemical Market Volume (K Tons) Forecast, by Application 2020 & 2033
- Table 61: Rest of South America Froth Flotation Chemical Market Revenue (Million) Forecast, by Application 2020 & 2033
- Table 62: Rest of South America Froth Flotation Chemical Market Volume (K Tons) Forecast, by Application 2020 & 2033
- Table 63: Global Froth Flotation Chemical Market Revenue Million Forecast, by Reagent Type 2020 & 2033
- Table 64: Global Froth Flotation Chemical Market Volume K Tons Forecast, by Reagent Type 2020 & 2033
- Table 65: Global Froth Flotation Chemical Market Revenue Million Forecast, by End-user Industry 2020 & 2033
- Table 66: Global Froth Flotation Chemical Market Volume K Tons Forecast, by End-user Industry 2020 & 2033
- Table 67: Global Froth Flotation Chemical Market Revenue Million Forecast, by Country 2020 & 2033
- Table 68: Global Froth Flotation Chemical Market Volume K Tons Forecast, by Country 2020 & 2033
- Table 69: Saudi Arabia Froth Flotation Chemical Market Revenue (Million) Forecast, by Application 2020 & 2033
- Table 70: Saudi Arabia Froth Flotation Chemical Market Volume (K Tons) Forecast, by Application 2020 & 2033
- Table 71: South Africa Froth Flotation Chemical Market Revenue (Million) Forecast, by Application 2020 & 2033
- Table 72: South Africa Froth Flotation Chemical Market Volume (K Tons) Forecast, by Application 2020 & 2033
- Table 73: Rest of Middle East and Africa Froth Flotation Chemical Market Revenue (Million) Forecast, by Application 2020 & 2033
- Table 74: Rest of Middle East and Africa Froth Flotation Chemical Market Volume (K Tons) Forecast, by Application 2020 & 2033
Frequently Asked Questions
1. What is the projected Compound Annual Growth Rate (CAGR) of the Froth Flotation Chemical Market?
The projected CAGR is approximately > 4.50%.
2. Which companies are prominent players in the Froth Flotation Chemical Market?
Key companies in the market include Arkema, Air Products and Chemicals Inc, Solvay, Chevron Phillips Chemical Company LLC, NASACO, Nouryon*List Not Exhaustive, BASF SE, Kemira, Dow, CLARIANT.
3. What are the main segments of the Froth Flotation Chemical Market?
The market segments include Reagent Type, End-user Industry.
4. Can you provide details about the market size?
The market size is estimated to be USD 1741.2 Million as of 2022.
5. What are some drivers contributing to market growth?
Rising Demand for Froth Flotation Chemicals in Asia-Pacific; Increasing Mining Activities in Canada and Mexico; Other Drivers.
6. What are the notable trends driving market growth?
Rising Demand from the Mining Industry.
7. Are there any restraints impacting market growth?
Stringent Policies and Changing Regulatory Landscape Exist in North America and Europe; Other Restraints.
8. Can you provide examples of recent developments in the market?
October 2022: Solvay launched a digital mining solution, 'SmartFloat,' an AI-based reagent optimization system. It helps mining companies capture more value from their data and optimize froth flotation processes.
9. What pricing options are available for accessing the report?
Pricing options include single-user, multi-user, and enterprise licenses priced at USD 4750, USD 5250, and USD 8750 respectively.
10. Is the market size provided in terms of value or volume?
The market size is provided in terms of value, measured in Million and volume, measured in K Tons.
11. Are there any specific market keywords associated with the report?
Yes, the market keyword associated with the report is "Froth Flotation Chemical Market," which aids in identifying and referencing the specific market segment covered.
12. How do I determine which pricing option suits my needs best?
The pricing options vary based on user requirements and access needs. Individual users may opt for single-user licenses, while businesses requiring broader access may choose multi-user or enterprise licenses for cost-effective access to the report.
13. Are there any additional resources or data provided in the Froth Flotation Chemical Market report?
While the report offers comprehensive insights, it's advisable to review the specific contents or supplementary materials provided to ascertain if additional resources or data are available.
14. How can I stay updated on further developments or reports in the Froth Flotation Chemical Market?
To stay informed about further developments, trends, and reports in the Froth Flotation Chemical Market, consider subscribing to industry newsletters, following relevant companies and organizations, or regularly checking reputable industry news sources and publications.
Methodology
Step 1 - Identification of Relevant Samples Size from Population Database


Step 2 - Approaches for Defining Global Market Size (Value, Volume* & Price*)

Note*: In applicable scenarios
Step 3 - Data Sources
Primary Research
- Web Analytics
- Survey Reports
- Research Institute
- Latest Research Reports
- Opinion Leaders
Secondary Research
- Annual Reports
- White Paper
- Latest Press Release
- Industry Association
- Paid Database
- Investor Presentations

Step 4 - Data Triangulation
Involves using different sources of information in order to increase the validity of a study
These sources are likely to be stakeholders in a program - participants, other researchers, program staff, other community members, and so on.
Then we put all data in single framework & apply various statistical tools to find out the dynamic on the market.
During the analysis stage, feedback from the stakeholder groups would be compared to determine areas of agreement as well as areas of divergence