

Key Insights
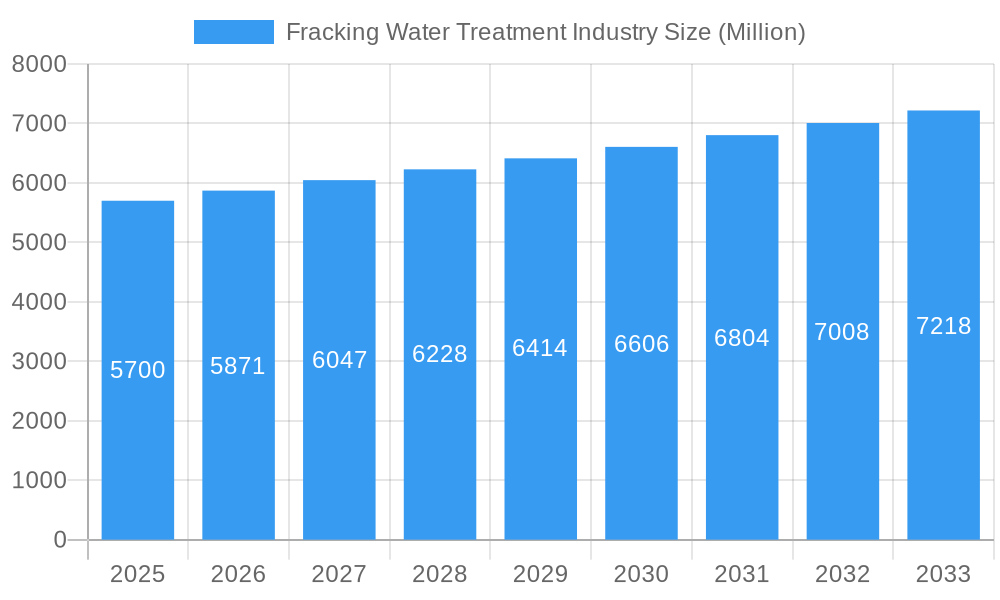
The fracking water treatment market, valued at $5.7 billion in 2025, is projected to experience robust growth, driven by a compound annual growth rate (CAGR) exceeding 3.00% from 2025 to 2033. This expansion is fueled by several key factors. Firstly, the increasing demand for oil and gas extraction necessitates efficient and environmentally responsible water management solutions. Stringent environmental regulations globally are pushing operators to adopt advanced water treatment technologies to minimize the environmental impact of fracking wastewater, further stimulating market growth. The rising adoption of treatment and recycling methods, as opposed to deep-well injection, reflects a growing awareness of sustainability concerns and a shift towards more responsible resource management. Technological advancements, such as membrane filtration and advanced oxidation processes, are improving treatment efficiency and reducing operational costs, making these solutions more attractive to operators. Finally, the geographic distribution of the market is diverse, with North America, particularly the United States, currently dominating due to its significant shale gas production. However, regions like Asia Pacific are expected to witness significant growth in the coming years, driven by increasing energy demand and exploration activities.
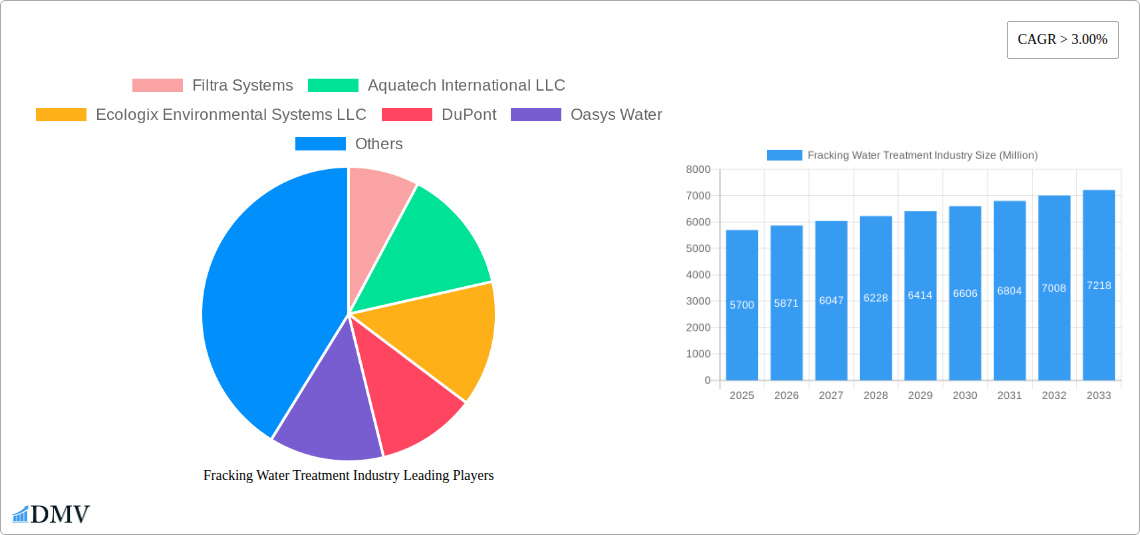
Fracking Water Treatment Industry Market Size (In Billion)
The competitive landscape is characterized by a mix of large multinational corporations and specialized technology providers. Companies like Halliburton and Schlumberger, with their established presence in the oil and gas sector, are leveraging their expertise to offer comprehensive water management solutions. Specialized firms like Filtra Systems and Aquatech International LLC are focusing on innovative technologies and tailored solutions to gain market share. The market is witnessing increasing consolidation, with larger players acquiring smaller companies to expand their service offerings and geographic reach. This dynamic environment is expected to lead to further innovation and the development of more sustainable and cost-effective fracking water treatment technologies in the years to come. The market's future growth will depend on several factors including regulatory changes, technological advancements, and the overall health of the oil and gas industry.
Fracking Water Treatment Industry Company Market Share
Fracking Water Treatment Industry: A Comprehensive Market Report (2019-2033)
This insightful report provides a comprehensive analysis of the Fracking Water Treatment Industry, offering a detailed forecast from 2025 to 2033. Valued at $XX Million in 2025, the market is poised for significant growth, driven by technological advancements and increasing regulatory scrutiny. This report meticulously examines market dynamics, key players, and future trends, providing stakeholders with crucial insights for informed decision-making. The study period covers 2019-2033, with 2025 serving as both the base and estimated year.
Fracking Water Treatment Industry Market Composition & Trends
This section provides a comprehensive analysis of the Fracking Water Treatment Industry's competitive landscape. We examine market concentration, the key drivers of innovation, prevailing regulatory frameworks, the impact of substitute products, detailed end-user profiles, and significant merger & acquisition (M&A) activities. The market is characterized by a moderately concentrated structure, with industry giants like Halliburton, Schlumberger Limited, and Veolia Water Technologies commanding substantial market share. Alongside these leaders, agile and specialized companies such as Filtra Systems and Agua Dulce Technologies LLC are effectively introducing cutting-edge solutions and gaining traction. The collective market share of the top five dominant players is estimated to be around XX%, signifying ongoing opportunities for further market consolidation and intensified competition. M&A activity has remained steady in recent years, with the average deal value approximating $XX Million per transaction. A primary impetus for innovation stems from increasingly stringent environmental regulations, coupled with the persistent demand for more efficient and economically viable water treatment solutions. While conventional wastewater treatment methods serve as substitutes, they often fall short in terms of effectiveness and cost-efficiency when addressing the unique challenges posed by fracking wastewater. The primary end-users are oil and gas exploration and production companies, with a growing participation from specialized environmental remediation firms.
- Market Concentration: Moderately Concentrated (Top 5 players hold approximately XX% market share)
- M&A Deal Value (Average): Approximately $XX Million
- Key Innovation Drivers: Escalating demand for sustainable practices driven by stringent environmental regulations, and the imperative for cost-optimized, high-efficiency treatment solutions.
- Substitute Products: Conventional wastewater treatment methods, which are often less effective and more costly for fracking wastewater applications.
Fracking Water Treatment Industry Industry Evolution
The Fracking Water Treatment Industry has undergone significant and dynamic evolution since 2019. The market demonstrated a robust Compound Annual Growth Rate (CAGR) of XX% during the historical period spanning 2019-2024, primarily propelled by the global upswing in fracking activities. Technological advancements have been instrumental, with the widespread adoption of sophisticated membrane filtration techniques and automated operational systems substantially enhancing treatment efficacy and driving down operational expenditures. The industry is progressively pivoting towards sustainable and environmentally responsible solutions, a shift strongly influenced by heightened public environmental consciousness and proactive governmental directives. Consumer demand is increasingly oriented towards treatment solutions that minimize ecological footprints and rigorously ensure adherence to ever-evolving regulatory mandates. The integration of advanced technologies, such as membrane filtration, has seen a notable increase of XX% since 2019. Concurrently, the embrace of automation and digitalization has resulted in an estimated XX% reduction in operational costs for leading industry participants. The forecast period, from 2025 to 2033, anticipates a continued CAGR of XX%, fueled by sustained growth in fracking operations and ongoing technological advancements within the sector.
Leading Regions, Countries, or Segments in Fracking Water Treatment Industry
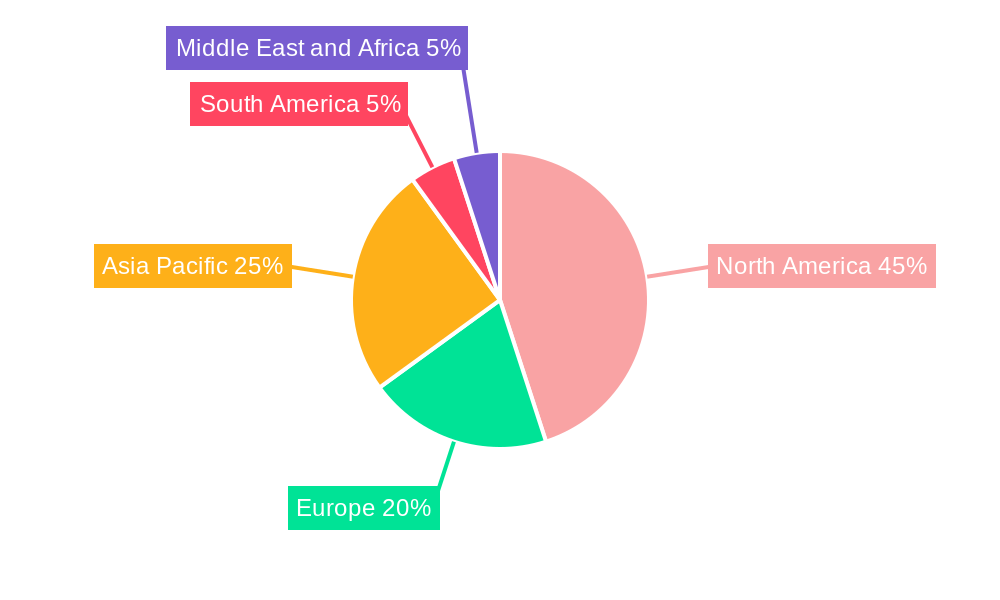
The North American market, particularly the United States, currently dominates the global Fracking Water Treatment Industry. This dominance is driven by several factors:
- High Fracking Activity: The US boasts the highest fracking activity globally, creating a large demand for water treatment services.
- Favorable Regulatory Environment (with caveats): While regulations are stringent, they also provide a clear framework for industry growth, incentivizing investment in innovative solutions.
- Significant Investment: Substantial private and public investment in R&D for water treatment technologies fuels innovation and market expansion.
The Treatment & Recycle segment holds the largest market share, followed by Deep Well Injection. The Treatment & Recycle segment's dominance is primarily due to a growing emphasis on water reuse and recycling to minimize environmental impact and reduce fresh water consumption. Deep Well Injection remains important but faces growing regulatory scrutiny concerning potential environmental risks. Other key regions with significant growth potential include parts of Europe and Asia-Pacific, driven by expanding fracking activities and increasing focus on sustainable water management practices.
Fracking Water Treatment Industry Product Innovations
Recent product innovations within the Fracking Water Treatment Industry are sharply focused on elevating treatment efficiency, achieving greater cost reductions, and minimizing environmental impact. Advanced membrane technologies, including reverse osmosis and nanofiltration, are gaining considerable traction due to their superior water purification capabilities. The integration of automated systems coupled with advanced data analytics is significantly optimizing treatment processes and enabling predictive maintenance strategies. Furthermore, the industry is witnessing the emergence of innovative hybrid treatment systems that strategically combine multiple technologies to deliver enhanced overall performance. Differentiating factors and unique selling propositions frequently revolve around demonstrably lower operational expenditures, a reduced environmental footprint, and superior treatment effectiveness compared to legacy technologies.
Propelling Factors for Fracking Water Treatment Industry Growth
Several key factors are driving the growth of the Fracking Water Treatment Industry:
- Stringent Environmental Regulations: Growing environmental awareness and stricter regulations are pushing the industry towards more sustainable and efficient water treatment solutions.
- Technological Advancements: Innovations in membrane technology, automation, and data analytics are enhancing treatment efficiency and reducing costs.
- Increasing Fracking Activity (in key regions): Continued expansion of fracking activities in North America and other regions fuels demand for water treatment services.
- Government Funding and Incentives: Government funding for R&D of sustainable water treatment solutions is fostering innovation and accelerating market growth.
Obstacles in the Fracking Water Treatment Industry Market
Despite its considerable growth trajectory, the Fracking Water Treatment Industry encounters several significant obstacles:
- Regulatory Uncertainty: Volatile shifts and unpredictability in environmental regulations can introduce considerable uncertainty for businesses, potentially deterring crucial investments and long-term strategic planning.
- Supply Chain Vulnerabilities: Disruptions within the global supply chain can adversely impact the availability of critical components and raw materials. This can lead to escalating costs and significant project execution delays.
- Intense Market Competition: The market is characterized by a highly competitive environment, with both established industry veterans and emerging new entrants vigorously vying for market share. This dynamic often results in considerable price pressures and necessitates continuous innovation to maintain competitiveness.
Future Opportunities in Fracking Water Treatment Industry
The Fracking Water Treatment Industry presents several promising opportunities:
- Expansion into Emerging Markets: Growing fracking activities in emerging economies offer lucrative growth potential.
- Development of Advanced Technologies: Continued innovation in membrane technologies and other treatment processes can lead to significant market advancements.
- Focus on Water Reuse and Recycling: Growing demand for sustainable water management solutions presents significant opportunities for companies specializing in water reuse and recycling technologies.
Major Players in the Fracking Water Treatment Industry Ecosystem
- Filtra Systems
- Aquatech International LLC
- Ecologix Environmental Systems LLC
- DuPont
- Oasys Water
- Halliburton
- Schlumberger Limited
- Agua Dulce Technologies LLC
- Veolia Water Technologies
- Note: This list is not exhaustive and represents key contributors to the ecosystem.
Key Developments in Fracking Water Treatment Industry Industry
- 2022 Q3: Partnership between Halliburton and Schlumberger to develop a new membrane filtration technology for fracking wastewater treatment.
- 2023 Q1: Government funding of $XX Million awarded to a consortium of research institutions and companies for the development of sustainable water treatment solutions.
- 2024 Q2: Filtra Systems launches an automated water treatment system incorporating AI-powered optimization algorithms.
- 2025 Q1: Significant increase in adoption of membrane technologies across the industry, driving a XX% increase in market share.
Strategic Fracking Water Treatment Industry Market Forecast
The Fracking Water Treatment Industry is expected to experience robust growth over the forecast period (2025-2033). Continued technological advancements, increasing regulatory pressure for sustainable solutions, and growing fracking activities, particularly in emerging markets, will drive market expansion. Opportunities for companies specializing in water reuse, recycling, and advanced membrane filtration technologies are especially promising. The market is projected to reach $XX Million by 2033, representing a significant increase compared to 2025 levels. This growth will be underpinned by a continued focus on sustainability, technological innovation, and improved regulatory clarity.
Fracking Water Treatment Industry Segmentation
-
1. Application
- 1.1. Treatment & Recycle
- 1.2. Deep well Injection
Fracking Water Treatment Industry Segmentation By Geography
-
1. Asia Pacific
- 1.1. China
- 1.2. India
- 1.3. Japan
- 1.4. South Korea
- 1.5. Rest of Asia Pacific
-
2. North America
- 2.1. United States
- 2.2. Canada
- 2.3. Mexico
-
3. Europe
- 3.1. Germany
- 3.2. United Kingdom
- 3.3. France
- 3.4. Italy
- 3.5. Rest of Europe
-
4. South America
- 4.1. Brazil
- 4.2. Argentina
- 4.3. Rest of South America
-
5. Middle East and Africa
- 5.1. Saudi Arabia
- 5.2. South Africa
- 5.3. Rest of Middle East and Africa
Fracking Water Treatment Industry Regional Market Share
Geographic Coverage of Fracking Water Treatment Industry
Fracking Water Treatment Industry REPORT HIGHLIGHTS
| Aspects | Details |
|---|---|
| Study Period | 2020-2034 |
| Base Year | 2025 |
| Estimated Year | 2026 |
| Forecast Period | 2026-2034 |
| Historical Period | 2020-2025 |
| Growth Rate | CAGR of > 3.00% from 2020-2034 |
| Segmentation |
|
Table of Contents
- 1. Introduction
- 1.1. Research Scope
- 1.2. Market Segmentation
- 1.3. Research Objective
- 1.4. Definitions and Assumptions
- 2. Executive Summary
- 2.1. Market Snapshot
- 3. Market Dynamics
- 3.1. Market Drivers
- 3.2. Market Restrains
- 3.3. Market Trends
- 3.4. Market Opportunities
- 4. Market Factor Analysis
- 4.1. Porters Five Forces
- 4.1.1. Bargaining Power of Suppliers
- 4.1.2. Bargaining Power of Buyers
- 4.1.3. Threat of New Entrants
- 4.1.4. Threat of Substitutes
- 4.1.5. Competitive Rivalry
- 4.2. PESTEL analysis
- 4.3. BCG Analysis
- 4.3.1. Stars (High Growth, High Market Share)
- 4.3.2. Cash Cows (Low Growth, High Market Share)
- 4.3.3. Question Mark (High Growth, Low Market Share)
- 4.3.4. Dogs (Low Growth, Low Market Share)
- 4.4. Ansoff Matrix Analysis
- 4.5. Supply Chain Analysis
- 4.6. Regulatory Landscape
- 4.7. Current Market Potential and Opportunity Assessment (TAM–SAM–SOM Framework)
- 4.8. DMV Analyst Note
- 4.1. Porters Five Forces
- 5. Market Analysis, Insights and Forecast 2021-2033
- 5.1. Market Analysis, Insights and Forecast - by Application
- 5.1.1. Treatment & Recycle
- 5.1.2. Deep well Injection
- 5.2. Market Analysis, Insights and Forecast - by Region
- 5.2.1. Asia Pacific
- 5.2.2. North America
- 5.2.3. Europe
- 5.2.4. South America
- 5.2.5. Middle East and Africa
- 5.1. Market Analysis, Insights and Forecast - by Application
- 6. Global Fracking Water Treatment Industry Analysis, Insights and Forecast, 2021-2033
- 6.1. Market Analysis, Insights and Forecast - by Application
- 6.1.1. Treatment & Recycle
- 6.1.2. Deep well Injection
- 6.1. Market Analysis, Insights and Forecast - by Application
- 7. Asia Pacific Fracking Water Treatment Industry Analysis, Insights and Forecast, 2020-2032
- 7.1. Market Analysis, Insights and Forecast - by Application
- 7.1.1. Treatment & Recycle
- 7.1.2. Deep well Injection
- 7.1. Market Analysis, Insights and Forecast - by Application
- 8. North America Fracking Water Treatment Industry Analysis, Insights and Forecast, 2020-2032
- 8.1. Market Analysis, Insights and Forecast - by Application
- 8.1.1. Treatment & Recycle
- 8.1.2. Deep well Injection
- 8.1. Market Analysis, Insights and Forecast - by Application
- 9. Europe Fracking Water Treatment Industry Analysis, Insights and Forecast, 2020-2032
- 9.1. Market Analysis, Insights and Forecast - by Application
- 9.1.1. Treatment & Recycle
- 9.1.2. Deep well Injection
- 9.1. Market Analysis, Insights and Forecast - by Application
- 10. South America Fracking Water Treatment Industry Analysis, Insights and Forecast, 2020-2032
- 10.1. Market Analysis, Insights and Forecast - by Application
- 10.1.1. Treatment & Recycle
- 10.1.2. Deep well Injection
- 10.1. Market Analysis, Insights and Forecast - by Application
- 11. Middle East and Africa Fracking Water Treatment Industry Analysis, Insights and Forecast, 2020-2032
- 11.1. Market Analysis, Insights and Forecast - by Application
- 11.1.1. Treatment & Recycle
- 11.1.2. Deep well Injection
- 11.1. Market Analysis, Insights and Forecast - by Application
- 12. Competitive Analysis
- 12.1. Company Profiles
- 12.1.1 Filtra Systems
- 12.1.1.1. Company Overview
- 12.1.1.2. Products
- 12.1.1.3. Company Financials
- 12.1.1.4. SWOT Analysis
- 12.1.2 Aquatech International LLC
- 12.1.2.1. Company Overview
- 12.1.2.2. Products
- 12.1.2.3. Company Financials
- 12.1.2.4. SWOT Analysis
- 12.1.3 Ecologix Environmental Systems LLC
- 12.1.3.1. Company Overview
- 12.1.3.2. Products
- 12.1.3.3. Company Financials
- 12.1.3.4. SWOT Analysis
- 12.1.4 DuPont
- 12.1.4.1. Company Overview
- 12.1.4.2. Products
- 12.1.4.3. Company Financials
- 12.1.4.4. SWOT Analysis
- 12.1.5 Oasys Water
- 12.1.5.1. Company Overview
- 12.1.5.2. Products
- 12.1.5.3. Company Financials
- 12.1.5.4. SWOT Analysis
- 12.1.6 Halliburton
- 12.1.6.1. Company Overview
- 12.1.6.2. Products
- 12.1.6.3. Company Financials
- 12.1.6.4. SWOT Analysis
- 12.1.7 Schlumberger Limited
- 12.1.7.1. Company Overview
- 12.1.7.2. Products
- 12.1.7.3. Company Financials
- 12.1.7.4. SWOT Analysis
- 12.1.8 Agua Dulce Technologies LLC
- 12.1.8.1. Company Overview
- 12.1.8.2. Products
- 12.1.8.3. Company Financials
- 12.1.8.4. SWOT Analysis
- 12.1.9 Veolia Water Technologies*List Not Exhaustive
- 12.1.9.1. Company Overview
- 12.1.9.2. Products
- 12.1.9.3. Company Financials
- 12.1.9.4. SWOT Analysis
- 12.1.10 Filtra Systems
- 12.1.10.1. Company Overview
- 12.1.10.2. Products
- 12.1.10.3. Company Financials
- 12.1.10.4. SWOT Analysis
- 12.1.1 Filtra Systems
- 12.2. Market Entropy
- 12.2.1 Company's Key Areas Served
- 12.2.2 Recent Developments
- 12.3. Company Market Share Analysis 2025
- 12.3.1 Top 5 Companies Market Share Analysis
- 12.3.2 Top 3 Companies Market Share Analysis
- 12.4. List of Potential Customers
- 13. Research Methodology
List of Figures
- Figure 1: Global Fracking Water Treatment Industry Revenue Breakdown (Million, %) by Region 2025 & 2033
- Figure 2: Global Fracking Water Treatment Industry Volume Breakdown (liter , %) by Region 2025 & 2033
- Figure 3: Asia Pacific Fracking Water Treatment Industry Revenue (Million), by Application 2025 & 2033
- Figure 4: Asia Pacific Fracking Water Treatment Industry Volume (liter ), by Application 2025 & 2033
- Figure 5: Asia Pacific Fracking Water Treatment Industry Revenue Share (%), by Application 2025 & 2033
- Figure 6: Asia Pacific Fracking Water Treatment Industry Volume Share (%), by Application 2025 & 2033
- Figure 7: Asia Pacific Fracking Water Treatment Industry Revenue (Million), by Country 2025 & 2033
- Figure 8: Asia Pacific Fracking Water Treatment Industry Volume (liter ), by Country 2025 & 2033
- Figure 9: Asia Pacific Fracking Water Treatment Industry Revenue Share (%), by Country 2025 & 2033
- Figure 10: Asia Pacific Fracking Water Treatment Industry Volume Share (%), by Country 2025 & 2033
- Figure 11: North America Fracking Water Treatment Industry Revenue (Million), by Application 2025 & 2033
- Figure 12: North America Fracking Water Treatment Industry Volume (liter ), by Application 2025 & 2033
- Figure 13: North America Fracking Water Treatment Industry Revenue Share (%), by Application 2025 & 2033
- Figure 14: North America Fracking Water Treatment Industry Volume Share (%), by Application 2025 & 2033
- Figure 15: North America Fracking Water Treatment Industry Revenue (Million), by Country 2025 & 2033
- Figure 16: North America Fracking Water Treatment Industry Volume (liter ), by Country 2025 & 2033
- Figure 17: North America Fracking Water Treatment Industry Revenue Share (%), by Country 2025 & 2033
- Figure 18: North America Fracking Water Treatment Industry Volume Share (%), by Country 2025 & 2033
- Figure 19: Europe Fracking Water Treatment Industry Revenue (Million), by Application 2025 & 2033
- Figure 20: Europe Fracking Water Treatment Industry Volume (liter ), by Application 2025 & 2033
- Figure 21: Europe Fracking Water Treatment Industry Revenue Share (%), by Application 2025 & 2033
- Figure 22: Europe Fracking Water Treatment Industry Volume Share (%), by Application 2025 & 2033
- Figure 23: Europe Fracking Water Treatment Industry Revenue (Million), by Country 2025 & 2033
- Figure 24: Europe Fracking Water Treatment Industry Volume (liter ), by Country 2025 & 2033
- Figure 25: Europe Fracking Water Treatment Industry Revenue Share (%), by Country 2025 & 2033
- Figure 26: Europe Fracking Water Treatment Industry Volume Share (%), by Country 2025 & 2033
- Figure 27: South America Fracking Water Treatment Industry Revenue (Million), by Application 2025 & 2033
- Figure 28: South America Fracking Water Treatment Industry Volume (liter ), by Application 2025 & 2033
- Figure 29: South America Fracking Water Treatment Industry Revenue Share (%), by Application 2025 & 2033
- Figure 30: South America Fracking Water Treatment Industry Volume Share (%), by Application 2025 & 2033
- Figure 31: South America Fracking Water Treatment Industry Revenue (Million), by Country 2025 & 2033
- Figure 32: South America Fracking Water Treatment Industry Volume (liter ), by Country 2025 & 2033
- Figure 33: South America Fracking Water Treatment Industry Revenue Share (%), by Country 2025 & 2033
- Figure 34: South America Fracking Water Treatment Industry Volume Share (%), by Country 2025 & 2033
- Figure 35: Middle East and Africa Fracking Water Treatment Industry Revenue (Million), by Application 2025 & 2033
- Figure 36: Middle East and Africa Fracking Water Treatment Industry Volume (liter ), by Application 2025 & 2033
- Figure 37: Middle East and Africa Fracking Water Treatment Industry Revenue Share (%), by Application 2025 & 2033
- Figure 38: Middle East and Africa Fracking Water Treatment Industry Volume Share (%), by Application 2025 & 2033
- Figure 39: Middle East and Africa Fracking Water Treatment Industry Revenue (Million), by Country 2025 & 2033
- Figure 40: Middle East and Africa Fracking Water Treatment Industry Volume (liter ), by Country 2025 & 2033
- Figure 41: Middle East and Africa Fracking Water Treatment Industry Revenue Share (%), by Country 2025 & 2033
- Figure 42: Middle East and Africa Fracking Water Treatment Industry Volume Share (%), by Country 2025 & 2033
List of Tables
- Table 1: Global Fracking Water Treatment Industry Revenue Million Forecast, by Application 2020 & 2033
- Table 2: Global Fracking Water Treatment Industry Volume liter Forecast, by Application 2020 & 2033
- Table 3: Global Fracking Water Treatment Industry Revenue Million Forecast, by Region 2020 & 2033
- Table 4: Global Fracking Water Treatment Industry Volume liter Forecast, by Region 2020 & 2033
- Table 5: Global Fracking Water Treatment Industry Revenue Million Forecast, by Application 2020 & 2033
- Table 6: Global Fracking Water Treatment Industry Volume liter Forecast, by Application 2020 & 2033
- Table 7: Global Fracking Water Treatment Industry Revenue Million Forecast, by Country 2020 & 2033
- Table 8: Global Fracking Water Treatment Industry Volume liter Forecast, by Country 2020 & 2033
- Table 9: China Fracking Water Treatment Industry Revenue (Million) Forecast, by Application 2020 & 2033
- Table 10: China Fracking Water Treatment Industry Volume (liter ) Forecast, by Application 2020 & 2033
- Table 11: India Fracking Water Treatment Industry Revenue (Million) Forecast, by Application 2020 & 2033
- Table 12: India Fracking Water Treatment Industry Volume (liter ) Forecast, by Application 2020 & 2033
- Table 13: Japan Fracking Water Treatment Industry Revenue (Million) Forecast, by Application 2020 & 2033
- Table 14: Japan Fracking Water Treatment Industry Volume (liter ) Forecast, by Application 2020 & 2033
- Table 15: South Korea Fracking Water Treatment Industry Revenue (Million) Forecast, by Application 2020 & 2033
- Table 16: South Korea Fracking Water Treatment Industry Volume (liter ) Forecast, by Application 2020 & 2033
- Table 17: Rest of Asia Pacific Fracking Water Treatment Industry Revenue (Million) Forecast, by Application 2020 & 2033
- Table 18: Rest of Asia Pacific Fracking Water Treatment Industry Volume (liter ) Forecast, by Application 2020 & 2033
- Table 19: Global Fracking Water Treatment Industry Revenue Million Forecast, by Application 2020 & 2033
- Table 20: Global Fracking Water Treatment Industry Volume liter Forecast, by Application 2020 & 2033
- Table 21: Global Fracking Water Treatment Industry Revenue Million Forecast, by Country 2020 & 2033
- Table 22: Global Fracking Water Treatment Industry Volume liter Forecast, by Country 2020 & 2033
- Table 23: United States Fracking Water Treatment Industry Revenue (Million) Forecast, by Application 2020 & 2033
- Table 24: United States Fracking Water Treatment Industry Volume (liter ) Forecast, by Application 2020 & 2033
- Table 25: Canada Fracking Water Treatment Industry Revenue (Million) Forecast, by Application 2020 & 2033
- Table 26: Canada Fracking Water Treatment Industry Volume (liter ) Forecast, by Application 2020 & 2033
- Table 27: Mexico Fracking Water Treatment Industry Revenue (Million) Forecast, by Application 2020 & 2033
- Table 28: Mexico Fracking Water Treatment Industry Volume (liter ) Forecast, by Application 2020 & 2033
- Table 29: Global Fracking Water Treatment Industry Revenue Million Forecast, by Application 2020 & 2033
- Table 30: Global Fracking Water Treatment Industry Volume liter Forecast, by Application 2020 & 2033
- Table 31: Global Fracking Water Treatment Industry Revenue Million Forecast, by Country 2020 & 2033
- Table 32: Global Fracking Water Treatment Industry Volume liter Forecast, by Country 2020 & 2033
- Table 33: Germany Fracking Water Treatment Industry Revenue (Million) Forecast, by Application 2020 & 2033
- Table 34: Germany Fracking Water Treatment Industry Volume (liter ) Forecast, by Application 2020 & 2033
- Table 35: United Kingdom Fracking Water Treatment Industry Revenue (Million) Forecast, by Application 2020 & 2033
- Table 36: United Kingdom Fracking Water Treatment Industry Volume (liter ) Forecast, by Application 2020 & 2033
- Table 37: France Fracking Water Treatment Industry Revenue (Million) Forecast, by Application 2020 & 2033
- Table 38: France Fracking Water Treatment Industry Volume (liter ) Forecast, by Application 2020 & 2033
- Table 39: Italy Fracking Water Treatment Industry Revenue (Million) Forecast, by Application 2020 & 2033
- Table 40: Italy Fracking Water Treatment Industry Volume (liter ) Forecast, by Application 2020 & 2033
- Table 41: Rest of Europe Fracking Water Treatment Industry Revenue (Million) Forecast, by Application 2020 & 2033
- Table 42: Rest of Europe Fracking Water Treatment Industry Volume (liter ) Forecast, by Application 2020 & 2033
- Table 43: Global Fracking Water Treatment Industry Revenue Million Forecast, by Application 2020 & 2033
- Table 44: Global Fracking Water Treatment Industry Volume liter Forecast, by Application 2020 & 2033
- Table 45: Global Fracking Water Treatment Industry Revenue Million Forecast, by Country 2020 & 2033
- Table 46: Global Fracking Water Treatment Industry Volume liter Forecast, by Country 2020 & 2033
- Table 47: Brazil Fracking Water Treatment Industry Revenue (Million) Forecast, by Application 2020 & 2033
- Table 48: Brazil Fracking Water Treatment Industry Volume (liter ) Forecast, by Application 2020 & 2033
- Table 49: Argentina Fracking Water Treatment Industry Revenue (Million) Forecast, by Application 2020 & 2033
- Table 50: Argentina Fracking Water Treatment Industry Volume (liter ) Forecast, by Application 2020 & 2033
- Table 51: Rest of South America Fracking Water Treatment Industry Revenue (Million) Forecast, by Application 2020 & 2033
- Table 52: Rest of South America Fracking Water Treatment Industry Volume (liter ) Forecast, by Application 2020 & 2033
- Table 53: Global Fracking Water Treatment Industry Revenue Million Forecast, by Application 2020 & 2033
- Table 54: Global Fracking Water Treatment Industry Volume liter Forecast, by Application 2020 & 2033
- Table 55: Global Fracking Water Treatment Industry Revenue Million Forecast, by Country 2020 & 2033
- Table 56: Global Fracking Water Treatment Industry Volume liter Forecast, by Country 2020 & 2033
- Table 57: Saudi Arabia Fracking Water Treatment Industry Revenue (Million) Forecast, by Application 2020 & 2033
- Table 58: Saudi Arabia Fracking Water Treatment Industry Volume (liter ) Forecast, by Application 2020 & 2033
- Table 59: South Africa Fracking Water Treatment Industry Revenue (Million) Forecast, by Application 2020 & 2033
- Table 60: South Africa Fracking Water Treatment Industry Volume (liter ) Forecast, by Application 2020 & 2033
- Table 61: Rest of Middle East and Africa Fracking Water Treatment Industry Revenue (Million) Forecast, by Application 2020 & 2033
- Table 62: Rest of Middle East and Africa Fracking Water Treatment Industry Volume (liter ) Forecast, by Application 2020 & 2033
Frequently Asked Questions
1. What is the projected Compound Annual Growth Rate (CAGR) of the Fracking Water Treatment Industry?
The projected CAGR is approximately > 3.00%.
2. Which companies are prominent players in the Fracking Water Treatment Industry?
Key companies in the market include Filtra Systems, Aquatech International LLC, Ecologix Environmental Systems LLC, DuPont, Oasys Water, Halliburton, Schlumberger Limited, Agua Dulce Technologies LLC, Veolia Water Technologies*List Not Exhaustive, Filtra Systems.
3. What are the main segments of the Fracking Water Treatment Industry?
The market segments include Application.
4. Can you provide details about the market size?
The market size is estimated to be USD 5700 Million as of 2022.
5. What are some drivers contributing to market growth?
; High Demand from Treatment & Recycle Segment; Stringent Government Regulations.
6. What are the notable trends driving market growth?
High Demand from Treatment & Recycle Segment.
7. Are there any restraints impacting market growth?
; Outbreak of COVID-19; Other Restraints.
8. Can you provide examples of recent developments in the market?
Partnerships between industry players to develop innovative technologies
9. What pricing options are available for accessing the report?
Pricing options include single-user, multi-user, and enterprise licenses priced at USD 4750, USD 5250, and USD 8750 respectively.
10. Is the market size provided in terms of value or volume?
The market size is provided in terms of value, measured in Million and volume, measured in liter .
11. Are there any specific market keywords associated with the report?
Yes, the market keyword associated with the report is "Fracking Water Treatment Industry," which aids in identifying and referencing the specific market segment covered.
12. How do I determine which pricing option suits my needs best?
The pricing options vary based on user requirements and access needs. Individual users may opt for single-user licenses, while businesses requiring broader access may choose multi-user or enterprise licenses for cost-effective access to the report.
13. Are there any additional resources or data provided in the Fracking Water Treatment Industry report?
While the report offers comprehensive insights, it's advisable to review the specific contents or supplementary materials provided to ascertain if additional resources or data are available.
14. How can I stay updated on further developments or reports in the Fracking Water Treatment Industry?
To stay informed about further developments, trends, and reports in the Fracking Water Treatment Industry, consider subscribing to industry newsletters, following relevant companies and organizations, or regularly checking reputable industry news sources and publications.
Methodology
Step 1 - Identification of Relevant Samples Size from Population Database


Step 2 - Approaches for Defining Global Market Size (Value, Volume* & Price*)

Note*: In applicable scenarios
Step 3 - Data Sources
Primary Research
- Web Analytics
- Survey Reports
- Research Institute
- Latest Research Reports
- Opinion Leaders
Secondary Research
- Annual Reports
- White Paper
- Latest Press Release
- Industry Association
- Paid Database
- Investor Presentations

Step 4 - Data Triangulation
Involves using different sources of information in order to increase the validity of a study
These sources are likely to be stakeholders in a program - participants, other researchers, program staff, other community members, and so on.
Then we put all data in single framework & apply various statistical tools to find out the dynamic on the market.
During the analysis stage, feedback from the stakeholder groups would be compared to determine areas of agreement as well as areas of divergence