

Key Insights
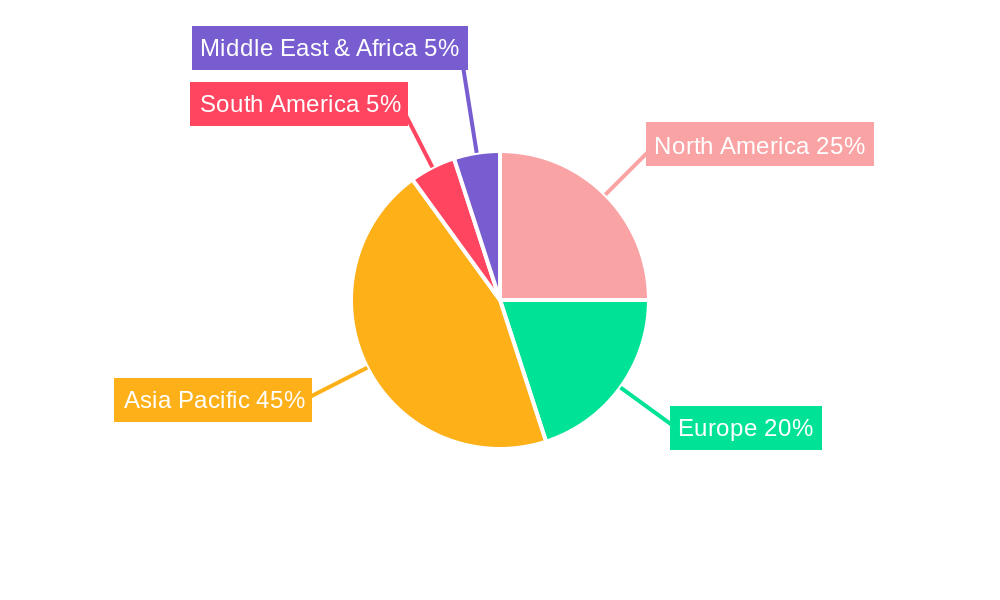
The global fly ash market, valued at approximately $13.01 billion in 2025, is projected to experience significant growth, exhibiting a Compound Annual Growth Rate (CAGR) of 6.91% from 2025 to 2033. This expansion is driven by increasing global construction activity, particularly in emerging economies like India and China, which significantly boosts demand for fly ash as a supplementary cementitious material in concrete. Stringent environmental regulations promoting reduced carbon emissions further incentivize the use of fly ash as a sustainable alternative to Portland cement. Growing awareness of sustainable construction practices and infrastructure development initiatives worldwide are also key growth factors. The market is segmented by type (Class F and Class C) and application (construction, Portland cement and concrete, agriculture, mining, water treatment, and others). Class F fly ash, due to its superior pozzolanic properties, commands a larger market share than Class C. The construction sector remains the leading application, followed by Portland cement and concrete production. While challenges like raw material price volatility and quality inconsistencies exist, the overall positive outlook, fueled by sustainable construction trends and infrastructure investments, is expected to mitigate these restraints. Geographically, the Asia-Pacific region, led by China and India, is projected to dominate due to large-scale construction projects and robust economic growth. North America and Europe also represent substantial market shares, driven by environmental concerns and government initiatives promoting sustainable building materials.
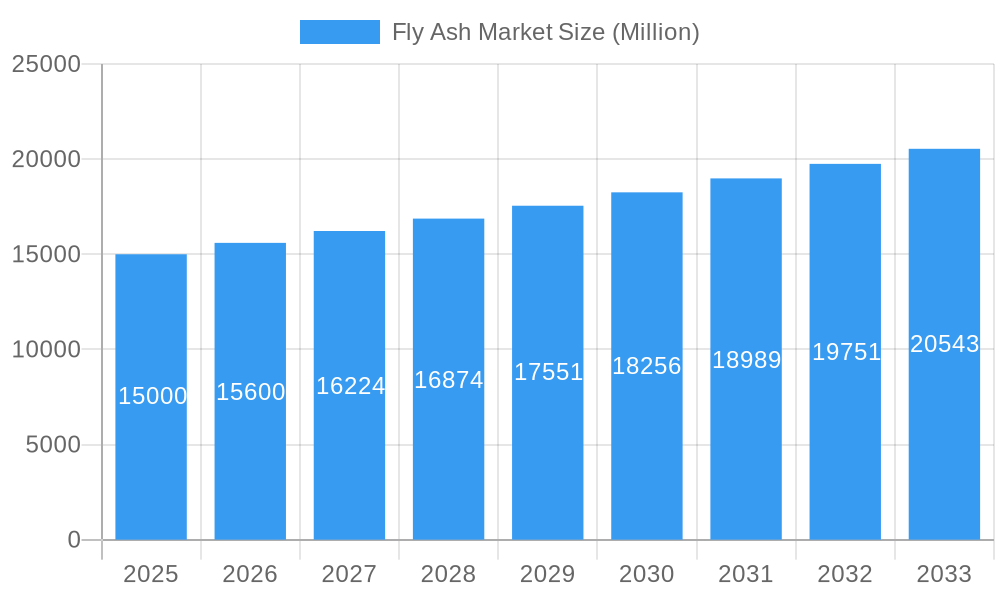
Fly Ash Market Market Size (In Billion)
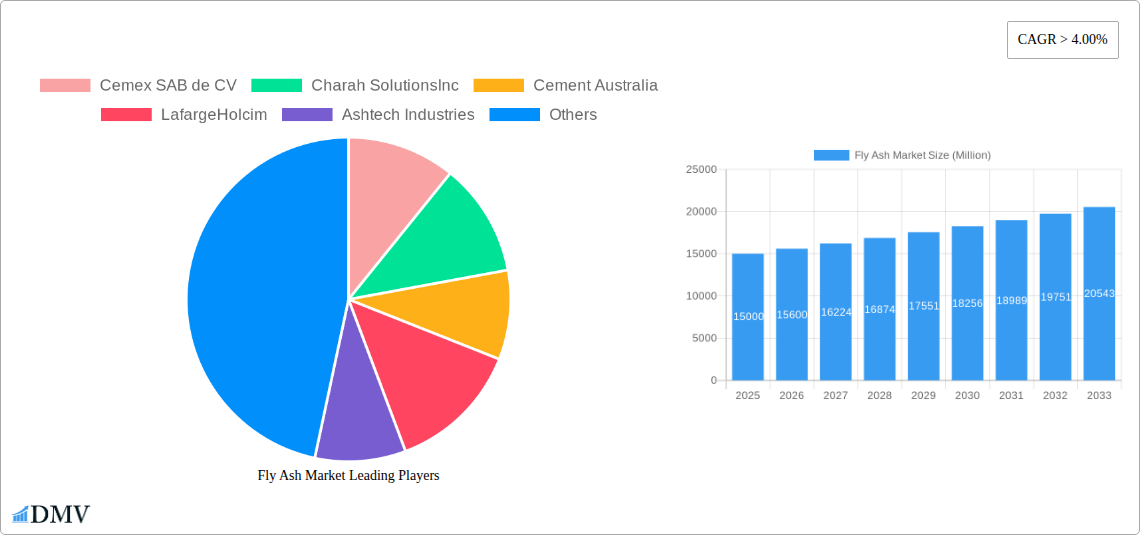
The competitive landscape features multinational corporations such as Cemex SAB de CV, LafargeHolcim, and Boral Resources, alongside regional players including Ashtech Industries and Suyog Suppliers. These companies are strategically pursuing partnerships, technological advancements, and geographical expansion to enhance their market position. Emerging applications of fly ash in geotechnical engineering and soil stabilization are creating additional growth opportunities. The forecast period of 2025-2033 offers considerable growth potential, underpinned by sustained focus on sustainable development, stringent environmental mandates, and a burgeoning construction industry. Consistent demand increases across various regions are anticipated, leading to further market expansion and consolidation among key industry participants.
Fly Ash Market Company Market Share
Fly Ash Market: A Comprehensive Report (2019-2033)
This insightful report provides a detailed analysis of the global fly ash market, encompassing historical data (2019-2024), the base year (2025), and a comprehensive forecast (2025-2033). Valued at xx Million in 2025, the market is poised for significant growth, driven by factors explored within this comprehensive study. This report is essential for stakeholders seeking to understand market dynamics, identify lucrative opportunities, and make informed strategic decisions.
Fly Ash Market Composition & Trends
The global fly ash market is characterized by moderate concentration, with key players such as Cemex SAB de CV, LafargeHolcim, and Boral Resources holding significant market share. However, the market also features several smaller, regional players, contributing to a dynamic competitive landscape. Innovation is driven by the need for sustainable construction materials and advancements in fly ash utilization technologies. Stringent environmental regulations are shaping market dynamics, pushing towards greater efficiency and responsible waste management. Substitute products, like slag cement, pose competitive pressure, while the increasing demand for sustainable building materials fuels market expansion.
- Market Share Distribution (2025): LafargeHolcim (xx%), Cemex SAB de CV (xx%), Boral Resources (xx%), Others (xx%).
- M&A Activity (2019-2025): A total of xx Million in deal value has been observed, with a notable increase in activity since 2022. These activities include Northstar's acquisition of Trans Ash and Eco Material Technologies acquisition of Boral Resources.
- End-User Profile: The construction industry dominates demand, followed by Portland cement and concrete manufacturing. Emerging applications in agriculture and water treatment are expanding the market.
Fly Ash Market Industry Evolution
The fly ash market has witnessed consistent growth over the past five years, fueled by the increasing adoption of sustainable construction practices and growing awareness of environmental concerns. Technological advancements, particularly in fly ash processing and application techniques, are enhancing the material's performance and expanding its utility. Consumer demand for eco-friendly products is further driving the adoption of fly ash in various sectors. The market is expected to experience a Compound Annual Growth Rate (CAGR) of xx% during the forecast period (2025-2033), reaching a projected value of xx Million by 2033.
The shift towards sustainable infrastructure projects, coupled with government initiatives promoting green building materials, is creating substantial opportunities for fly ash producers. Furthermore, innovative applications of fly ash in areas like geotechnical engineering and soil stabilization are opening new avenues for market expansion. The growing emphasis on carbon reduction across industries is also significantly contributing to the market's upward trajectory.
Leading Regions, Countries, or Segments in Fly Ash Market
The North American region currently holds the largest market share, driven by substantial construction activity and strong regulatory support for sustainable building practices. Within the product type segment, Class F fly ash dominates due to its widespread availability and superior properties. In terms of application, the construction industry continues to be the leading consumer of fly ash.
- Key Drivers in North America:
- High construction spending and infrastructure development.
- Stringent environmental regulations promoting sustainable building materials.
- Favorable government policies supporting the use of recycled materials.
- Class F Fly Ash Dominance: Superior pozzolanic properties compared to Class C fly ash.
- Construction Industry Leadership: Fly ash's cost-effectiveness and environmental benefits make it a preferred choice for various construction applications. Other applications, such as in agriculture and water treatment, are also growing rapidly.
Fly Ash Market Product Innovations
Recent innovations focus on enhancing fly ash's performance characteristics through advanced processing techniques and novel applications. These include the development of high-performance concrete mixes incorporating fly ash, along with specialized formulations tailored to specific industry needs. The unique selling propositions lie in the material’s cost-effectiveness, eco-friendly nature, and enhanced material properties compared to traditional alternatives.
Propelling Factors for Fly Ash Market Growth
Several factors are driving the growth of the fly ash market. These include increasing environmental regulations encouraging the use of sustainable materials, stringent emission control policies in the power generation sector (leading to increased fly ash availability), and a rising demand for cost-effective construction materials. Technological advancements in processing and application methods further contribute to expanding market opportunities.
Obstacles in the Fly Ash Market Market
The fly ash market faces challenges such as fluctuations in the availability of fly ash due to changes in power generation, variations in fly ash quality impacting its performance, and competitive pressures from alternative construction materials. Supply chain disruptions also pose a significant risk to market stability.
Future Opportunities in Fly Ash Market
Emerging opportunities lie in expanding the applications of fly ash in advanced materials, such as geopolymers and self-healing concrete. Growing demand for sustainable infrastructure development in developing economies presents substantial growth potential. Moreover, the integration of fly ash into new technological advancements is creating exciting opportunities for market expansion.
Major Players in the Fly Ash Market Ecosystem
- Cemex SAB de CV
- Charah Solutions Inc
- Cement Australia
- LafargeHolcim
- Ashtech Industries
- Waste Management
- Salt River Materials Group
- Suyog Suppliers
- Seperation Technologies LLC
- Boral Resources
Key Developments in Fly Ash Market Industry
- January 2023: Northstar Advisors Pte. Ltd. acquired Trans Ash Inc., strengthening its position in the coal ash remediation market.
- February 2022: Eco Material Technologies acquired Boral Resources, fostering innovation in near-zero carbon cement products.
Strategic Fly Ash Market Market Forecast
The fly ash market is expected to maintain its growth trajectory, driven by the continued adoption of sustainable building practices, technological advancements, and expanding applications. The market’s potential is significant, with projections indicating strong growth in both developed and developing economies. The focus on environmental sustainability and the increasing availability of fly ash will be key drivers for the future.
Fly Ash Market Segmentation
-
1. Type
- 1.1. Class F
- 1.2. Class C
-
2. Application
-
2.1. Construction
- 2.1.1. Bricks and Blocks
- 2.1.2. Road Construction
- 2.1.3. Portland Cement and Concrete
- 2.2. Agriculture
- 2.3. Mining
- 2.4. Water Treatment
- 2.5. Other Applications
-
2.1. Construction
Fly Ash Market Segmentation By Geography
-
1. Asia Pacific
- 1.1. China
- 1.2. India
- 1.3. Japan
- 1.4. South Korea
- 1.5. Rest of Asia Pacific
-
2. North America
- 2.1. United States
- 2.2. Canada
- 2.3. Mexico
-
3. Europe
- 3.1. Germany
- 3.2. United Kingdom
- 3.3. Italy
- 3.4. France
- 3.5. Rest of Europe
-
4. South America
- 4.1. Brazil
- 4.2. Argentina
- 4.3. Rest of South America
-
5. Middle East & Africa
- 5.1. UAE
- 5.2. Saudi Arabia
- 5.3. South Africa
- 5.4. Rest of Middle East & Africa
Fly Ash Market Regional Market Share
Geographic Coverage of Fly Ash Market
Fly Ash Market REPORT HIGHLIGHTS
| Aspects | Details |
|---|---|
| Study Period | 2020-2034 |
| Base Year | 2025 |
| Estimated Year | 2026 |
| Forecast Period | 2026-2034 |
| Historical Period | 2020-2025 |
| Growth Rate | CAGR of 6.91% from 2020-2034 |
| Segmentation |
|
Table of Contents
- 1. Introduction
- 1.1. Research Scope
- 1.2. Market Segmentation
- 1.3. Research Objective
- 1.4. Definitions and Assumptions
- 2. Executive Summary
- 2.1. Market Snapshot
- 3. Market Dynamics
- 3.1. Market Drivers
- 3.2. Market Restrains
- 3.3. Market Trends
- 3.4. Market Opportunities
- 4. Market Factor Analysis
- 4.1. Porters Five Forces
- 4.1.1. Bargaining Power of Suppliers
- 4.1.2. Bargaining Power of Buyers
- 4.1.3. Threat of New Entrants
- 4.1.4. Threat of Substitutes
- 4.1.5. Competitive Rivalry
- 4.2. PESTEL analysis
- 4.3. BCG Analysis
- 4.3.1. Stars (High Growth, High Market Share)
- 4.3.2. Cash Cows (Low Growth, High Market Share)
- 4.3.3. Question Mark (High Growth, Low Market Share)
- 4.3.4. Dogs (Low Growth, Low Market Share)
- 4.4. Ansoff Matrix Analysis
- 4.5. Supply Chain Analysis
- 4.6. Regulatory Landscape
- 4.7. Current Market Potential and Opportunity Assessment (TAM–SAM–SOM Framework)
- 4.8. DMV Analyst Note
- 4.1. Porters Five Forces
- 5. Market Analysis, Insights and Forecast 2021-2033
- 5.1. Market Analysis, Insights and Forecast - by Type
- 5.1.1. Class F
- 5.1.2. Class C
- 5.2. Market Analysis, Insights and Forecast - by Application
- 5.2.1. Construction
- 5.2.1.1. Bricks and Blocks
- 5.2.1.2. Road Construction
- 5.2.1.3. Portland Cement and Concrete
- 5.2.2. Agriculture
- 5.2.3. Mining
- 5.2.4. Water Treatment
- 5.2.5. Other Applications
- 5.2.1. Construction
- 5.3. Market Analysis, Insights and Forecast - by Region
- 5.3.1. Asia Pacific
- 5.3.2. North America
- 5.3.3. Europe
- 5.3.4. South America
- 5.3.5. Middle East & Africa
- 5.1. Market Analysis, Insights and Forecast - by Type
- 6. Global Fly Ash Market Analysis, Insights and Forecast, 2021-2033
- 6.1. Market Analysis, Insights and Forecast - by Type
- 6.1.1. Class F
- 6.1.2. Class C
- 6.2. Market Analysis, Insights and Forecast - by Application
- 6.2.1. Construction
- 6.2.1.1. Bricks and Blocks
- 6.2.1.2. Road Construction
- 6.2.1.3. Portland Cement and Concrete
- 6.2.2. Agriculture
- 6.2.3. Mining
- 6.2.4. Water Treatment
- 6.2.5. Other Applications
- 6.2.1. Construction
- 6.1. Market Analysis, Insights and Forecast - by Type
- 7. Asia Pacific Fly Ash Market Analysis, Insights and Forecast, 2020-2032
- 7.1. Market Analysis, Insights and Forecast - by Type
- 7.1.1. Class F
- 7.1.2. Class C
- 7.2. Market Analysis, Insights and Forecast - by Application
- 7.2.1. Construction
- 7.2.1.1. Bricks and Blocks
- 7.2.1.2. Road Construction
- 7.2.1.3. Portland Cement and Concrete
- 7.2.2. Agriculture
- 7.2.3. Mining
- 7.2.4. Water Treatment
- 7.2.5. Other Applications
- 7.2.1. Construction
- 7.1. Market Analysis, Insights and Forecast - by Type
- 8. North America Fly Ash Market Analysis, Insights and Forecast, 2020-2032
- 8.1. Market Analysis, Insights and Forecast - by Type
- 8.1.1. Class F
- 8.1.2. Class C
- 8.2. Market Analysis, Insights and Forecast - by Application
- 8.2.1. Construction
- 8.2.1.1. Bricks and Blocks
- 8.2.1.2. Road Construction
- 8.2.1.3. Portland Cement and Concrete
- 8.2.2. Agriculture
- 8.2.3. Mining
- 8.2.4. Water Treatment
- 8.2.5. Other Applications
- 8.2.1. Construction
- 8.1. Market Analysis, Insights and Forecast - by Type
- 9. Europe Fly Ash Market Analysis, Insights and Forecast, 2020-2032
- 9.1. Market Analysis, Insights and Forecast - by Type
- 9.1.1. Class F
- 9.1.2. Class C
- 9.2. Market Analysis, Insights and Forecast - by Application
- 9.2.1. Construction
- 9.2.1.1. Bricks and Blocks
- 9.2.1.2. Road Construction
- 9.2.1.3. Portland Cement and Concrete
- 9.2.2. Agriculture
- 9.2.3. Mining
- 9.2.4. Water Treatment
- 9.2.5. Other Applications
- 9.2.1. Construction
- 9.1. Market Analysis, Insights and Forecast - by Type
- 10. South America Fly Ash Market Analysis, Insights and Forecast, 2020-2032
- 10.1. Market Analysis, Insights and Forecast - by Type
- 10.1.1. Class F
- 10.1.2. Class C
- 10.2. Market Analysis, Insights and Forecast - by Application
- 10.2.1. Construction
- 10.2.1.1. Bricks and Blocks
- 10.2.1.2. Road Construction
- 10.2.1.3. Portland Cement and Concrete
- 10.2.2. Agriculture
- 10.2.3. Mining
- 10.2.4. Water Treatment
- 10.2.5. Other Applications
- 10.2.1. Construction
- 10.1. Market Analysis, Insights and Forecast - by Type
- 11. Middle East & Africa Fly Ash Market Analysis, Insights and Forecast, 2020-2032
- 11.1. Market Analysis, Insights and Forecast - by Type
- 11.1.1. Class F
- 11.1.2. Class C
- 11.2. Market Analysis, Insights and Forecast - by Application
- 11.2.1. Construction
- 11.2.1.1. Bricks and Blocks
- 11.2.1.2. Road Construction
- 11.2.1.3. Portland Cement and Concrete
- 11.2.2. Agriculture
- 11.2.3. Mining
- 11.2.4. Water Treatment
- 11.2.5. Other Applications
- 11.2.1. Construction
- 11.1. Market Analysis, Insights and Forecast - by Type
- 12. Competitive Analysis
- 12.1. Company Profiles
- 12.1.1 Cemex SAB de CV
- 12.1.1.1. Company Overview
- 12.1.1.2. Products
- 12.1.1.3. Company Financials
- 12.1.1.4. SWOT Analysis
- 12.1.2 Charah SolutionsInc
- 12.1.2.1. Company Overview
- 12.1.2.2. Products
- 12.1.2.3. Company Financials
- 12.1.2.4. SWOT Analysis
- 12.1.3 Cement Australia
- 12.1.3.1. Company Overview
- 12.1.3.2. Products
- 12.1.3.3. Company Financials
- 12.1.3.4. SWOT Analysis
- 12.1.4 LafargeHolcim
- 12.1.4.1. Company Overview
- 12.1.4.2. Products
- 12.1.4.3. Company Financials
- 12.1.4.4. SWOT Analysis
- 12.1.5 Ashtech Industries
- 12.1.5.1. Company Overview
- 12.1.5.2. Products
- 12.1.5.3. Company Financials
- 12.1.5.4. SWOT Analysis
- 12.1.6 Waste Management
- 12.1.6.1. Company Overview
- 12.1.6.2. Products
- 12.1.6.3. Company Financials
- 12.1.6.4. SWOT Analysis
- 12.1.7 Salt River Materials Group
- 12.1.7.1. Company Overview
- 12.1.7.2. Products
- 12.1.7.3. Company Financials
- 12.1.7.4. SWOT Analysis
- 12.1.8 Suyog Suppliers
- 12.1.8.1. Company Overview
- 12.1.8.2. Products
- 12.1.8.3. Company Financials
- 12.1.8.4. SWOT Analysis
- 12.1.9 Seperation Technologies LLC
- 12.1.9.1. Company Overview
- 12.1.9.2. Products
- 12.1.9.3. Company Financials
- 12.1.9.4. SWOT Analysis
- 12.1.10 Boral Resources
- 12.1.10.1. Company Overview
- 12.1.10.2. Products
- 12.1.10.3. Company Financials
- 12.1.10.4. SWOT Analysis
- 12.1.1 Cemex SAB de CV
- 12.2. Market Entropy
- 12.2.1 Company's Key Areas Served
- 12.2.2 Recent Developments
- 12.3. Company Market Share Analysis 2025
- 12.3.1 Top 5 Companies Market Share Analysis
- 12.3.2 Top 3 Companies Market Share Analysis
- 12.4. List of Potential Customers
- 13. Research Methodology
List of Figures
- Figure 1: Global Fly Ash Market Revenue Breakdown (billion, %) by Region 2025 & 2033
- Figure 2: Global Fly Ash Market Volume Breakdown (K Tons, %) by Region 2025 & 2033
- Figure 3: Asia Pacific Fly Ash Market Revenue (billion), by Type 2025 & 2033
- Figure 4: Asia Pacific Fly Ash Market Volume (K Tons), by Type 2025 & 2033
- Figure 5: Asia Pacific Fly Ash Market Revenue Share (%), by Type 2025 & 2033
- Figure 6: Asia Pacific Fly Ash Market Volume Share (%), by Type 2025 & 2033
- Figure 7: Asia Pacific Fly Ash Market Revenue (billion), by Application 2025 & 2033
- Figure 8: Asia Pacific Fly Ash Market Volume (K Tons), by Application 2025 & 2033
- Figure 9: Asia Pacific Fly Ash Market Revenue Share (%), by Application 2025 & 2033
- Figure 10: Asia Pacific Fly Ash Market Volume Share (%), by Application 2025 & 2033
- Figure 11: Asia Pacific Fly Ash Market Revenue (billion), by Country 2025 & 2033
- Figure 12: Asia Pacific Fly Ash Market Volume (K Tons), by Country 2025 & 2033
- Figure 13: Asia Pacific Fly Ash Market Revenue Share (%), by Country 2025 & 2033
- Figure 14: Asia Pacific Fly Ash Market Volume Share (%), by Country 2025 & 2033
- Figure 15: North America Fly Ash Market Revenue (billion), by Type 2025 & 2033
- Figure 16: North America Fly Ash Market Volume (K Tons), by Type 2025 & 2033
- Figure 17: North America Fly Ash Market Revenue Share (%), by Type 2025 & 2033
- Figure 18: North America Fly Ash Market Volume Share (%), by Type 2025 & 2033
- Figure 19: North America Fly Ash Market Revenue (billion), by Application 2025 & 2033
- Figure 20: North America Fly Ash Market Volume (K Tons), by Application 2025 & 2033
- Figure 21: North America Fly Ash Market Revenue Share (%), by Application 2025 & 2033
- Figure 22: North America Fly Ash Market Volume Share (%), by Application 2025 & 2033
- Figure 23: North America Fly Ash Market Revenue (billion), by Country 2025 & 2033
- Figure 24: North America Fly Ash Market Volume (K Tons), by Country 2025 & 2033
- Figure 25: North America Fly Ash Market Revenue Share (%), by Country 2025 & 2033
- Figure 26: North America Fly Ash Market Volume Share (%), by Country 2025 & 2033
- Figure 27: Europe Fly Ash Market Revenue (billion), by Type 2025 & 2033
- Figure 28: Europe Fly Ash Market Volume (K Tons), by Type 2025 & 2033
- Figure 29: Europe Fly Ash Market Revenue Share (%), by Type 2025 & 2033
- Figure 30: Europe Fly Ash Market Volume Share (%), by Type 2025 & 2033
- Figure 31: Europe Fly Ash Market Revenue (billion), by Application 2025 & 2033
- Figure 32: Europe Fly Ash Market Volume (K Tons), by Application 2025 & 2033
- Figure 33: Europe Fly Ash Market Revenue Share (%), by Application 2025 & 2033
- Figure 34: Europe Fly Ash Market Volume Share (%), by Application 2025 & 2033
- Figure 35: Europe Fly Ash Market Revenue (billion), by Country 2025 & 2033
- Figure 36: Europe Fly Ash Market Volume (K Tons), by Country 2025 & 2033
- Figure 37: Europe Fly Ash Market Revenue Share (%), by Country 2025 & 2033
- Figure 38: Europe Fly Ash Market Volume Share (%), by Country 2025 & 2033
- Figure 39: South America Fly Ash Market Revenue (billion), by Type 2025 & 2033
- Figure 40: South America Fly Ash Market Volume (K Tons), by Type 2025 & 2033
- Figure 41: South America Fly Ash Market Revenue Share (%), by Type 2025 & 2033
- Figure 42: South America Fly Ash Market Volume Share (%), by Type 2025 & 2033
- Figure 43: South America Fly Ash Market Revenue (billion), by Application 2025 & 2033
- Figure 44: South America Fly Ash Market Volume (K Tons), by Application 2025 & 2033
- Figure 45: South America Fly Ash Market Revenue Share (%), by Application 2025 & 2033
- Figure 46: South America Fly Ash Market Volume Share (%), by Application 2025 & 2033
- Figure 47: South America Fly Ash Market Revenue (billion), by Country 2025 & 2033
- Figure 48: South America Fly Ash Market Volume (K Tons), by Country 2025 & 2033
- Figure 49: South America Fly Ash Market Revenue Share (%), by Country 2025 & 2033
- Figure 50: South America Fly Ash Market Volume Share (%), by Country 2025 & 2033
- Figure 51: Middle East & Africa Fly Ash Market Revenue (billion), by Type 2025 & 2033
- Figure 52: Middle East & Africa Fly Ash Market Volume (K Tons), by Type 2025 & 2033
- Figure 53: Middle East & Africa Fly Ash Market Revenue Share (%), by Type 2025 & 2033
- Figure 54: Middle East & Africa Fly Ash Market Volume Share (%), by Type 2025 & 2033
- Figure 55: Middle East & Africa Fly Ash Market Revenue (billion), by Application 2025 & 2033
- Figure 56: Middle East & Africa Fly Ash Market Volume (K Tons), by Application 2025 & 2033
- Figure 57: Middle East & Africa Fly Ash Market Revenue Share (%), by Application 2025 & 2033
- Figure 58: Middle East & Africa Fly Ash Market Volume Share (%), by Application 2025 & 2033
- Figure 59: Middle East & Africa Fly Ash Market Revenue (billion), by Country 2025 & 2033
- Figure 60: Middle East & Africa Fly Ash Market Volume (K Tons), by Country 2025 & 2033
- Figure 61: Middle East & Africa Fly Ash Market Revenue Share (%), by Country 2025 & 2033
- Figure 62: Middle East & Africa Fly Ash Market Volume Share (%), by Country 2025 & 2033
List of Tables
- Table 1: Global Fly Ash Market Revenue billion Forecast, by Type 2020 & 2033
- Table 2: Global Fly Ash Market Volume K Tons Forecast, by Type 2020 & 2033
- Table 3: Global Fly Ash Market Revenue billion Forecast, by Application 2020 & 2033
- Table 4: Global Fly Ash Market Volume K Tons Forecast, by Application 2020 & 2033
- Table 5: Global Fly Ash Market Revenue billion Forecast, by Region 2020 & 2033
- Table 6: Global Fly Ash Market Volume K Tons Forecast, by Region 2020 & 2033
- Table 7: Global Fly Ash Market Revenue billion Forecast, by Type 2020 & 2033
- Table 8: Global Fly Ash Market Volume K Tons Forecast, by Type 2020 & 2033
- Table 9: Global Fly Ash Market Revenue billion Forecast, by Application 2020 & 2033
- Table 10: Global Fly Ash Market Volume K Tons Forecast, by Application 2020 & 2033
- Table 11: Global Fly Ash Market Revenue billion Forecast, by Country 2020 & 2033
- Table 12: Global Fly Ash Market Volume K Tons Forecast, by Country 2020 & 2033
- Table 13: China Fly Ash Market Revenue (billion) Forecast, by Application 2020 & 2033
- Table 14: China Fly Ash Market Volume (K Tons) Forecast, by Application 2020 & 2033
- Table 15: India Fly Ash Market Revenue (billion) Forecast, by Application 2020 & 2033
- Table 16: India Fly Ash Market Volume (K Tons) Forecast, by Application 2020 & 2033
- Table 17: Japan Fly Ash Market Revenue (billion) Forecast, by Application 2020 & 2033
- Table 18: Japan Fly Ash Market Volume (K Tons) Forecast, by Application 2020 & 2033
- Table 19: South Korea Fly Ash Market Revenue (billion) Forecast, by Application 2020 & 2033
- Table 20: South Korea Fly Ash Market Volume (K Tons) Forecast, by Application 2020 & 2033
- Table 21: Rest of Asia Pacific Fly Ash Market Revenue (billion) Forecast, by Application 2020 & 2033
- Table 22: Rest of Asia Pacific Fly Ash Market Volume (K Tons) Forecast, by Application 2020 & 2033
- Table 23: Global Fly Ash Market Revenue billion Forecast, by Type 2020 & 2033
- Table 24: Global Fly Ash Market Volume K Tons Forecast, by Type 2020 & 2033
- Table 25: Global Fly Ash Market Revenue billion Forecast, by Application 2020 & 2033
- Table 26: Global Fly Ash Market Volume K Tons Forecast, by Application 2020 & 2033
- Table 27: Global Fly Ash Market Revenue billion Forecast, by Country 2020 & 2033
- Table 28: Global Fly Ash Market Volume K Tons Forecast, by Country 2020 & 2033
- Table 29: United States Fly Ash Market Revenue (billion) Forecast, by Application 2020 & 2033
- Table 30: United States Fly Ash Market Volume (K Tons) Forecast, by Application 2020 & 2033
- Table 31: Canada Fly Ash Market Revenue (billion) Forecast, by Application 2020 & 2033
- Table 32: Canada Fly Ash Market Volume (K Tons) Forecast, by Application 2020 & 2033
- Table 33: Mexico Fly Ash Market Revenue (billion) Forecast, by Application 2020 & 2033
- Table 34: Mexico Fly Ash Market Volume (K Tons) Forecast, by Application 2020 & 2033
- Table 35: Global Fly Ash Market Revenue billion Forecast, by Type 2020 & 2033
- Table 36: Global Fly Ash Market Volume K Tons Forecast, by Type 2020 & 2033
- Table 37: Global Fly Ash Market Revenue billion Forecast, by Application 2020 & 2033
- Table 38: Global Fly Ash Market Volume K Tons Forecast, by Application 2020 & 2033
- Table 39: Global Fly Ash Market Revenue billion Forecast, by Country 2020 & 2033
- Table 40: Global Fly Ash Market Volume K Tons Forecast, by Country 2020 & 2033
- Table 41: Germany Fly Ash Market Revenue (billion) Forecast, by Application 2020 & 2033
- Table 42: Germany Fly Ash Market Volume (K Tons) Forecast, by Application 2020 & 2033
- Table 43: United Kingdom Fly Ash Market Revenue (billion) Forecast, by Application 2020 & 2033
- Table 44: United Kingdom Fly Ash Market Volume (K Tons) Forecast, by Application 2020 & 2033
- Table 45: Italy Fly Ash Market Revenue (billion) Forecast, by Application 2020 & 2033
- Table 46: Italy Fly Ash Market Volume (K Tons) Forecast, by Application 2020 & 2033
- Table 47: France Fly Ash Market Revenue (billion) Forecast, by Application 2020 & 2033
- Table 48: France Fly Ash Market Volume (K Tons) Forecast, by Application 2020 & 2033
- Table 49: Rest of Europe Fly Ash Market Revenue (billion) Forecast, by Application 2020 & 2033
- Table 50: Rest of Europe Fly Ash Market Volume (K Tons) Forecast, by Application 2020 & 2033
- Table 51: Global Fly Ash Market Revenue billion Forecast, by Type 2020 & 2033
- Table 52: Global Fly Ash Market Volume K Tons Forecast, by Type 2020 & 2033
- Table 53: Global Fly Ash Market Revenue billion Forecast, by Application 2020 & 2033
- Table 54: Global Fly Ash Market Volume K Tons Forecast, by Application 2020 & 2033
- Table 55: Global Fly Ash Market Revenue billion Forecast, by Country 2020 & 2033
- Table 56: Global Fly Ash Market Volume K Tons Forecast, by Country 2020 & 2033
- Table 57: Brazil Fly Ash Market Revenue (billion) Forecast, by Application 2020 & 2033
- Table 58: Brazil Fly Ash Market Volume (K Tons) Forecast, by Application 2020 & 2033
- Table 59: Argentina Fly Ash Market Revenue (billion) Forecast, by Application 2020 & 2033
- Table 60: Argentina Fly Ash Market Volume (K Tons) Forecast, by Application 2020 & 2033
- Table 61: Rest of South America Fly Ash Market Revenue (billion) Forecast, by Application 2020 & 2033
- Table 62: Rest of South America Fly Ash Market Volume (K Tons) Forecast, by Application 2020 & 2033
- Table 63: Global Fly Ash Market Revenue billion Forecast, by Type 2020 & 2033
- Table 64: Global Fly Ash Market Volume K Tons Forecast, by Type 2020 & 2033
- Table 65: Global Fly Ash Market Revenue billion Forecast, by Application 2020 & 2033
- Table 66: Global Fly Ash Market Volume K Tons Forecast, by Application 2020 & 2033
- Table 67: Global Fly Ash Market Revenue billion Forecast, by Country 2020 & 2033
- Table 68: Global Fly Ash Market Volume K Tons Forecast, by Country 2020 & 2033
- Table 69: UAE Fly Ash Market Revenue (billion) Forecast, by Application 2020 & 2033
- Table 70: UAE Fly Ash Market Volume (K Tons) Forecast, by Application 2020 & 2033
- Table 71: Saudi Arabia Fly Ash Market Revenue (billion) Forecast, by Application 2020 & 2033
- Table 72: Saudi Arabia Fly Ash Market Volume (K Tons) Forecast, by Application 2020 & 2033
- Table 73: South Africa Fly Ash Market Revenue (billion) Forecast, by Application 2020 & 2033
- Table 74: South Africa Fly Ash Market Volume (K Tons) Forecast, by Application 2020 & 2033
- Table 75: Rest of Middle East & Africa Fly Ash Market Revenue (billion) Forecast, by Application 2020 & 2033
- Table 76: Rest of Middle East & Africa Fly Ash Market Volume (K Tons) Forecast, by Application 2020 & 2033
Frequently Asked Questions
1. What is the projected Compound Annual Growth Rate (CAGR) of the Fly Ash Market?
The projected CAGR is approximately 6.91%.
2. Which companies are prominent players in the Fly Ash Market?
Key companies in the market include Cemex SAB de CV, Charah SolutionsInc, Cement Australia, LafargeHolcim, Ashtech Industries, Waste Management, Salt River Materials Group, Suyog Suppliers, Seperation Technologies LLC, Boral Resources.
3. What are the main segments of the Fly Ash Market?
The market segments include Type, Application.
4. Can you provide details about the market size?
The market size is estimated to be USD 13.01 billion as of 2022.
5. What are some drivers contributing to market growth?
Increasing Demand from the Construction Industry; Government Policies to Promote the Usage of Fly Ash.
6. What are the notable trends driving market growth?
Increasing Demand from the Construction Industry.
7. Are there any restraints impacting market growth?
Harmful Properties of Fly Ash; Non-suitability in Cold Weather Conditions.
8. Can you provide examples of recent developments in the market?
January 2023: Northstar Advisors Pte. Ltd. acquired Trans Ash Inc., a leading provider of coal ash to utility customers across North America. The acquisition between both companies will enhance the existing capabilities of Northstar Group serving the coal ash remediation market.
9. What pricing options are available for accessing the report?
Pricing options include single-user, multi-user, and enterprise licenses priced at USD 4750, USD 5250, and USD 8750 respectively.
10. Is the market size provided in terms of value or volume?
The market size is provided in terms of value, measured in billion and volume, measured in K Tons.
11. Are there any specific market keywords associated with the report?
Yes, the market keyword associated with the report is "Fly Ash Market," which aids in identifying and referencing the specific market segment covered.
12. How do I determine which pricing option suits my needs best?
The pricing options vary based on user requirements and access needs. Individual users may opt for single-user licenses, while businesses requiring broader access may choose multi-user or enterprise licenses for cost-effective access to the report.
13. Are there any additional resources or data provided in the Fly Ash Market report?
While the report offers comprehensive insights, it's advisable to review the specific contents or supplementary materials provided to ascertain if additional resources or data are available.
14. How can I stay updated on further developments or reports in the Fly Ash Market?
To stay informed about further developments, trends, and reports in the Fly Ash Market, consider subscribing to industry newsletters, following relevant companies and organizations, or regularly checking reputable industry news sources and publications.
Methodology
Step 1 - Identification of Relevant Samples Size from Population Database


Step 2 - Approaches for Defining Global Market Size (Value, Volume* & Price*)

Note*: In applicable scenarios
Step 3 - Data Sources
Primary Research
- Web Analytics
- Survey Reports
- Research Institute
- Latest Research Reports
- Opinion Leaders
Secondary Research
- Annual Reports
- White Paper
- Latest Press Release
- Industry Association
- Paid Database
- Investor Presentations

Step 4 - Data Triangulation
Involves using different sources of information in order to increase the validity of a study
These sources are likely to be stakeholders in a program - participants, other researchers, program staff, other community members, and so on.
Then we put all data in single framework & apply various statistical tools to find out the dynamic on the market.
During the analysis stage, feedback from the stakeholder groups would be compared to determine areas of agreement as well as areas of divergence