

Key Insights
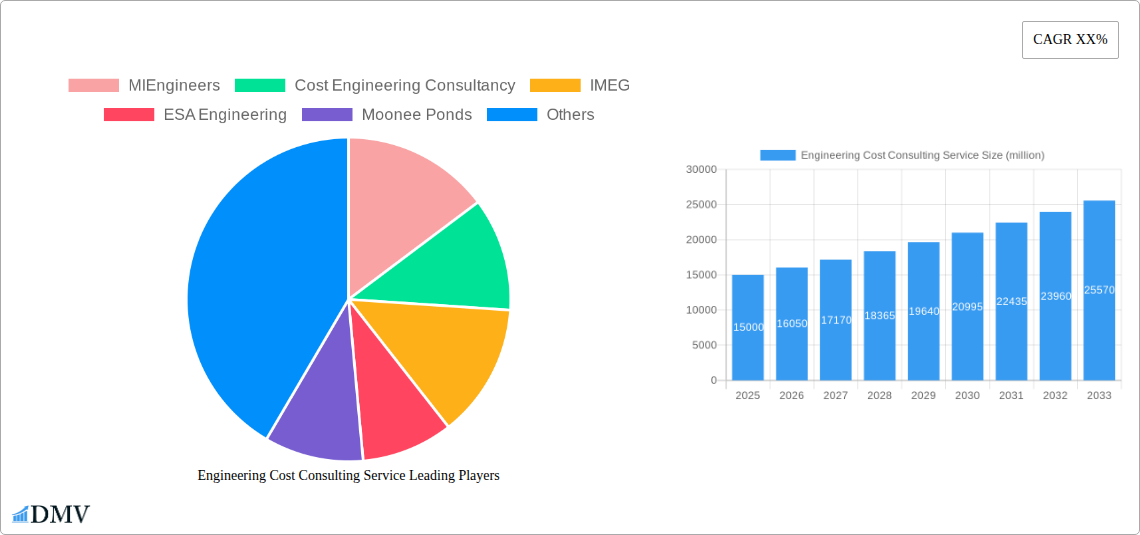
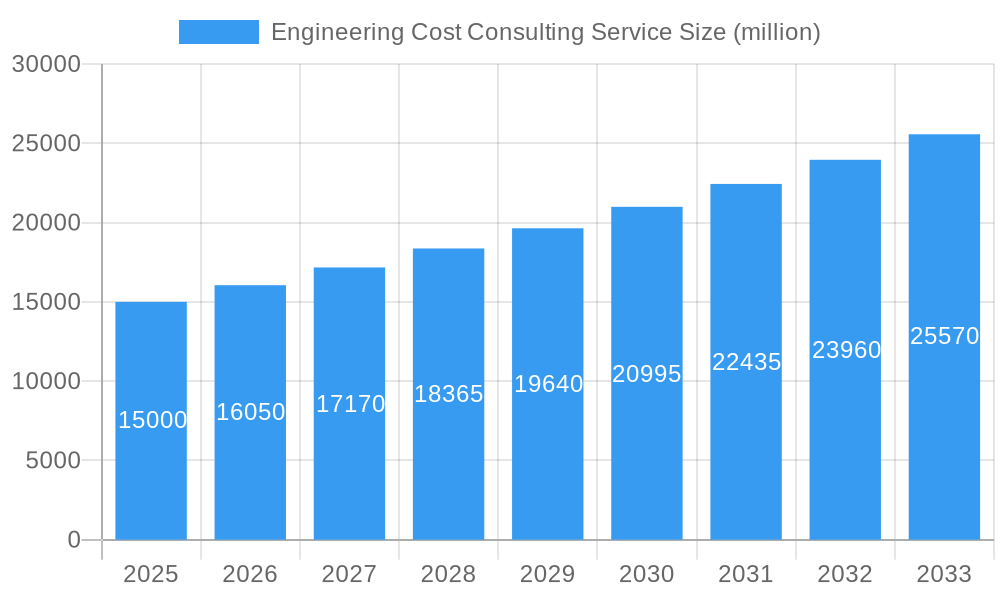
The Engineering Cost Consulting Services market is experiencing robust growth, driven by increasing complexity in infrastructure projects, stringent regulatory requirements, and the need for optimized resource allocation. The market, estimated at $15 billion in 2025, is projected to exhibit a Compound Annual Growth Rate (CAGR) of 7% from 2025 to 2033, reaching an estimated $25 billion by 2033. This growth is fueled by several key trends: the adoption of Building Information Modeling (BIM) for cost estimation, a rising demand for sustainable and green building practices requiring specialized cost analysis, and a growing emphasis on risk management throughout the project lifecycle. Major players like Arcadis, IMEG, and others are leveraging technological advancements and strategic acquisitions to expand their market share. However, market growth faces some restraints, including fluctuations in raw material prices, economic downturns impacting construction activity, and a shortage of skilled cost engineers. The market is segmented by service type (pre-construction, construction, post-construction), project type (residential, commercial, industrial, infrastructure), and geography.
Engineering Cost Consulting Service Market Size (In Billion)
The competitive landscape is characterized by a mix of large multinational firms and specialized niche players. Companies like Arcadis and IMEG benefit from extensive global reach and diverse service offerings, while smaller firms often focus on specific market segments or geographical areas. Successful players are increasingly focusing on delivering value-added services beyond traditional cost estimation, incorporating data analytics, risk mitigation strategies, and life-cycle cost analysis to provide clients with comprehensive solutions. Future growth will likely be driven by innovation in cost estimation methodologies, integration with advanced project management tools, and a growing emphasis on data-driven decision-making within the construction and engineering sectors. The continued adoption of digital technologies and the increasing need for cost optimization will be crucial factors in shaping the future of this dynamic market.
Engineering Cost Consulting Service Company Market Share
Engineering Cost Consulting Service Market Report: 2019-2033
This comprehensive report provides an in-depth analysis of the Engineering Cost Consulting Service market, offering invaluable insights for stakeholders seeking to navigate this dynamic landscape. The report covers the period 2019-2033, with a focus on the forecast period 2025-2033 and a base year of 2025. The market is evaluated in terms of its size (reaching xx million by 2033), composition, growth drivers, challenges, and future opportunities. Key players such as MIEngineers, Cost Engineering Consultancy, IMEG, and others are profiled, highlighting their market strategies and contributions.
Engineering Cost Consulting Service Market Composition & Trends
This section meticulously examines the Engineering Cost Consulting Service market's structure, revealing its concentration levels and identifying key trends shaping its evolution. We analyze the competitive intensity, examining market share distribution amongst leading players. For instance, preliminary estimates suggest that the top 5 players command approximately xx% of the market in 2025, with a projected xx% increase by 2033. This analysis also delves into innovation drivers, regulatory influences (including upcoming legislation impacting cost estimation methodologies), the emergence of substitute technologies (e.g., AI-driven cost prediction software), and evolving end-user demands across various sectors (e.g., infrastructure, energy). The report further assesses the impact of mergers and acquisitions (M&A) activities, with several deals exceeding $xx million in recent years significantly altering the competitive landscape. Examples of such activities include the acquisition of Company X by Company Y in 2022 for approximately $xx million, reshaping the market dynamics.
- Market Share Distribution (2025): Top 5 players: xx%, Others: xx%
- Projected Market Share Distribution (2033): Top 5 players: xx%, Others: xx%
- M&A Deal Values (2019-2024): Total value exceeding $xx million.
- Key Regulatory Changes: [Specific examples of regulatory changes and their impact, e.g., new environmental regulations affecting project costs].
Engineering Cost Consulting Service Industry Evolution
This section provides a detailed analysis of the Engineering Cost Consulting Service industry's evolution, focusing on market growth trajectories and technological advancements since 2019. The industry witnessed a CAGR of xx% between 2019 and 2024, driven largely by increasing infrastructure investment globally and a rise in complex projects requiring specialized cost management expertise. Technological advancements, such as the adoption of Building Information Modeling (BIM) and AI-powered cost estimation tools, have also significantly impacted the industry. The integration of these technologies is expected to continue accelerating, leading to improved accuracy, efficiency, and cost optimization. Shifts in consumer demand towards sustainability and data-driven decision-making are also influencing the industry's trajectory, pushing firms towards more sustainable and data-centric practices. We expect a continued robust growth, with a projected CAGR of xx% during the forecast period (2025-2033), driven by factors like increasing global infrastructure spending and the ongoing digital transformation within the engineering sector.
Leading Regions, Countries, or Segments in Engineering Cost Consulting Service
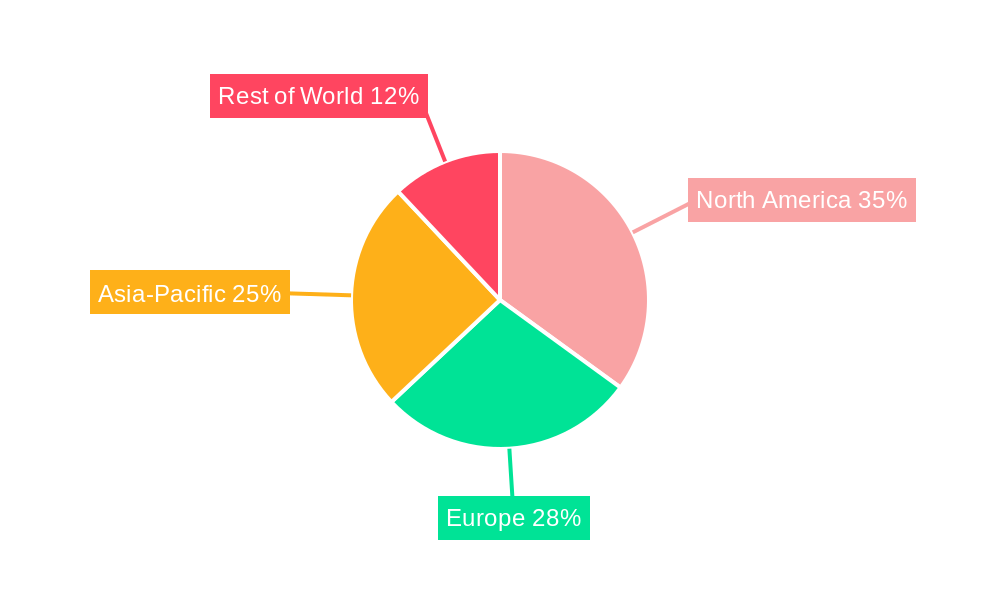
North America currently dominates the Engineering Cost Consulting Service market, driven primarily by robust infrastructure investment and a high concentration of leading consulting firms. The region's dominance is attributed to several key factors:
- High Infrastructure Spending: Significant government investments in infrastructure projects, including transportation, energy, and water management systems, fuels demand for cost consulting services.
- Technological Advancement: The region is at the forefront of adopting advanced technologies, such as BIM and AI, enhancing the efficiency and accuracy of cost estimation.
- Strong Regulatory Framework: A well-defined regulatory environment supporting sustainable and efficient infrastructure development contributes to the market's growth.
However, Asia Pacific is poised for rapid growth, with increasing urbanization and industrialization driving demand in countries such as China, India, and Japan. Europe also holds significant market share, driven by substantial investment in renewable energy infrastructure and a growing focus on sustainable development projects.
Engineering Cost Consulting Service Product Innovations
Recent years have seen significant advancements in the Engineering Cost Consulting Service market, with a strong focus on developing sophisticated software tools and data analytics platforms for enhanced cost estimation and risk management. The integration of Building Information Modeling (BIM) and artificial intelligence (AI) has significantly improved accuracy and efficiency, leading to more robust cost projections and reduced project overruns. These innovative offerings provide clients with real-time insights into project costs, facilitating better decision-making and optimizing resource allocation.
Propelling Factors for Engineering Cost Consulting Service Growth
Several factors are propelling growth in the Engineering Cost Consulting Service market. Increasing government spending on infrastructure projects worldwide creates considerable demand for expert cost consulting services. Technological advancements, including the wider adoption of BIM and AI, enhance accuracy and efficiency in cost estimation. Moreover, the increasing complexity of engineering projects necessitates the use of specialized cost consulting services to mitigate risks and ensure projects are delivered on time and within budget.
Obstacles in the Engineering Cost Consulting Service Market
The Engineering Cost Consulting Service market faces several challenges. Fluctuations in raw material prices and supply chain disruptions can significantly impact project costs and profitability. Intense competition among consulting firms puts pressure on pricing and profitability margins. Furthermore, changing regulatory environments and stringent environmental regulations add complexity to project planning and cost estimation.
Future Opportunities in Engineering Cost Consulting Service
Significant opportunities exist for growth in the Engineering Cost Consulting Service market. The expanding adoption of sustainable and green building practices presents opportunities for firms specializing in environmentally conscious cost management. Further, the growing demand for digital engineering and the integration of data analytics into cost consulting services offer significant potential for innovation and expansion. Emerging markets in developing countries also present attractive opportunities for growth.
Major Players in the Engineering Cost Consulting Service Ecosystem
- MIEngineers
- Cost Engineering Consultancy
- IMEG
- ESA Engineering
- Moonee Ponds
- Arcadis
- Engplan Consulting Engineers Ltd
- March Consulting Associates Inc.
- MASTPRO
- Vista Projects
- ALTINOK Consulting Engineering Limited Liability Company
Key Developments in Engineering Cost Consulting Service Industry
- 2022 Q3: Company X launched a new AI-powered cost estimation software.
- 2023 Q1: Company Y acquired Company Z, expanding its market reach.
- 2024 Q4: New environmental regulations impacting project costs came into effect. [Add more specific examples with dates and impact]
Strategic Engineering Cost Consulting Service Market Forecast
The Engineering Cost Consulting Service market is poised for continued growth, driven by increasing infrastructure investment, technological advancements, and the growing complexity of engineering projects. The market's future trajectory will be influenced by the adoption of innovative technologies, evolving regulatory landscapes, and the ability of firms to adapt to changing market demands. The projected growth in market value is expected to reach xx million by 2033, presenting significant opportunities for both established players and new entrants.
Engineering Cost Consulting Service Segmentation
-
1. Application
- 1.1. Residential
- 1.2. Industrial
- 1.3. Commercial
- 1.4. Infrastructure Sectors
- 1.5. Others
-
2. Types
- 2.1. Cost Estimating
- 2.2. Risk Management
- 2.3. Others
Engineering Cost Consulting Service Segmentation By Geography
-
1. North America
- 1.1. United States
- 1.2. Canada
- 1.3. Mexico
-
2. South America
- 2.1. Brazil
- 2.2. Argentina
- 2.3. Rest of South America
-
3. Europe
- 3.1. United Kingdom
- 3.2. Germany
- 3.3. France
- 3.4. Italy
- 3.5. Spain
- 3.6. Russia
- 3.7. Benelux
- 3.8. Nordics
- 3.9. Rest of Europe
-
4. Middle East & Africa
- 4.1. Turkey
- 4.2. Israel
- 4.3. GCC
- 4.4. North Africa
- 4.5. South Africa
- 4.6. Rest of Middle East & Africa
-
5. Asia Pacific
- 5.1. China
- 5.2. India
- 5.3. Japan
- 5.4. South Korea
- 5.5. ASEAN
- 5.6. Oceania
- 5.7. Rest of Asia Pacific
Engineering Cost Consulting Service Regional Market Share
Geographic Coverage of Engineering Cost Consulting Service
Engineering Cost Consulting Service REPORT HIGHLIGHTS
| Aspects | Details |
|---|---|
| Study Period | 2020-2034 |
| Base Year | 2025 |
| Estimated Year | 2026 |
| Forecast Period | 2026-2034 |
| Historical Period | 2020-2025 |
| Growth Rate | CAGR of 12.8% from 2020-2034 |
| Segmentation |
|
Table of Contents
- 1. Introduction
- 1.1. Research Scope
- 1.2. Market Segmentation
- 1.3. Research Methodology
- 1.4. Definitions and Assumptions
- 2. Executive Summary
- 2.1. Introduction
- 3. Market Dynamics
- 3.1. Introduction
- 3.2. Market Drivers
- 3.3. Market Restrains
- 3.4. Market Trends
- 4. Market Factor Analysis
- 4.1. Porters Five Forces
- 4.2. Supply/Value Chain
- 4.3. PESTEL analysis
- 4.4. Market Entropy
- 4.5. Patent/Trademark Analysis
- 5. Global Engineering Cost Consulting Service Analysis, Insights and Forecast, 2020-2032
- 5.1. Market Analysis, Insights and Forecast - by Application
- 5.1.1. Residential
- 5.1.2. Industrial
- 5.1.3. Commercial
- 5.1.4. Infrastructure Sectors
- 5.1.5. Others
- 5.2. Market Analysis, Insights and Forecast - by Types
- 5.2.1. Cost Estimating
- 5.2.2. Risk Management
- 5.2.3. Others
- 5.3. Market Analysis, Insights and Forecast - by Region
- 5.3.1. North America
- 5.3.2. South America
- 5.3.3. Europe
- 5.3.4. Middle East & Africa
- 5.3.5. Asia Pacific
- 5.1. Market Analysis, Insights and Forecast - by Application
- 6. North America Engineering Cost Consulting Service Analysis, Insights and Forecast, 2020-2032
- 6.1. Market Analysis, Insights and Forecast - by Application
- 6.1.1. Residential
- 6.1.2. Industrial
- 6.1.3. Commercial
- 6.1.4. Infrastructure Sectors
- 6.1.5. Others
- 6.2. Market Analysis, Insights and Forecast - by Types
- 6.2.1. Cost Estimating
- 6.2.2. Risk Management
- 6.2.3. Others
- 6.1. Market Analysis, Insights and Forecast - by Application
- 7. South America Engineering Cost Consulting Service Analysis, Insights and Forecast, 2020-2032
- 7.1. Market Analysis, Insights and Forecast - by Application
- 7.1.1. Residential
- 7.1.2. Industrial
- 7.1.3. Commercial
- 7.1.4. Infrastructure Sectors
- 7.1.5. Others
- 7.2. Market Analysis, Insights and Forecast - by Types
- 7.2.1. Cost Estimating
- 7.2.2. Risk Management
- 7.2.3. Others
- 7.1. Market Analysis, Insights and Forecast - by Application
- 8. Europe Engineering Cost Consulting Service Analysis, Insights and Forecast, 2020-2032
- 8.1. Market Analysis, Insights and Forecast - by Application
- 8.1.1. Residential
- 8.1.2. Industrial
- 8.1.3. Commercial
- 8.1.4. Infrastructure Sectors
- 8.1.5. Others
- 8.2. Market Analysis, Insights and Forecast - by Types
- 8.2.1. Cost Estimating
- 8.2.2. Risk Management
- 8.2.3. Others
- 8.1. Market Analysis, Insights and Forecast - by Application
- 9. Middle East & Africa Engineering Cost Consulting Service Analysis, Insights and Forecast, 2020-2032
- 9.1. Market Analysis, Insights and Forecast - by Application
- 9.1.1. Residential
- 9.1.2. Industrial
- 9.1.3. Commercial
- 9.1.4. Infrastructure Sectors
- 9.1.5. Others
- 9.2. Market Analysis, Insights and Forecast - by Types
- 9.2.1. Cost Estimating
- 9.2.2. Risk Management
- 9.2.3. Others
- 9.1. Market Analysis, Insights and Forecast - by Application
- 10. Asia Pacific Engineering Cost Consulting Service Analysis, Insights and Forecast, 2020-2032
- 10.1. Market Analysis, Insights and Forecast - by Application
- 10.1.1. Residential
- 10.1.2. Industrial
- 10.1.3. Commercial
- 10.1.4. Infrastructure Sectors
- 10.1.5. Others
- 10.2. Market Analysis, Insights and Forecast - by Types
- 10.2.1. Cost Estimating
- 10.2.2. Risk Management
- 10.2.3. Others
- 10.1. Market Analysis, Insights and Forecast - by Application
- 11. Competitive Analysis
- 11.1. Global Market Share Analysis 2025
- 11.2. Company Profiles
- 11.2.1 MIEngineers
- 11.2.1.1. Overview
- 11.2.1.2. Products
- 11.2.1.3. SWOT Analysis
- 11.2.1.4. Recent Developments
- 11.2.1.5. Financials (Based on Availability)
- 11.2.2 Cost Engineering Consultancy
- 11.2.2.1. Overview
- 11.2.2.2. Products
- 11.2.2.3. SWOT Analysis
- 11.2.2.4. Recent Developments
- 11.2.2.5. Financials (Based on Availability)
- 11.2.3 IMEG
- 11.2.3.1. Overview
- 11.2.3.2. Products
- 11.2.3.3. SWOT Analysis
- 11.2.3.4. Recent Developments
- 11.2.3.5. Financials (Based on Availability)
- 11.2.4 ESA Engineering
- 11.2.4.1. Overview
- 11.2.4.2. Products
- 11.2.4.3. SWOT Analysis
- 11.2.4.4. Recent Developments
- 11.2.4.5. Financials (Based on Availability)
- 11.2.5 Moonee Ponds
- 11.2.5.1. Overview
- 11.2.5.2. Products
- 11.2.5.3. SWOT Analysis
- 11.2.5.4. Recent Developments
- 11.2.5.5. Financials (Based on Availability)
- 11.2.6 Arcadis
- 11.2.6.1. Overview
- 11.2.6.2. Products
- 11.2.6.3. SWOT Analysis
- 11.2.6.4. Recent Developments
- 11.2.6.5. Financials (Based on Availability)
- 11.2.7 Engplan Consulting Engineers Ltd
- 11.2.7.1. Overview
- 11.2.7.2. Products
- 11.2.7.3. SWOT Analysis
- 11.2.7.4. Recent Developments
- 11.2.7.5. Financials (Based on Availability)
- 11.2.8 March Consulting Associates Inc.
- 11.2.8.1. Overview
- 11.2.8.2. Products
- 11.2.8.3. SWOT Analysis
- 11.2.8.4. Recent Developments
- 11.2.8.5. Financials (Based on Availability)
- 11.2.9 MASTPRO
- 11.2.9.1. Overview
- 11.2.9.2. Products
- 11.2.9.3. SWOT Analysis
- 11.2.9.4. Recent Developments
- 11.2.9.5. Financials (Based on Availability)
- 11.2.10 Vista Projects
- 11.2.10.1. Overview
- 11.2.10.2. Products
- 11.2.10.3. SWOT Analysis
- 11.2.10.4. Recent Developments
- 11.2.10.5. Financials (Based on Availability)
- 11.2.11 ALTINOK Consulting Engineering Limited Liability Company
- 11.2.11.1. Overview
- 11.2.11.2. Products
- 11.2.11.3. SWOT Analysis
- 11.2.11.4. Recent Developments
- 11.2.11.5. Financials (Based on Availability)
- 11.2.1 MIEngineers
List of Figures
- Figure 1: Global Engineering Cost Consulting Service Revenue Breakdown (undefined, %) by Region 2025 & 2033
- Figure 2: North America Engineering Cost Consulting Service Revenue (undefined), by Application 2025 & 2033
- Figure 3: North America Engineering Cost Consulting Service Revenue Share (%), by Application 2025 & 2033
- Figure 4: North America Engineering Cost Consulting Service Revenue (undefined), by Types 2025 & 2033
- Figure 5: North America Engineering Cost Consulting Service Revenue Share (%), by Types 2025 & 2033
- Figure 6: North America Engineering Cost Consulting Service Revenue (undefined), by Country 2025 & 2033
- Figure 7: North America Engineering Cost Consulting Service Revenue Share (%), by Country 2025 & 2033
- Figure 8: South America Engineering Cost Consulting Service Revenue (undefined), by Application 2025 & 2033
- Figure 9: South America Engineering Cost Consulting Service Revenue Share (%), by Application 2025 & 2033
- Figure 10: South America Engineering Cost Consulting Service Revenue (undefined), by Types 2025 & 2033
- Figure 11: South America Engineering Cost Consulting Service Revenue Share (%), by Types 2025 & 2033
- Figure 12: South America Engineering Cost Consulting Service Revenue (undefined), by Country 2025 & 2033
- Figure 13: South America Engineering Cost Consulting Service Revenue Share (%), by Country 2025 & 2033
- Figure 14: Europe Engineering Cost Consulting Service Revenue (undefined), by Application 2025 & 2033
- Figure 15: Europe Engineering Cost Consulting Service Revenue Share (%), by Application 2025 & 2033
- Figure 16: Europe Engineering Cost Consulting Service Revenue (undefined), by Types 2025 & 2033
- Figure 17: Europe Engineering Cost Consulting Service Revenue Share (%), by Types 2025 & 2033
- Figure 18: Europe Engineering Cost Consulting Service Revenue (undefined), by Country 2025 & 2033
- Figure 19: Europe Engineering Cost Consulting Service Revenue Share (%), by Country 2025 & 2033
- Figure 20: Middle East & Africa Engineering Cost Consulting Service Revenue (undefined), by Application 2025 & 2033
- Figure 21: Middle East & Africa Engineering Cost Consulting Service Revenue Share (%), by Application 2025 & 2033
- Figure 22: Middle East & Africa Engineering Cost Consulting Service Revenue (undefined), by Types 2025 & 2033
- Figure 23: Middle East & Africa Engineering Cost Consulting Service Revenue Share (%), by Types 2025 & 2033
- Figure 24: Middle East & Africa Engineering Cost Consulting Service Revenue (undefined), by Country 2025 & 2033
- Figure 25: Middle East & Africa Engineering Cost Consulting Service Revenue Share (%), by Country 2025 & 2033
- Figure 26: Asia Pacific Engineering Cost Consulting Service Revenue (undefined), by Application 2025 & 2033
- Figure 27: Asia Pacific Engineering Cost Consulting Service Revenue Share (%), by Application 2025 & 2033
- Figure 28: Asia Pacific Engineering Cost Consulting Service Revenue (undefined), by Types 2025 & 2033
- Figure 29: Asia Pacific Engineering Cost Consulting Service Revenue Share (%), by Types 2025 & 2033
- Figure 30: Asia Pacific Engineering Cost Consulting Service Revenue (undefined), by Country 2025 & 2033
- Figure 31: Asia Pacific Engineering Cost Consulting Service Revenue Share (%), by Country 2025 & 2033
List of Tables
- Table 1: Global Engineering Cost Consulting Service Revenue undefined Forecast, by Application 2020 & 2033
- Table 2: Global Engineering Cost Consulting Service Revenue undefined Forecast, by Types 2020 & 2033
- Table 3: Global Engineering Cost Consulting Service Revenue undefined Forecast, by Region 2020 & 2033
- Table 4: Global Engineering Cost Consulting Service Revenue undefined Forecast, by Application 2020 & 2033
- Table 5: Global Engineering Cost Consulting Service Revenue undefined Forecast, by Types 2020 & 2033
- Table 6: Global Engineering Cost Consulting Service Revenue undefined Forecast, by Country 2020 & 2033
- Table 7: United States Engineering Cost Consulting Service Revenue (undefined) Forecast, by Application 2020 & 2033
- Table 8: Canada Engineering Cost Consulting Service Revenue (undefined) Forecast, by Application 2020 & 2033
- Table 9: Mexico Engineering Cost Consulting Service Revenue (undefined) Forecast, by Application 2020 & 2033
- Table 10: Global Engineering Cost Consulting Service Revenue undefined Forecast, by Application 2020 & 2033
- Table 11: Global Engineering Cost Consulting Service Revenue undefined Forecast, by Types 2020 & 2033
- Table 12: Global Engineering Cost Consulting Service Revenue undefined Forecast, by Country 2020 & 2033
- Table 13: Brazil Engineering Cost Consulting Service Revenue (undefined) Forecast, by Application 2020 & 2033
- Table 14: Argentina Engineering Cost Consulting Service Revenue (undefined) Forecast, by Application 2020 & 2033
- Table 15: Rest of South America Engineering Cost Consulting Service Revenue (undefined) Forecast, by Application 2020 & 2033
- Table 16: Global Engineering Cost Consulting Service Revenue undefined Forecast, by Application 2020 & 2033
- Table 17: Global Engineering Cost Consulting Service Revenue undefined Forecast, by Types 2020 & 2033
- Table 18: Global Engineering Cost Consulting Service Revenue undefined Forecast, by Country 2020 & 2033
- Table 19: United Kingdom Engineering Cost Consulting Service Revenue (undefined) Forecast, by Application 2020 & 2033
- Table 20: Germany Engineering Cost Consulting Service Revenue (undefined) Forecast, by Application 2020 & 2033
- Table 21: France Engineering Cost Consulting Service Revenue (undefined) Forecast, by Application 2020 & 2033
- Table 22: Italy Engineering Cost Consulting Service Revenue (undefined) Forecast, by Application 2020 & 2033
- Table 23: Spain Engineering Cost Consulting Service Revenue (undefined) Forecast, by Application 2020 & 2033
- Table 24: Russia Engineering Cost Consulting Service Revenue (undefined) Forecast, by Application 2020 & 2033
- Table 25: Benelux Engineering Cost Consulting Service Revenue (undefined) Forecast, by Application 2020 & 2033
- Table 26: Nordics Engineering Cost Consulting Service Revenue (undefined) Forecast, by Application 2020 & 2033
- Table 27: Rest of Europe Engineering Cost Consulting Service Revenue (undefined) Forecast, by Application 2020 & 2033
- Table 28: Global Engineering Cost Consulting Service Revenue undefined Forecast, by Application 2020 & 2033
- Table 29: Global Engineering Cost Consulting Service Revenue undefined Forecast, by Types 2020 & 2033
- Table 30: Global Engineering Cost Consulting Service Revenue undefined Forecast, by Country 2020 & 2033
- Table 31: Turkey Engineering Cost Consulting Service Revenue (undefined) Forecast, by Application 2020 & 2033
- Table 32: Israel Engineering Cost Consulting Service Revenue (undefined) Forecast, by Application 2020 & 2033
- Table 33: GCC Engineering Cost Consulting Service Revenue (undefined) Forecast, by Application 2020 & 2033
- Table 34: North Africa Engineering Cost Consulting Service Revenue (undefined) Forecast, by Application 2020 & 2033
- Table 35: South Africa Engineering Cost Consulting Service Revenue (undefined) Forecast, by Application 2020 & 2033
- Table 36: Rest of Middle East & Africa Engineering Cost Consulting Service Revenue (undefined) Forecast, by Application 2020 & 2033
- Table 37: Global Engineering Cost Consulting Service Revenue undefined Forecast, by Application 2020 & 2033
- Table 38: Global Engineering Cost Consulting Service Revenue undefined Forecast, by Types 2020 & 2033
- Table 39: Global Engineering Cost Consulting Service Revenue undefined Forecast, by Country 2020 & 2033
- Table 40: China Engineering Cost Consulting Service Revenue (undefined) Forecast, by Application 2020 & 2033
- Table 41: India Engineering Cost Consulting Service Revenue (undefined) Forecast, by Application 2020 & 2033
- Table 42: Japan Engineering Cost Consulting Service Revenue (undefined) Forecast, by Application 2020 & 2033
- Table 43: South Korea Engineering Cost Consulting Service Revenue (undefined) Forecast, by Application 2020 & 2033
- Table 44: ASEAN Engineering Cost Consulting Service Revenue (undefined) Forecast, by Application 2020 & 2033
- Table 45: Oceania Engineering Cost Consulting Service Revenue (undefined) Forecast, by Application 2020 & 2033
- Table 46: Rest of Asia Pacific Engineering Cost Consulting Service Revenue (undefined) Forecast, by Application 2020 & 2033
Frequently Asked Questions
1. What is the projected Compound Annual Growth Rate (CAGR) of the Engineering Cost Consulting Service?
The projected CAGR is approximately 12.8%.
2. Which companies are prominent players in the Engineering Cost Consulting Service?
Key companies in the market include MIEngineers, Cost Engineering Consultancy, IMEG, ESA Engineering, Moonee Ponds, Arcadis, Engplan Consulting Engineers Ltd, March Consulting Associates Inc., MASTPRO, Vista Projects, ALTINOK Consulting Engineering Limited Liability Company.
3. What are the main segments of the Engineering Cost Consulting Service?
The market segments include Application, Types.
4. Can you provide details about the market size?
The market size is estimated to be USD XXX N/A as of 2022.
5. What are some drivers contributing to market growth?
N/A
6. What are the notable trends driving market growth?
N/A
7. Are there any restraints impacting market growth?
N/A
8. Can you provide examples of recent developments in the market?
N/A
9. What pricing options are available for accessing the report?
Pricing options include single-user, multi-user, and enterprise licenses priced at USD 3950.00, USD 5925.00, and USD 7900.00 respectively.
10. Is the market size provided in terms of value or volume?
The market size is provided in terms of value, measured in N/A.
11. Are there any specific market keywords associated with the report?
Yes, the market keyword associated with the report is "Engineering Cost Consulting Service," which aids in identifying and referencing the specific market segment covered.
12. How do I determine which pricing option suits my needs best?
The pricing options vary based on user requirements and access needs. Individual users may opt for single-user licenses, while businesses requiring broader access may choose multi-user or enterprise licenses for cost-effective access to the report.
13. Are there any additional resources or data provided in the Engineering Cost Consulting Service report?
While the report offers comprehensive insights, it's advisable to review the specific contents or supplementary materials provided to ascertain if additional resources or data are available.
14. How can I stay updated on further developments or reports in the Engineering Cost Consulting Service?
To stay informed about further developments, trends, and reports in the Engineering Cost Consulting Service, consider subscribing to industry newsletters, following relevant companies and organizations, or regularly checking reputable industry news sources and publications.
Methodology
Step 1 - Identification of Relevant Samples Size from Population Database


Step 2 - Approaches for Defining Global Market Size (Value, Volume* & Price*)

Note*: In applicable scenarios
Step 3 - Data Sources
Primary Research
- Web Analytics
- Survey Reports
- Research Institute
- Latest Research Reports
- Opinion Leaders
Secondary Research
- Annual Reports
- White Paper
- Latest Press Release
- Industry Association
- Paid Database
- Investor Presentations

Step 4 - Data Triangulation
Involves using different sources of information in order to increase the validity of a study
These sources are likely to be stakeholders in a program - participants, other researchers, program staff, other community members, and so on.
Then we put all data in single framework & apply various statistical tools to find out the dynamic on the market.
During the analysis stage, feedback from the stakeholder groups would be compared to determine areas of agreement as well as areas of divergence