

Key Insights
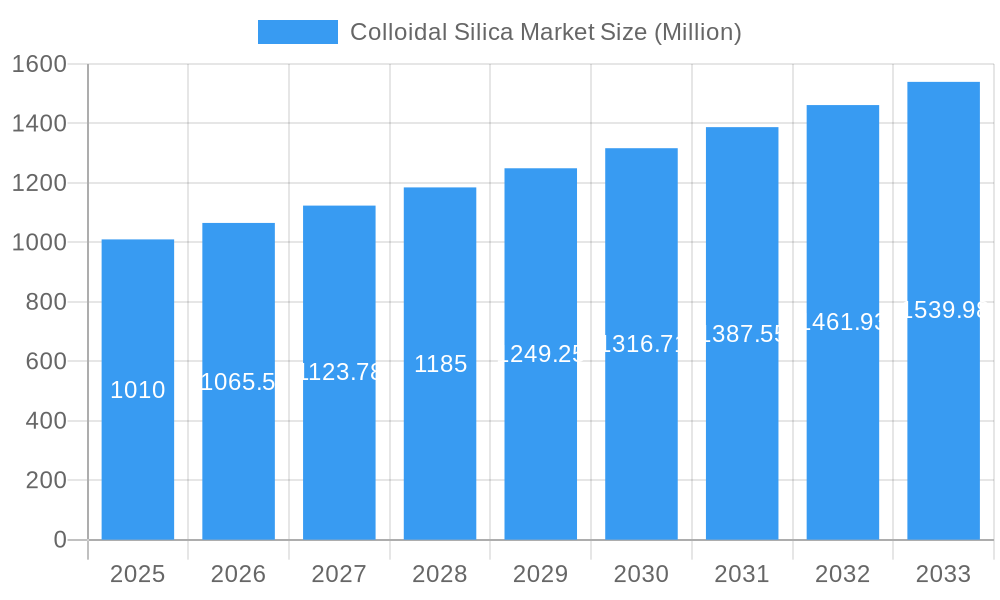
The colloidal silica market, valued at approximately $1.01 billion in 2025, is projected to experience robust growth with a Compound Annual Growth Rate (CAGR) exceeding 5% from 2025 to 2033. This expansion is driven by increasing demand across diverse end-user industries. The pulp and paper industry relies heavily on colloidal silica for improved paper strength and coating properties. Similarly, the paints and coatings sector utilizes it as a rheological additive and matting agent, enhancing product performance and aesthetics. The chemicals industry leverages colloidal silica in various applications, including catalysts and binders. Growth is further fueled by the construction sector's use of colloidal silica in concrete admixtures for improved durability and workability, and its application in the electronics and semiconductors industry for polishing and coatings. While precise figures for segment-specific market shares are unavailable, it is reasonable to anticipate that Pulp & Paper, Paints & Coatings, and Chemicals will represent significant portions of the overall market given their established usage of colloidal silica. Furthermore, increasing investments in research and development are expected to lead to innovative applications, driving future market expansion. Competitive dynamics are characterized by a mix of established players like Ecolab, Cabot Corporation, and Evonik, alongside regional players. This competitive landscape fosters innovation and ensures a steady supply to meet growing demands.
Colloidal Silica Market Market Size (In Billion)
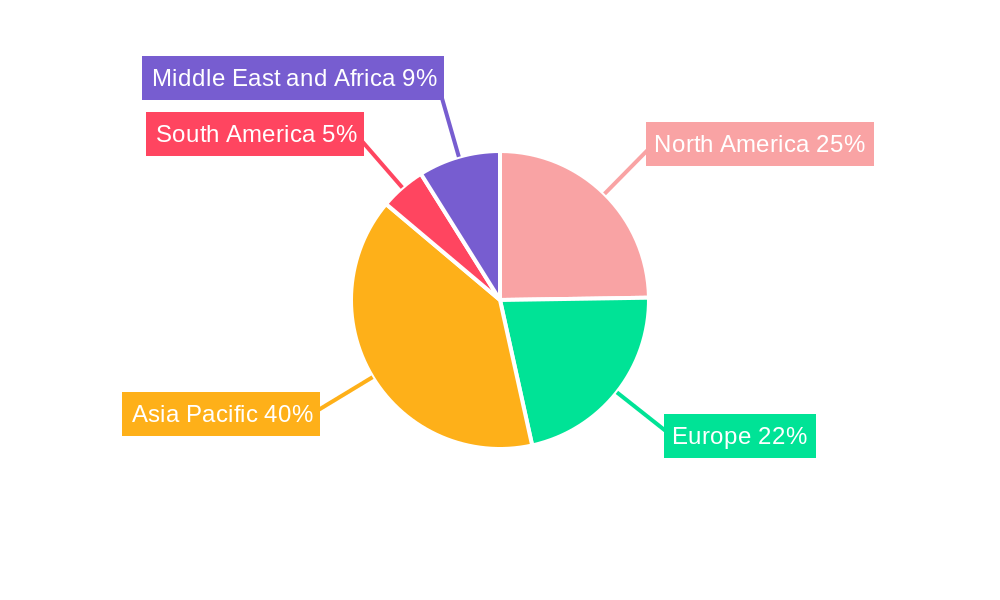
The regional distribution of the market is likely to reflect global industrial activity. Asia Pacific, particularly China and India, is expected to hold a substantial market share due to the region's robust industrial growth and manufacturing capacity. North America and Europe are anticipated to maintain significant shares, driven by established industries and technological advancements. Emerging markets in South America, the Middle East, and Africa are projected to exhibit moderate growth, driven primarily by infrastructure development and industrialization. However, potential restraints could include price fluctuations in raw materials and stringent environmental regulations in certain regions. Nevertheless, the overall positive outlook for the colloidal silica market is driven by the continuous expansion of its key end-use sectors and the development of innovative applications.
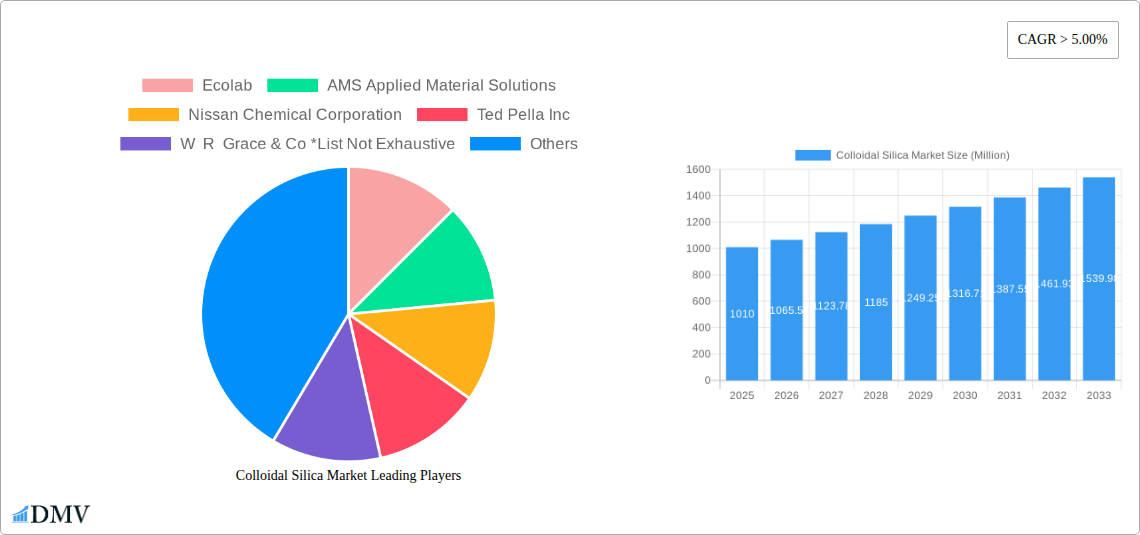
Colloidal Silica Market Company Market Share
Colloidal Silica Market: A Comprehensive Report (2019-2033)
This insightful report provides a detailed analysis of the Colloidal Silica market, offering invaluable perspectives for stakeholders seeking to understand market dynamics, future trends, and strategic opportunities. Covering the period from 2019 to 2033, with a base year of 2025, this comprehensive study delves into market segmentation, key players, and future growth projections. The report projects a xx Million market value by 2033, presenting a robust framework for informed decision-making.
Colloidal Silica Market Composition & Trends
This section offers a deep dive into the Colloidal Silica market landscape, analyzing market concentration, innovation drivers, regulatory factors, substitute product analysis, end-user profiles, and mergers & acquisitions (M&A) activity. The report examines the market share distribution among key players, revealing a moderately concentrated market with several prominent companies holding significant shares. M&A activity is analyzed, including deal values and their impact on market consolidation. Innovation catalysts, such as advancements in synthesis techniques and applications, are explored, along with a comprehensive overview of regulatory landscapes influencing market growth. The impact of substitute products and changing end-user preferences are thoroughly evaluated. Specific data points on market share and M&A deal values are included, offering quantifiable insights into the market's competitive structure and dynamic evolution.
- Market Concentration: Moderately concentrated, with top 5 players holding approximately xx% of market share in 2024.
- Innovation Catalysts: Advancements in nanotechnology, sustainable production methods, and specialized applications are driving innovation.
- Regulatory Landscape: Regulations related to environmental impact and material safety are shaping market dynamics.
- Substitute Products: Competition from alternative materials is analyzed based on performance, cost, and environmental impact.
- End-User Profiles: Detailed analysis of end-user industries, including their consumption patterns and future demand forecasts.
- M&A Activity: Assessment of recent mergers and acquisitions, evaluating their impact on market structure and competition, with details on deal values (xx Million in total for the period 2019-2024).
Colloidal Silica Market Industry Evolution
This section examines the evolution of the Colloidal Silica market, detailing market growth trajectories, technological advancements, and shifting consumer demands. The analysis includes specific data points on growth rates and adoption metrics throughout the historical period (2019-2024) and projected forecast period (2025-2033). The report explores the impact of technological advancements on product development, manufacturing processes, and market expansion. Furthermore, the changing demands of end-users and the influence of emerging trends are thoroughly examined, providing crucial insights into the market's future trajectory. Growth is projected at a CAGR of xx% during the forecast period.
Leading Regions, Countries, or Segments in Colloidal Silica Market
This section pinpoints the dominant regions, countries, and segments within the Colloidal Silica market, providing an in-depth analysis of the factors driving their prominence. The analysis focuses on key end-user industries including Pulp and Paper, Paints and Coatings, Chemicals, Construction, Metals and Metallurgy, Electronics and Semiconductors, and Other End-user Industries. We highlight key regional dynamics and their contributions to market growth, alongside an examination of dominant segments. Factors such as investment trends, regulatory support, and evolving consumer preferences are meticulously analyzed to understand the driving forces behind regional and segmental leadership. The dominant segment is identified, and a comprehensive explanation of the factors contributing to its sustained leadership is provided.
- Paints and Coatings: This segment is projected to maintain its dominance due to the high demand for colloidal silica in enhancing the rheology, gloss, scratch resistance, and overall durability of paints and coatings. Its role in water-based formulations, driven by environmental regulations, further solidifies its leading position.
- Construction: The construction industry continues to be a significant driver, with colloidal silica widely employed as a high-performance binder and additive in cementitious materials, concrete admixtures, and specialty mortars. Its ability to improve strength, reduce permeability, and enhance durability is crucial for modern infrastructure development.
- Pulp and Paper: This industry leverages colloidal silica for its exceptional properties in paper coating, ink receptivity, and strengthening, leading to improved print quality and paper performance.
- Electronics and Semiconductors: A rapidly growing segment, colloidal silica is indispensable in precision polishing applications for semiconductor wafers and other electronic components, demanding high purity and controlled particle sizes.
- Key Drivers: Government investments in infrastructure projects globally, rising construction activity in emerging economies, and continuous advancements in material science, particularly in areas like nanotechnology and sustainable materials, are key drivers fueling growth in specific segments and regions.
Colloidal Silica Market Product Innovations
This section details recent product innovations, applications, and performance metrics within the colloidal silica market. It highlights unique selling propositions and technological advancements that are reshaping the market landscape. New applications, such as in advanced materials and biomedicine, are also discussed. Focus is placed on improved particle size control, enhanced dispersibility, and tailored surface modifications enabling superior performance in various applications.
Propelling Factors for Colloidal Silica Market Growth
This section identifies and elaborates on the key growth drivers propelling the global Colloidal Silica market forward. These drivers encompass a multifaceted array of influences including significant technological advancements, such as the development of improved and more efficient synthesis methods leading to higher purity, tailored particle sizes, and enhanced performance characteristics of colloidal silica products. Favorable economic conditions, marked by robust industrial output and increasing disposable incomes in key regions, are stimulating demand across critical end-user segments like paints and coatings, construction, and electronics. Furthermore, supportive government regulations, particularly those promoting environmental sustainability, the use of eco-friendly materials, and investments in infrastructure, are creating a conducive environment for market expansion. We analyze these factors with specific examples, illustrating their tangible impact on market dynamics and future growth trajectories.
Obstacles in the Colloidal Silica Market
This section meticulously identifies and quantifies the challenges and restraints impacting the growth and expansion of the Colloidal Silica market. These obstacles include stringent regulatory hurdles related to environmental compliance and the handling of chemicals, which can increase operational costs and slow down market penetration. Potential supply chain disruptions, stemming from geopolitical instability, fluctuations in raw material availability and pricing, and logistical complexities, pose a significant threat to consistent production and delivery. Moreover, intense competitive pressures from substitute materials offering similar functionalities, alongside the presence of established market players and emerging new entrants, create a dynamic and challenging competitive landscape. The quantifiable impact of these obstacles on market growth is estimated through market analysis and expert insights, providing a balanced perspective on the industry's challenges.
Future Opportunities in Colloidal Silica Market
This section outlines emerging opportunities in the Colloidal Silica market. This includes the exploration of new and expanding markets (e.g., specific niche applications), advancements in technology leading to improved product performance and functionality, and the influence of changing consumer preferences.
Major Players in the Colloidal Silica Market Ecosystem
- Ecolab
- AMS Applied Material Solutions
- Nissan Chemical Corporation
- Ted Pella Inc
- W R Grace & Co
- Cabot Corporation
- Nyacol
- FUSO CHEMICAL CO LTD
- Nouryon
- CWK Chemiewerk Bad Kstritz GmbH
- Linyi Kehan Silicon Products Co LTD
- Sterling Chemicals
- Jinan Yinfeng Silicon Products Co Ltd
- Akasel
- Evonik
Key Developments in Colloidal Silica Market Industry
- June 2020: W. R. Grace & Co. opened a new colloidal silica plant in Germany, expanding its EMEA reach.
- November 2021: Nouryon announced increased production capacity for its Green Bay, Wisconsin facility, targeting packaging and construction markets.
Strategic Colloidal Silica Market Forecast
This section summarizes the key growth catalysts that will shape the future of the Colloidal Silica market, emphasizing the significant opportunities for expansion and the substantial market potential. The section reiterates the key drivers and emerging trends identified earlier, offering a concise yet powerful outlook on the market’s trajectory over the forecast period. The continued expansion into new applications, driven by technological advancements and supportive regulatory environments, underscores a positive and promising future for the Colloidal Silica market.
Colloidal Silica Market Segmentation
-
1. End-user Industry
- 1.1. Pulp and Paper
- 1.2. Paints and Coatings
- 1.3. Chemicals
- 1.4. Construction
- 1.5. Metals and Metallurgy
- 1.6. Electronics and Semiconductors
- 1.7. Other End-user Industries
Colloidal Silica Market Segmentation By Geography
-
1. Asia Pacific
- 1.1. China
- 1.2. India
- 1.3. Japan
- 1.4. South Korea
- 1.5. Rest of Asia Pacific
-
2. North America
- 2.1. United States
- 2.2. Canada
- 2.3. Mexico
-
3. Europe
- 3.1. Germany
- 3.2. United Kingdom
- 3.3. Italy
- 3.4. France
- 3.5. Rest of Europe
-
4. South America
- 4.1. Brazil
- 4.2. Argentina
- 4.3. Rest of South America
-
5. Middle East and Africa
- 5.1. Saudi Arabia
- 5.2. South Africa
- 5.3. Rest of Middle East and Africa
Colloidal Silica Market Regional Market Share
Geographic Coverage of Colloidal Silica Market
Colloidal Silica Market REPORT HIGHLIGHTS
| Aspects | Details |
|---|---|
| Study Period | 2020-2034 |
| Base Year | 2025 |
| Estimated Year | 2026 |
| Forecast Period | 2026-2034 |
| Historical Period | 2020-2025 |
| Growth Rate | CAGR of > 5.00% from 2020-2034 |
| Segmentation |
|
Table of Contents
- 1. Introduction
- 1.1. Research Scope
- 1.2. Market Segmentation
- 1.3. Research Objective
- 1.4. Definitions and Assumptions
- 2. Executive Summary
- 2.1. Market Snapshot
- 3. Market Dynamics
- 3.1. Market Drivers
- 3.2. Market Restrains
- 3.3. Market Trends
- 3.4. Market Opportunities
- 4. Market Factor Analysis
- 4.1. Porters Five Forces
- 4.1.1. Bargaining Power of Suppliers
- 4.1.2. Bargaining Power of Buyers
- 4.1.3. Threat of New Entrants
- 4.1.4. Threat of Substitutes
- 4.1.5. Competitive Rivalry
- 4.2. PESTEL analysis
- 4.3. BCG Analysis
- 4.3.1. Stars (High Growth, High Market Share)
- 4.3.2. Cash Cows (Low Growth, High Market Share)
- 4.3.3. Question Mark (High Growth, Low Market Share)
- 4.3.4. Dogs (Low Growth, Low Market Share)
- 4.4. Ansoff Matrix Analysis
- 4.5. Supply Chain Analysis
- 4.6. Regulatory Landscape
- 4.7. Current Market Potential and Opportunity Assessment (TAM–SAM–SOM Framework)
- 4.8. DMV Analyst Note
- 4.1. Porters Five Forces
- 5. Market Analysis, Insights and Forecast 2021-2033
- 5.1. Market Analysis, Insights and Forecast - by End-user Industry
- 5.1.1. Pulp and Paper
- 5.1.2. Paints and Coatings
- 5.1.3. Chemicals
- 5.1.4. Construction
- 5.1.5. Metals and Metallurgy
- 5.1.6. Electronics and Semiconductors
- 5.1.7. Other End-user Industries
- 5.2. Market Analysis, Insights and Forecast - by Region
- 5.2.1. Asia Pacific
- 5.2.2. North America
- 5.2.3. Europe
- 5.2.4. South America
- 5.2.5. Middle East and Africa
- 5.1. Market Analysis, Insights and Forecast - by End-user Industry
- 6. Global Colloidal Silica Market Analysis, Insights and Forecast, 2021-2033
- 6.1. Market Analysis, Insights and Forecast - by End-user Industry
- 6.1.1. Pulp and Paper
- 6.1.2. Paints and Coatings
- 6.1.3. Chemicals
- 6.1.4. Construction
- 6.1.5. Metals and Metallurgy
- 6.1.6. Electronics and Semiconductors
- 6.1.7. Other End-user Industries
- 6.1. Market Analysis, Insights and Forecast - by End-user Industry
- 7. Asia Pacific Colloidal Silica Market Analysis, Insights and Forecast, 2020-2032
- 7.1. Market Analysis, Insights and Forecast - by End-user Industry
- 7.1.1. Pulp and Paper
- 7.1.2. Paints and Coatings
- 7.1.3. Chemicals
- 7.1.4. Construction
- 7.1.5. Metals and Metallurgy
- 7.1.6. Electronics and Semiconductors
- 7.1.7. Other End-user Industries
- 7.1. Market Analysis, Insights and Forecast - by End-user Industry
- 8. North America Colloidal Silica Market Analysis, Insights and Forecast, 2020-2032
- 8.1. Market Analysis, Insights and Forecast - by End-user Industry
- 8.1.1. Pulp and Paper
- 8.1.2. Paints and Coatings
- 8.1.3. Chemicals
- 8.1.4. Construction
- 8.1.5. Metals and Metallurgy
- 8.1.6. Electronics and Semiconductors
- 8.1.7. Other End-user Industries
- 8.1. Market Analysis, Insights and Forecast - by End-user Industry
- 9. Europe Colloidal Silica Market Analysis, Insights and Forecast, 2020-2032
- 9.1. Market Analysis, Insights and Forecast - by End-user Industry
- 9.1.1. Pulp and Paper
- 9.1.2. Paints and Coatings
- 9.1.3. Chemicals
- 9.1.4. Construction
- 9.1.5. Metals and Metallurgy
- 9.1.6. Electronics and Semiconductors
- 9.1.7. Other End-user Industries
- 9.1. Market Analysis, Insights and Forecast - by End-user Industry
- 10. South America Colloidal Silica Market Analysis, Insights and Forecast, 2020-2032
- 10.1. Market Analysis, Insights and Forecast - by End-user Industry
- 10.1.1. Pulp and Paper
- 10.1.2. Paints and Coatings
- 10.1.3. Chemicals
- 10.1.4. Construction
- 10.1.5. Metals and Metallurgy
- 10.1.6. Electronics and Semiconductors
- 10.1.7. Other End-user Industries
- 10.1. Market Analysis, Insights and Forecast - by End-user Industry
- 11. Middle East and Africa Colloidal Silica Market Analysis, Insights and Forecast, 2020-2032
- 11.1. Market Analysis, Insights and Forecast - by End-user Industry
- 11.1.1. Pulp and Paper
- 11.1.2. Paints and Coatings
- 11.1.3. Chemicals
- 11.1.4. Construction
- 11.1.5. Metals and Metallurgy
- 11.1.6. Electronics and Semiconductors
- 11.1.7. Other End-user Industries
- 11.1. Market Analysis, Insights and Forecast - by End-user Industry
- 12. Competitive Analysis
- 12.1. Company Profiles
- 12.1.1 Ecolab
- 12.1.1.1. Company Overview
- 12.1.1.2. Products
- 12.1.1.3. Company Financials
- 12.1.1.4. SWOT Analysis
- 12.1.2 AMS Applied Material Solutions
- 12.1.2.1. Company Overview
- 12.1.2.2. Products
- 12.1.2.3. Company Financials
- 12.1.2.4. SWOT Analysis
- 12.1.3 Nissan Chemical Corporation
- 12.1.3.1. Company Overview
- 12.1.3.2. Products
- 12.1.3.3. Company Financials
- 12.1.3.4. SWOT Analysis
- 12.1.4 Ted Pella Inc
- 12.1.4.1. Company Overview
- 12.1.4.2. Products
- 12.1.4.3. Company Financials
- 12.1.4.4. SWOT Analysis
- 12.1.5 W R Grace & Co *List Not Exhaustive
- 12.1.5.1. Company Overview
- 12.1.5.2. Products
- 12.1.5.3. Company Financials
- 12.1.5.4. SWOT Analysis
- 12.1.6 Cabot Corporation
- 12.1.6.1. Company Overview
- 12.1.6.2. Products
- 12.1.6.3. Company Financials
- 12.1.6.4. SWOT Analysis
- 12.1.7 Nyacol
- 12.1.7.1. Company Overview
- 12.1.7.2. Products
- 12.1.7.3. Company Financials
- 12.1.7.4. SWOT Analysis
- 12.1.8 FUSO CHEMICAL CO LTD
- 12.1.8.1. Company Overview
- 12.1.8.2. Products
- 12.1.8.3. Company Financials
- 12.1.8.4. SWOT Analysis
- 12.1.9 Nouryan
- 12.1.9.1. Company Overview
- 12.1.9.2. Products
- 12.1.9.3. Company Financials
- 12.1.9.4. SWOT Analysis
- 12.1.10 CWK Chemiewerk Bad Kstritz GmbH
- 12.1.10.1. Company Overview
- 12.1.10.2. Products
- 12.1.10.3. Company Financials
- 12.1.10.4. SWOT Analysis
- 12.1.11 Linyi Kehan Silicon Products Co LTD
- 12.1.11.1. Company Overview
- 12.1.11.2. Products
- 12.1.11.3. Company Financials
- 12.1.11.4. SWOT Analysis
- 12.1.12 Sterling Chemicals
- 12.1.12.1. Company Overview
- 12.1.12.2. Products
- 12.1.12.3. Company Financials
- 12.1.12.4. SWOT Analysis
- 12.1.13 Jinan Yinfeng Silicon Products Co Ltd
- 12.1.13.1. Company Overview
- 12.1.13.2. Products
- 12.1.13.3. Company Financials
- 12.1.13.4. SWOT Analysis
- 12.1.14 Akasel
- 12.1.14.1. Company Overview
- 12.1.14.2. Products
- 12.1.14.3. Company Financials
- 12.1.14.4. SWOT Analysis
- 12.1.15 Evonik
- 12.1.15.1. Company Overview
- 12.1.15.2. Products
- 12.1.15.3. Company Financials
- 12.1.15.4. SWOT Analysis
- 12.1.1 Ecolab
- 12.2. Market Entropy
- 12.2.1 Company's Key Areas Served
- 12.2.2 Recent Developments
- 12.3. Company Market Share Analysis 2025
- 12.3.1 Top 5 Companies Market Share Analysis
- 12.3.2 Top 3 Companies Market Share Analysis
- 12.4. List of Potential Customers
- 13. Research Methodology
List of Figures
- Figure 1: Global Colloidal Silica Market Revenue Breakdown (Million, %) by Region 2025 & 2033
- Figure 2: Global Colloidal Silica Market Volume Breakdown (K Tons, %) by Region 2025 & 2033
- Figure 3: Asia Pacific Colloidal Silica Market Revenue (Million), by End-user Industry 2025 & 2033
- Figure 4: Asia Pacific Colloidal Silica Market Volume (K Tons), by End-user Industry 2025 & 2033
- Figure 5: Asia Pacific Colloidal Silica Market Revenue Share (%), by End-user Industry 2025 & 2033
- Figure 6: Asia Pacific Colloidal Silica Market Volume Share (%), by End-user Industry 2025 & 2033
- Figure 7: Asia Pacific Colloidal Silica Market Revenue (Million), by Country 2025 & 2033
- Figure 8: Asia Pacific Colloidal Silica Market Volume (K Tons), by Country 2025 & 2033
- Figure 9: Asia Pacific Colloidal Silica Market Revenue Share (%), by Country 2025 & 2033
- Figure 10: Asia Pacific Colloidal Silica Market Volume Share (%), by Country 2025 & 2033
- Figure 11: North America Colloidal Silica Market Revenue (Million), by End-user Industry 2025 & 2033
- Figure 12: North America Colloidal Silica Market Volume (K Tons), by End-user Industry 2025 & 2033
- Figure 13: North America Colloidal Silica Market Revenue Share (%), by End-user Industry 2025 & 2033
- Figure 14: North America Colloidal Silica Market Volume Share (%), by End-user Industry 2025 & 2033
- Figure 15: North America Colloidal Silica Market Revenue (Million), by Country 2025 & 2033
- Figure 16: North America Colloidal Silica Market Volume (K Tons), by Country 2025 & 2033
- Figure 17: North America Colloidal Silica Market Revenue Share (%), by Country 2025 & 2033
- Figure 18: North America Colloidal Silica Market Volume Share (%), by Country 2025 & 2033
- Figure 19: Europe Colloidal Silica Market Revenue (Million), by End-user Industry 2025 & 2033
- Figure 20: Europe Colloidal Silica Market Volume (K Tons), by End-user Industry 2025 & 2033
- Figure 21: Europe Colloidal Silica Market Revenue Share (%), by End-user Industry 2025 & 2033
- Figure 22: Europe Colloidal Silica Market Volume Share (%), by End-user Industry 2025 & 2033
- Figure 23: Europe Colloidal Silica Market Revenue (Million), by Country 2025 & 2033
- Figure 24: Europe Colloidal Silica Market Volume (K Tons), by Country 2025 & 2033
- Figure 25: Europe Colloidal Silica Market Revenue Share (%), by Country 2025 & 2033
- Figure 26: Europe Colloidal Silica Market Volume Share (%), by Country 2025 & 2033
- Figure 27: South America Colloidal Silica Market Revenue (Million), by End-user Industry 2025 & 2033
- Figure 28: South America Colloidal Silica Market Volume (K Tons), by End-user Industry 2025 & 2033
- Figure 29: South America Colloidal Silica Market Revenue Share (%), by End-user Industry 2025 & 2033
- Figure 30: South America Colloidal Silica Market Volume Share (%), by End-user Industry 2025 & 2033
- Figure 31: South America Colloidal Silica Market Revenue (Million), by Country 2025 & 2033
- Figure 32: South America Colloidal Silica Market Volume (K Tons), by Country 2025 & 2033
- Figure 33: South America Colloidal Silica Market Revenue Share (%), by Country 2025 & 2033
- Figure 34: South America Colloidal Silica Market Volume Share (%), by Country 2025 & 2033
- Figure 35: Middle East and Africa Colloidal Silica Market Revenue (Million), by End-user Industry 2025 & 2033
- Figure 36: Middle East and Africa Colloidal Silica Market Volume (K Tons), by End-user Industry 2025 & 2033
- Figure 37: Middle East and Africa Colloidal Silica Market Revenue Share (%), by End-user Industry 2025 & 2033
- Figure 38: Middle East and Africa Colloidal Silica Market Volume Share (%), by End-user Industry 2025 & 2033
- Figure 39: Middle East and Africa Colloidal Silica Market Revenue (Million), by Country 2025 & 2033
- Figure 40: Middle East and Africa Colloidal Silica Market Volume (K Tons), by Country 2025 & 2033
- Figure 41: Middle East and Africa Colloidal Silica Market Revenue Share (%), by Country 2025 & 2033
- Figure 42: Middle East and Africa Colloidal Silica Market Volume Share (%), by Country 2025 & 2033
List of Tables
- Table 1: Global Colloidal Silica Market Revenue Million Forecast, by End-user Industry 2020 & 2033
- Table 2: Global Colloidal Silica Market Volume K Tons Forecast, by End-user Industry 2020 & 2033
- Table 3: Global Colloidal Silica Market Revenue Million Forecast, by Region 2020 & 2033
- Table 4: Global Colloidal Silica Market Volume K Tons Forecast, by Region 2020 & 2033
- Table 5: Global Colloidal Silica Market Revenue Million Forecast, by End-user Industry 2020 & 2033
- Table 6: Global Colloidal Silica Market Volume K Tons Forecast, by End-user Industry 2020 & 2033
- Table 7: Global Colloidal Silica Market Revenue Million Forecast, by Country 2020 & 2033
- Table 8: Global Colloidal Silica Market Volume K Tons Forecast, by Country 2020 & 2033
- Table 9: China Colloidal Silica Market Revenue (Million) Forecast, by Application 2020 & 2033
- Table 10: China Colloidal Silica Market Volume (K Tons) Forecast, by Application 2020 & 2033
- Table 11: India Colloidal Silica Market Revenue (Million) Forecast, by Application 2020 & 2033
- Table 12: India Colloidal Silica Market Volume (K Tons) Forecast, by Application 2020 & 2033
- Table 13: Japan Colloidal Silica Market Revenue (Million) Forecast, by Application 2020 & 2033
- Table 14: Japan Colloidal Silica Market Volume (K Tons) Forecast, by Application 2020 & 2033
- Table 15: South Korea Colloidal Silica Market Revenue (Million) Forecast, by Application 2020 & 2033
- Table 16: South Korea Colloidal Silica Market Volume (K Tons) Forecast, by Application 2020 & 2033
- Table 17: Rest of Asia Pacific Colloidal Silica Market Revenue (Million) Forecast, by Application 2020 & 2033
- Table 18: Rest of Asia Pacific Colloidal Silica Market Volume (K Tons) Forecast, by Application 2020 & 2033
- Table 19: Global Colloidal Silica Market Revenue Million Forecast, by End-user Industry 2020 & 2033
- Table 20: Global Colloidal Silica Market Volume K Tons Forecast, by End-user Industry 2020 & 2033
- Table 21: Global Colloidal Silica Market Revenue Million Forecast, by Country 2020 & 2033
- Table 22: Global Colloidal Silica Market Volume K Tons Forecast, by Country 2020 & 2033
- Table 23: United States Colloidal Silica Market Revenue (Million) Forecast, by Application 2020 & 2033
- Table 24: United States Colloidal Silica Market Volume (K Tons) Forecast, by Application 2020 & 2033
- Table 25: Canada Colloidal Silica Market Revenue (Million) Forecast, by Application 2020 & 2033
- Table 26: Canada Colloidal Silica Market Volume (K Tons) Forecast, by Application 2020 & 2033
- Table 27: Mexico Colloidal Silica Market Revenue (Million) Forecast, by Application 2020 & 2033
- Table 28: Mexico Colloidal Silica Market Volume (K Tons) Forecast, by Application 2020 & 2033
- Table 29: Global Colloidal Silica Market Revenue Million Forecast, by End-user Industry 2020 & 2033
- Table 30: Global Colloidal Silica Market Volume K Tons Forecast, by End-user Industry 2020 & 2033
- Table 31: Global Colloidal Silica Market Revenue Million Forecast, by Country 2020 & 2033
- Table 32: Global Colloidal Silica Market Volume K Tons Forecast, by Country 2020 & 2033
- Table 33: Germany Colloidal Silica Market Revenue (Million) Forecast, by Application 2020 & 2033
- Table 34: Germany Colloidal Silica Market Volume (K Tons) Forecast, by Application 2020 & 2033
- Table 35: United Kingdom Colloidal Silica Market Revenue (Million) Forecast, by Application 2020 & 2033
- Table 36: United Kingdom Colloidal Silica Market Volume (K Tons) Forecast, by Application 2020 & 2033
- Table 37: Italy Colloidal Silica Market Revenue (Million) Forecast, by Application 2020 & 2033
- Table 38: Italy Colloidal Silica Market Volume (K Tons) Forecast, by Application 2020 & 2033
- Table 39: France Colloidal Silica Market Revenue (Million) Forecast, by Application 2020 & 2033
- Table 40: France Colloidal Silica Market Volume (K Tons) Forecast, by Application 2020 & 2033
- Table 41: Rest of Europe Colloidal Silica Market Revenue (Million) Forecast, by Application 2020 & 2033
- Table 42: Rest of Europe Colloidal Silica Market Volume (K Tons) Forecast, by Application 2020 & 2033
- Table 43: Global Colloidal Silica Market Revenue Million Forecast, by End-user Industry 2020 & 2033
- Table 44: Global Colloidal Silica Market Volume K Tons Forecast, by End-user Industry 2020 & 2033
- Table 45: Global Colloidal Silica Market Revenue Million Forecast, by Country 2020 & 2033
- Table 46: Global Colloidal Silica Market Volume K Tons Forecast, by Country 2020 & 2033
- Table 47: Brazil Colloidal Silica Market Revenue (Million) Forecast, by Application 2020 & 2033
- Table 48: Brazil Colloidal Silica Market Volume (K Tons) Forecast, by Application 2020 & 2033
- Table 49: Argentina Colloidal Silica Market Revenue (Million) Forecast, by Application 2020 & 2033
- Table 50: Argentina Colloidal Silica Market Volume (K Tons) Forecast, by Application 2020 & 2033
- Table 51: Rest of South America Colloidal Silica Market Revenue (Million) Forecast, by Application 2020 & 2033
- Table 52: Rest of South America Colloidal Silica Market Volume (K Tons) Forecast, by Application 2020 & 2033
- Table 53: Global Colloidal Silica Market Revenue Million Forecast, by End-user Industry 2020 & 2033
- Table 54: Global Colloidal Silica Market Volume K Tons Forecast, by End-user Industry 2020 & 2033
- Table 55: Global Colloidal Silica Market Revenue Million Forecast, by Country 2020 & 2033
- Table 56: Global Colloidal Silica Market Volume K Tons Forecast, by Country 2020 & 2033
- Table 57: Saudi Arabia Colloidal Silica Market Revenue (Million) Forecast, by Application 2020 & 2033
- Table 58: Saudi Arabia Colloidal Silica Market Volume (K Tons) Forecast, by Application 2020 & 2033
- Table 59: South Africa Colloidal Silica Market Revenue (Million) Forecast, by Application 2020 & 2033
- Table 60: South Africa Colloidal Silica Market Volume (K Tons) Forecast, by Application 2020 & 2033
- Table 61: Rest of Middle East and Africa Colloidal Silica Market Revenue (Million) Forecast, by Application 2020 & 2033
- Table 62: Rest of Middle East and Africa Colloidal Silica Market Volume (K Tons) Forecast, by Application 2020 & 2033
Frequently Asked Questions
1. What is the projected Compound Annual Growth Rate (CAGR) of the Colloidal Silica Market?
The projected CAGR is approximately > 5.00%.
2. Which companies are prominent players in the Colloidal Silica Market?
Key companies in the market include Ecolab, AMS Applied Material Solutions, Nissan Chemical Corporation, Ted Pella Inc, W R Grace & Co *List Not Exhaustive, Cabot Corporation, Nyacol, FUSO CHEMICAL CO LTD, Nouryan, CWK Chemiewerk Bad Kstritz GmbH, Linyi Kehan Silicon Products Co LTD, Sterling Chemicals, Jinan Yinfeng Silicon Products Co Ltd, Akasel, Evonik.
3. What are the main segments of the Colloidal Silica Market?
The market segments include End-user Industry.
4. Can you provide details about the market size?
The market size is estimated to be USD 1010 Million as of 2022.
5. What are some drivers contributing to market growth?
Rising Demand for Concrete and Cements in the Construction Industry Globally; Increasing Demand for Silicon wafers for Production of Integrated Circuits in Electronic Devices.
6. What are the notable trends driving market growth?
Increasing Usage in the Construction Industry.
7. Are there any restraints impacting market growth?
Slow Drying Properties of Colloidal Silica; Other Restraints.
8. Can you provide examples of recent developments in the market?
In November 2021, Nouryon announced to increase the production capacity of the colloidal silica manufacturing facility, based in Green Bay, Wisconsin, U.S.A. The increased production capacity will help in meeting demands for packaging and construction end markets. The construction is expected to complete in the second half of 2022.
9. What pricing options are available for accessing the report?
Pricing options include single-user, multi-user, and enterprise licenses priced at USD 4750, USD 5250, and USD 8750 respectively.
10. Is the market size provided in terms of value or volume?
The market size is provided in terms of value, measured in Million and volume, measured in K Tons.
11. Are there any specific market keywords associated with the report?
Yes, the market keyword associated with the report is "Colloidal Silica Market," which aids in identifying and referencing the specific market segment covered.
12. How do I determine which pricing option suits my needs best?
The pricing options vary based on user requirements and access needs. Individual users may opt for single-user licenses, while businesses requiring broader access may choose multi-user or enterprise licenses for cost-effective access to the report.
13. Are there any additional resources or data provided in the Colloidal Silica Market report?
While the report offers comprehensive insights, it's advisable to review the specific contents or supplementary materials provided to ascertain if additional resources or data are available.
14. How can I stay updated on further developments or reports in the Colloidal Silica Market?
To stay informed about further developments, trends, and reports in the Colloidal Silica Market, consider subscribing to industry newsletters, following relevant companies and organizations, or regularly checking reputable industry news sources and publications.
Methodology
Step 1 - Identification of Relevant Samples Size from Population Database


Step 2 - Approaches for Defining Global Market Size (Value, Volume* & Price*)

Note*: In applicable scenarios
Step 3 - Data Sources
Primary Research
- Web Analytics
- Survey Reports
- Research Institute
- Latest Research Reports
- Opinion Leaders
Secondary Research
- Annual Reports
- White Paper
- Latest Press Release
- Industry Association
- Paid Database
- Investor Presentations

Step 4 - Data Triangulation
Involves using different sources of information in order to increase the validity of a study
These sources are likely to be stakeholders in a program - participants, other researchers, program staff, other community members, and so on.
Then we put all data in single framework & apply various statistical tools to find out the dynamic on the market.
During the analysis stage, feedback from the stakeholder groups would be compared to determine areas of agreement as well as areas of divergence