

Key Insights
The Clear Brine Fluids market is poised for significant expansion, driven by escalating demand for Enhanced Oil Recovery (EOR) techniques and the global growth in oil and gas exploration. With a projected Compound Annual Growth Rate (CAGR) of 3.3%, the market size was valued at $820 million in 2019 and is expected to continue its upward trajectory. Key growth catalysts include rising global energy demands and the increasing adoption of sustainable EOR solutions leveraging clear brine fluids. The market is segmented by product type, with calcium chloride, sodium chloride, and specialized brines leading the segment. The oil and gas exploration application segment remains a dominant force, propelled by ongoing exploration for new reserves. Major industry players, including ICL, Cabot Corporation, and Halliburton, are actively influencing market trends through innovation, strategic alliances, and global expansion. Despite potential challenges such as raw material price fluctuations and environmental regulations, the market's overall outlook is robust.
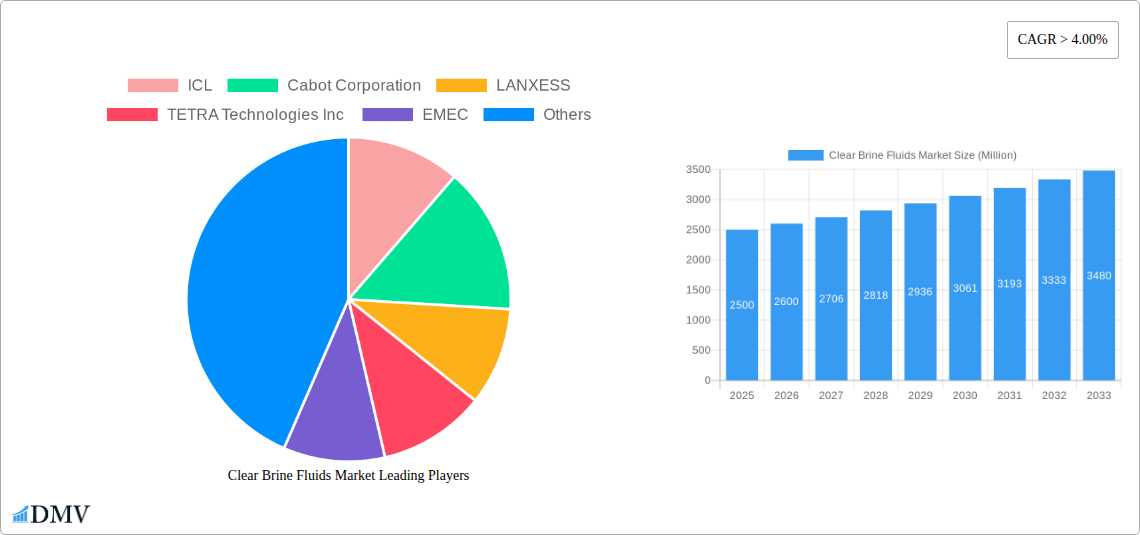
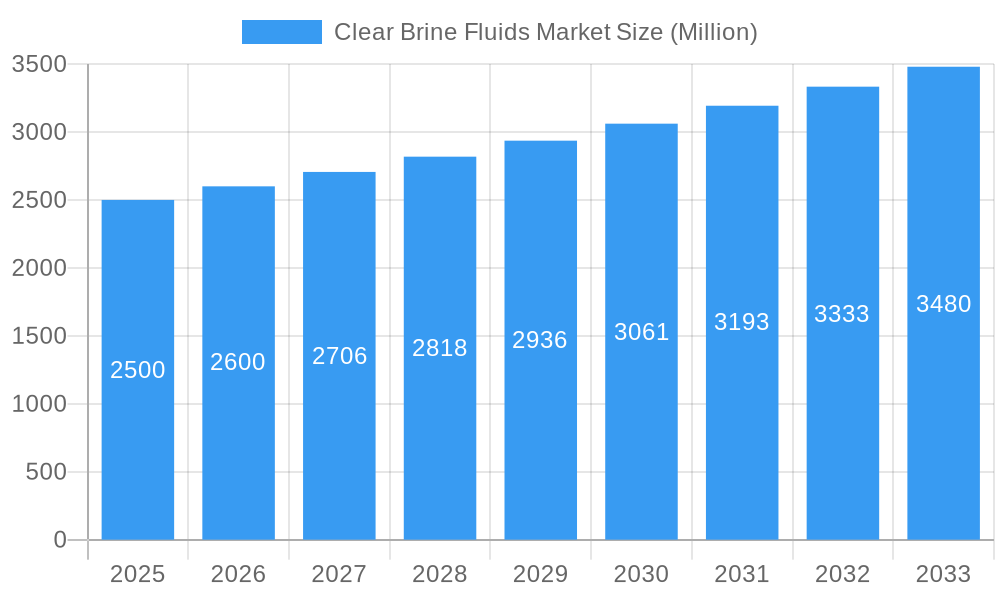
Clear Brine Fluids Market Market Size (In Million)
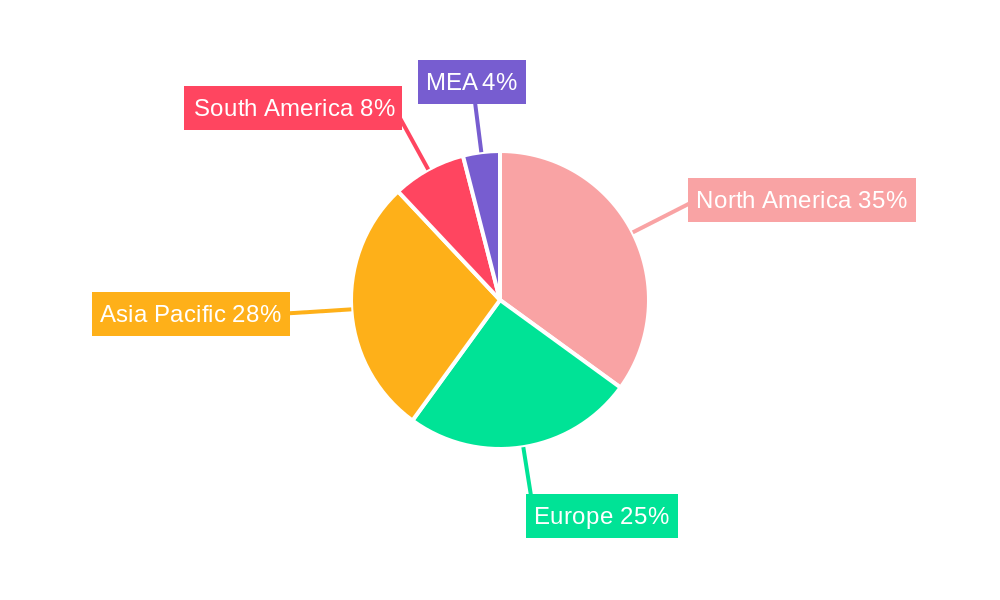
North America and the Asia-Pacific region are anticipated to exhibit strong performance, supported by substantial oil and gas activities in key economies like the United States and China. The forecast period (2025-2033) indicates substantial growth opportunities across all market segments. Emerging economies in the Asia-Pacific and South America are expected to witness increased market penetration due to growing investments in infrastructure and oil and gas exploration. Continuous development of advanced brine formulations, tailored for specific geological conditions and EOR methods, will be a significant contributor to market expansion. Competitive intensity is anticipated to remain high, with established companies pursuing strategic acquisitions and product diversification, while smaller firms focus on niche applications and specialized solutions. The long-term outlook for the Clear Brine Fluids market is optimistic, reflecting sustained growth driven by evolving industry requirements and technological advancements.
Clear Brine Fluids Market Company Market Share
Clear Brine Fluids Market: A Comprehensive Report (2019-2033)
This insightful report delivers a meticulous analysis of the Clear Brine Fluids market, providing a comprehensive overview of market dynamics, competitive landscape, and future growth prospects from 2019 to 2033. The study covers key segments, including Calcium Chloride, Sodium Chloride, Zinc Calcium Bromides, Cesium Formate, Potassium Chloride, and other product types, focusing on applications in Oil and Gas Exploration and Enhanced Oil Recovery. With a base year of 2025 and a forecast period spanning 2025-2033, this report is an invaluable resource for stakeholders seeking to understand and capitalize on the opportunities within this dynamic market. The market size is estimated to reach xx Million by 2033.
Clear Brine Fluids Market Composition & Trends
This section analyzes the Clear Brine Fluids market's structure, identifying key trends and influencing factors. The market exhibits a moderately consolidated structure, with key players like ICL, Cabot Corporation, LANXESS, TETRA Technologies Inc, EMEC, Baker Hughes Company, Halliburton, Schlumberger Limited, Clements Fluids, and Albemarle Corporation holding significant market share. The precise distribution of market share among these companies is currently under review and will be included in the final report. Innovation is primarily driven by the need for environmentally friendly, high-performance fluids, prompting continuous advancements in formulations and additives. Regulatory landscapes, particularly concerning environmental compliance and safety standards, significantly impact market dynamics. Substitute products, while limited, are gaining traction, necessitating continuous improvement in product offerings. End-user profiles are predominantly within the oil and gas sector, with exploration and production companies forming the major consumer base. M&A activities have been observed in the market, however, detailed M&A deal values are still being compiled for inclusion in the full report. This section will also detail the evolving end-user preferences and its impact on the overall market.
- Market Concentration: Moderately consolidated.
- Innovation Catalysts: Environmental concerns, performance enhancements.
- Regulatory Landscape: Stringent environmental and safety regulations.
- Substitute Products: Limited but growing presence.
- End-User Profiles: Primarily oil & gas exploration and production companies.
- M&A Activities: Ongoing, with detailed deal values to be included.
Clear Brine Fluids Market Industry Evolution
The Clear Brine Fluids market has experienced steady growth throughout the historical period (2019-2024), with an average annual growth rate (AAGR) of xx%. This growth is attributed to the increasing demand for oil and gas exploration and production activities globally. Technological advancements, including the development of specialized formulations with enhanced performance characteristics (e.g., reduced environmental impact, improved drilling efficiency), have played a crucial role in shaping market trajectories. Shifting consumer demands towards environmentally sustainable solutions are driving innovation in product development and leading to the adoption of more eco-friendly fluids. The forecast period (2025-2033) projects continued growth, driven by expanding global energy demand, technological innovation, and increasing investments in oil and gas exploration. The adoption rate of advanced clear brine fluids is expected to increase by xx% during the forecast period. The report provides a detailed analysis of these growth trends with precise data points to support its conclusions. This section will offer an in-depth analysis of the mentioned factors and provide a growth projection for the future.
Leading Regions, Countries, or Segments in Clear Brine Fluids Market
The Clear Brine Fluids market exhibits significant regional variations, with [Name of Region - Data Needed] currently dominating the market due to [Reasons for Dominance - Data Needed]. This dominance is supported by several factors:
- Key Drivers (Region):
- Robust investments in oil & gas exploration and production activities.
- Favorable government policies and regulatory support for the industry.
- A large and established oil and gas sector.
The dominant product type is currently Calcium Chloride, driven by its cost-effectiveness and wide applicability across various drilling operations. Enhanced Oil Recovery (EOR) applications demonstrate significant potential for growth due to [Reasons for Growth in EOR - Data Needed]. Further regional and segmental analysis will provide granular insights into regional and product-type specific market growth.
Clear Brine Fluids Market Product Innovations
Recent innovations in clear brine fluids have focused on enhancing performance characteristics while minimizing environmental impact. This includes the development of advanced formulations with improved rheological properties, reduced toxicity, and enhanced biodegradability. Specific examples include the use of novel polymers and additives to optimize fluid performance in challenging drilling environments. These innovations provide unique selling propositions such as improved drilling efficiency, reduced costs, and enhanced environmental sustainability. The report details these innovations and their corresponding impact on the market.
Propelling Factors for Clear Brine Fluids Market Growth
Several factors contribute to the growth of the Clear Brine Fluids market:
- Technological Advancements: Development of high-performance, environmentally friendly formulations.
- Economic Growth: Continued global demand for oil and gas, driving exploration and production investments.
- Regulatory Support: Government policies promoting the oil and gas industry and encouraging technological advancements.
Obstacles in the Clear Brine Fluids Market
Challenges facing the market include:
- Regulatory Changes: Stricter environmental regulations may increase production costs.
- Supply Chain Disruptions: Global events can impact the availability of raw materials.
- Competitive Pressures: Intense competition from existing and new market entrants.
Future Opportunities in Clear Brine Fluids Market
Future opportunities lie in:
- Emerging Markets: Expanding into untapped regions with substantial oil and gas exploration potential.
- Technological Advancements: Development of even more efficient and sustainable formulations.
- New Applications: Exploration of new applications for clear brine fluids beyond oil and gas.
Major Players in the Clear Brine Fluids Market Ecosystem
Key Developments in Clear Brine Fluids Market Industry
- July 2018: TETRA Technologies Inc. and Halliburton formed a global joint marketing and development agreement for TETRA's completion fluids.
- May 2019: Baker Hughes introduced its DELTA-TEQ low-pressure-impact drilling fluid.
Strategic Clear Brine Fluids Market Forecast
The Clear Brine Fluids market is poised for continued growth, driven by technological advancements, increasing demand, and favorable regulatory environments. The market's potential is significant, particularly in emerging markets and within the expanding EOR sector. The forecast projects a substantial increase in market size over the coming years, reflecting the ongoing trends and anticipated developments within the industry.
Clear Brine Fluids Market Segmentation
-
1. Product Type
- 1.1. Calcium Chloride
- 1.2. Sodium Chloride
- 1.3. Zinc Calcium bromides
- 1.4. Cesium Formate
- 1.5. Potassium Chloride
- 1.6. Other Product Types
-
2. Application
- 2.1. Oil and Gas Exploration
- 2.2. Enhanced Oil Recovery
Clear Brine Fluids Market Segmentation By Geography
-
1. Asia Pacific
- 1.1. China
- 1.2. India
- 1.3. Japan
- 1.4. Rest of Asia Pacific
-
2. North America
- 2.1. United States
- 2.2. Canada
- 2.3. Rest of North America
-
3. Europe
- 3.1. Germany
- 3.2. United Kingdom
- 3.3. France
- 3.4. Russia
- 3.5. Rest of Europe
-
4. South America
- 4.1. Brazil
- 4.2. Argentina
- 4.3. Rest of South America
-
5. Middle East and Africa
- 5.1. Saudi Arabia
- 5.2. Qatar
- 5.3. United Arab Emirates
- 5.4. Rest of Middle East and Africa
Clear Brine Fluids Market Regional Market Share
Geographic Coverage of Clear Brine Fluids Market
Clear Brine Fluids Market REPORT HIGHLIGHTS
| Aspects | Details |
|---|---|
| Study Period | 2020-2034 |
| Base Year | 2025 |
| Estimated Year | 2026 |
| Forecast Period | 2026-2034 |
| Historical Period | 2020-2025 |
| Growth Rate | CAGR of 3.3% from 2020-2034 |
| Segmentation |
|
Table of Contents
- 1. Introduction
- 1.1. Research Scope
- 1.2. Market Segmentation
- 1.3. Research Objective
- 1.4. Definitions and Assumptions
- 2. Executive Summary
- 2.1. Market Snapshot
- 3. Market Dynamics
- 3.1. Market Drivers
- 3.2. Market Restrains
- 3.3. Market Trends
- 3.4. Market Opportunities
- 4. Market Factor Analysis
- 4.1. Porters Five Forces
- 4.1.1. Bargaining Power of Suppliers
- 4.1.2. Bargaining Power of Buyers
- 4.1.3. Threat of New Entrants
- 4.1.4. Threat of Substitutes
- 4.1.5. Competitive Rivalry
- 4.2. PESTEL analysis
- 4.3. BCG Analysis
- 4.3.1. Stars (High Growth, High Market Share)
- 4.3.2. Cash Cows (Low Growth, High Market Share)
- 4.3.3. Question Mark (High Growth, Low Market Share)
- 4.3.4. Dogs (Low Growth, Low Market Share)
- 4.4. Ansoff Matrix Analysis
- 4.5. Supply Chain Analysis
- 4.6. Regulatory Landscape
- 4.7. Current Market Potential and Opportunity Assessment (TAM–SAM–SOM Framework)
- 4.8. DMV Analyst Note
- 4.1. Porters Five Forces
- 5. Market Analysis, Insights and Forecast 2021-2033
- 5.1. Market Analysis, Insights and Forecast - by Product Type
- 5.1.1. Calcium Chloride
- 5.1.2. Sodium Chloride
- 5.1.3. Zinc Calcium bromides
- 5.1.4. Cesium Formate
- 5.1.5. Potassium Chloride
- 5.1.6. Other Product Types
- 5.2. Market Analysis, Insights and Forecast - by Application
- 5.2.1. Oil and Gas Exploration
- 5.2.2. Enhanced Oil Recovery
- 5.3. Market Analysis, Insights and Forecast - by Region
- 5.3.1. Asia Pacific
- 5.3.2. North America
- 5.3.3. Europe
- 5.3.4. South America
- 5.3.5. Middle East and Africa
- 5.1. Market Analysis, Insights and Forecast - by Product Type
- 6. Global Clear Brine Fluids Market Analysis, Insights and Forecast, 2021-2033
- 6.1. Market Analysis, Insights and Forecast - by Product Type
- 6.1.1. Calcium Chloride
- 6.1.2. Sodium Chloride
- 6.1.3. Zinc Calcium bromides
- 6.1.4. Cesium Formate
- 6.1.5. Potassium Chloride
- 6.1.6. Other Product Types
- 6.2. Market Analysis, Insights and Forecast - by Application
- 6.2.1. Oil and Gas Exploration
- 6.2.2. Enhanced Oil Recovery
- 6.1. Market Analysis, Insights and Forecast - by Product Type
- 7. Asia Pacific Clear Brine Fluids Market Analysis, Insights and Forecast, 2020-2032
- 7.1. Market Analysis, Insights and Forecast - by Product Type
- 7.1.1. Calcium Chloride
- 7.1.2. Sodium Chloride
- 7.1.3. Zinc Calcium bromides
- 7.1.4. Cesium Formate
- 7.1.5. Potassium Chloride
- 7.1.6. Other Product Types
- 7.2. Market Analysis, Insights and Forecast - by Application
- 7.2.1. Oil and Gas Exploration
- 7.2.2. Enhanced Oil Recovery
- 7.1. Market Analysis, Insights and Forecast - by Product Type
- 8. North America Clear Brine Fluids Market Analysis, Insights and Forecast, 2020-2032
- 8.1. Market Analysis, Insights and Forecast - by Product Type
- 8.1.1. Calcium Chloride
- 8.1.2. Sodium Chloride
- 8.1.3. Zinc Calcium bromides
- 8.1.4. Cesium Formate
- 8.1.5. Potassium Chloride
- 8.1.6. Other Product Types
- 8.2. Market Analysis, Insights and Forecast - by Application
- 8.2.1. Oil and Gas Exploration
- 8.2.2. Enhanced Oil Recovery
- 8.1. Market Analysis, Insights and Forecast - by Product Type
- 9. Europe Clear Brine Fluids Market Analysis, Insights and Forecast, 2020-2032
- 9.1. Market Analysis, Insights and Forecast - by Product Type
- 9.1.1. Calcium Chloride
- 9.1.2. Sodium Chloride
- 9.1.3. Zinc Calcium bromides
- 9.1.4. Cesium Formate
- 9.1.5. Potassium Chloride
- 9.1.6. Other Product Types
- 9.2. Market Analysis, Insights and Forecast - by Application
- 9.2.1. Oil and Gas Exploration
- 9.2.2. Enhanced Oil Recovery
- 9.1. Market Analysis, Insights and Forecast - by Product Type
- 10. South America Clear Brine Fluids Market Analysis, Insights and Forecast, 2020-2032
- 10.1. Market Analysis, Insights and Forecast - by Product Type
- 10.1.1. Calcium Chloride
- 10.1.2. Sodium Chloride
- 10.1.3. Zinc Calcium bromides
- 10.1.4. Cesium Formate
- 10.1.5. Potassium Chloride
- 10.1.6. Other Product Types
- 10.2. Market Analysis, Insights and Forecast - by Application
- 10.2.1. Oil and Gas Exploration
- 10.2.2. Enhanced Oil Recovery
- 10.1. Market Analysis, Insights and Forecast - by Product Type
- 11. Middle East and Africa Clear Brine Fluids Market Analysis, Insights and Forecast, 2020-2032
- 11.1. Market Analysis, Insights and Forecast - by Product Type
- 11.1.1. Calcium Chloride
- 11.1.2. Sodium Chloride
- 11.1.3. Zinc Calcium bromides
- 11.1.4. Cesium Formate
- 11.1.5. Potassium Chloride
- 11.1.6. Other Product Types
- 11.2. Market Analysis, Insights and Forecast - by Application
- 11.2.1. Oil and Gas Exploration
- 11.2.2. Enhanced Oil Recovery
- 11.1. Market Analysis, Insights and Forecast - by Product Type
- 12. Competitive Analysis
- 12.1. Company Profiles
- 12.1.1 ICL
- 12.1.1.1. Company Overview
- 12.1.1.2. Products
- 12.1.1.3. Company Financials
- 12.1.1.4. SWOT Analysis
- 12.1.2 Cabot Corporation
- 12.1.2.1. Company Overview
- 12.1.2.2. Products
- 12.1.2.3. Company Financials
- 12.1.2.4. SWOT Analysis
- 12.1.3 LANXESS
- 12.1.3.1. Company Overview
- 12.1.3.2. Products
- 12.1.3.3. Company Financials
- 12.1.3.4. SWOT Analysis
- 12.1.4 TETRA Technologies Inc
- 12.1.4.1. Company Overview
- 12.1.4.2. Products
- 12.1.4.3. Company Financials
- 12.1.4.4. SWOT Analysis
- 12.1.5 EMEC
- 12.1.5.1. Company Overview
- 12.1.5.2. Products
- 12.1.5.3. Company Financials
- 12.1.5.4. SWOT Analysis
- 12.1.6 Baker Hughes Company
- 12.1.6.1. Company Overview
- 12.1.6.2. Products
- 12.1.6.3. Company Financials
- 12.1.6.4. SWOT Analysis
- 12.1.7 Halliburton
- 12.1.7.1. Company Overview
- 12.1.7.2. Products
- 12.1.7.3. Company Financials
- 12.1.7.4. SWOT Analysis
- 12.1.8 Schlumberger Limited
- 12.1.8.1. Company Overview
- 12.1.8.2. Products
- 12.1.8.3. Company Financials
- 12.1.8.4. SWOT Analysis
- 12.1.9 Clements Fluids
- 12.1.9.1. Company Overview
- 12.1.9.2. Products
- 12.1.9.3. Company Financials
- 12.1.9.4. SWOT Analysis
- 12.1.10 Albemarle Corporation
- 12.1.10.1. Company Overview
- 12.1.10.2. Products
- 12.1.10.3. Company Financials
- 12.1.10.4. SWOT Analysis
- 12.1.1 ICL
- 12.2. Market Entropy
- 12.2.1 Company's Key Areas Served
- 12.2.2 Recent Developments
- 12.3. Company Market Share Analysis 2025
- 12.3.1 Top 5 Companies Market Share Analysis
- 12.3.2 Top 3 Companies Market Share Analysis
- 12.4. List of Potential Customers
- 13. Research Methodology
List of Figures
- Figure 1: Global Clear Brine Fluids Market Revenue Breakdown (million, %) by Region 2025 & 2033
- Figure 2: Global Clear Brine Fluids Market Volume Breakdown (K Tons, %) by Region 2025 & 2033
- Figure 3: Asia Pacific Clear Brine Fluids Market Revenue (million), by Product Type 2025 & 2033
- Figure 4: Asia Pacific Clear Brine Fluids Market Volume (K Tons), by Product Type 2025 & 2033
- Figure 5: Asia Pacific Clear Brine Fluids Market Revenue Share (%), by Product Type 2025 & 2033
- Figure 6: Asia Pacific Clear Brine Fluids Market Volume Share (%), by Product Type 2025 & 2033
- Figure 7: Asia Pacific Clear Brine Fluids Market Revenue (million), by Application 2025 & 2033
- Figure 8: Asia Pacific Clear Brine Fluids Market Volume (K Tons), by Application 2025 & 2033
- Figure 9: Asia Pacific Clear Brine Fluids Market Revenue Share (%), by Application 2025 & 2033
- Figure 10: Asia Pacific Clear Brine Fluids Market Volume Share (%), by Application 2025 & 2033
- Figure 11: Asia Pacific Clear Brine Fluids Market Revenue (million), by Country 2025 & 2033
- Figure 12: Asia Pacific Clear Brine Fluids Market Volume (K Tons), by Country 2025 & 2033
- Figure 13: Asia Pacific Clear Brine Fluids Market Revenue Share (%), by Country 2025 & 2033
- Figure 14: Asia Pacific Clear Brine Fluids Market Volume Share (%), by Country 2025 & 2033
- Figure 15: North America Clear Brine Fluids Market Revenue (million), by Product Type 2025 & 2033
- Figure 16: North America Clear Brine Fluids Market Volume (K Tons), by Product Type 2025 & 2033
- Figure 17: North America Clear Brine Fluids Market Revenue Share (%), by Product Type 2025 & 2033
- Figure 18: North America Clear Brine Fluids Market Volume Share (%), by Product Type 2025 & 2033
- Figure 19: North America Clear Brine Fluids Market Revenue (million), by Application 2025 & 2033
- Figure 20: North America Clear Brine Fluids Market Volume (K Tons), by Application 2025 & 2033
- Figure 21: North America Clear Brine Fluids Market Revenue Share (%), by Application 2025 & 2033
- Figure 22: North America Clear Brine Fluids Market Volume Share (%), by Application 2025 & 2033
- Figure 23: North America Clear Brine Fluids Market Revenue (million), by Country 2025 & 2033
- Figure 24: North America Clear Brine Fluids Market Volume (K Tons), by Country 2025 & 2033
- Figure 25: North America Clear Brine Fluids Market Revenue Share (%), by Country 2025 & 2033
- Figure 26: North America Clear Brine Fluids Market Volume Share (%), by Country 2025 & 2033
- Figure 27: Europe Clear Brine Fluids Market Revenue (million), by Product Type 2025 & 2033
- Figure 28: Europe Clear Brine Fluids Market Volume (K Tons), by Product Type 2025 & 2033
- Figure 29: Europe Clear Brine Fluids Market Revenue Share (%), by Product Type 2025 & 2033
- Figure 30: Europe Clear Brine Fluids Market Volume Share (%), by Product Type 2025 & 2033
- Figure 31: Europe Clear Brine Fluids Market Revenue (million), by Application 2025 & 2033
- Figure 32: Europe Clear Brine Fluids Market Volume (K Tons), by Application 2025 & 2033
- Figure 33: Europe Clear Brine Fluids Market Revenue Share (%), by Application 2025 & 2033
- Figure 34: Europe Clear Brine Fluids Market Volume Share (%), by Application 2025 & 2033
- Figure 35: Europe Clear Brine Fluids Market Revenue (million), by Country 2025 & 2033
- Figure 36: Europe Clear Brine Fluids Market Volume (K Tons), by Country 2025 & 2033
- Figure 37: Europe Clear Brine Fluids Market Revenue Share (%), by Country 2025 & 2033
- Figure 38: Europe Clear Brine Fluids Market Volume Share (%), by Country 2025 & 2033
- Figure 39: South America Clear Brine Fluids Market Revenue (million), by Product Type 2025 & 2033
- Figure 40: South America Clear Brine Fluids Market Volume (K Tons), by Product Type 2025 & 2033
- Figure 41: South America Clear Brine Fluids Market Revenue Share (%), by Product Type 2025 & 2033
- Figure 42: South America Clear Brine Fluids Market Volume Share (%), by Product Type 2025 & 2033
- Figure 43: South America Clear Brine Fluids Market Revenue (million), by Application 2025 & 2033
- Figure 44: South America Clear Brine Fluids Market Volume (K Tons), by Application 2025 & 2033
- Figure 45: South America Clear Brine Fluids Market Revenue Share (%), by Application 2025 & 2033
- Figure 46: South America Clear Brine Fluids Market Volume Share (%), by Application 2025 & 2033
- Figure 47: South America Clear Brine Fluids Market Revenue (million), by Country 2025 & 2033
- Figure 48: South America Clear Brine Fluids Market Volume (K Tons), by Country 2025 & 2033
- Figure 49: South America Clear Brine Fluids Market Revenue Share (%), by Country 2025 & 2033
- Figure 50: South America Clear Brine Fluids Market Volume Share (%), by Country 2025 & 2033
- Figure 51: Middle East and Africa Clear Brine Fluids Market Revenue (million), by Product Type 2025 & 2033
- Figure 52: Middle East and Africa Clear Brine Fluids Market Volume (K Tons), by Product Type 2025 & 2033
- Figure 53: Middle East and Africa Clear Brine Fluids Market Revenue Share (%), by Product Type 2025 & 2033
- Figure 54: Middle East and Africa Clear Brine Fluids Market Volume Share (%), by Product Type 2025 & 2033
- Figure 55: Middle East and Africa Clear Brine Fluids Market Revenue (million), by Application 2025 & 2033
- Figure 56: Middle East and Africa Clear Brine Fluids Market Volume (K Tons), by Application 2025 & 2033
- Figure 57: Middle East and Africa Clear Brine Fluids Market Revenue Share (%), by Application 2025 & 2033
- Figure 58: Middle East and Africa Clear Brine Fluids Market Volume Share (%), by Application 2025 & 2033
- Figure 59: Middle East and Africa Clear Brine Fluids Market Revenue (million), by Country 2025 & 2033
- Figure 60: Middle East and Africa Clear Brine Fluids Market Volume (K Tons), by Country 2025 & 2033
- Figure 61: Middle East and Africa Clear Brine Fluids Market Revenue Share (%), by Country 2025 & 2033
- Figure 62: Middle East and Africa Clear Brine Fluids Market Volume Share (%), by Country 2025 & 2033
List of Tables
- Table 1: Global Clear Brine Fluids Market Revenue million Forecast, by Product Type 2020 & 2033
- Table 2: Global Clear Brine Fluids Market Volume K Tons Forecast, by Product Type 2020 & 2033
- Table 3: Global Clear Brine Fluids Market Revenue million Forecast, by Application 2020 & 2033
- Table 4: Global Clear Brine Fluids Market Volume K Tons Forecast, by Application 2020 & 2033
- Table 5: Global Clear Brine Fluids Market Revenue million Forecast, by Region 2020 & 2033
- Table 6: Global Clear Brine Fluids Market Volume K Tons Forecast, by Region 2020 & 2033
- Table 7: Global Clear Brine Fluids Market Revenue million Forecast, by Product Type 2020 & 2033
- Table 8: Global Clear Brine Fluids Market Volume K Tons Forecast, by Product Type 2020 & 2033
- Table 9: Global Clear Brine Fluids Market Revenue million Forecast, by Application 2020 & 2033
- Table 10: Global Clear Brine Fluids Market Volume K Tons Forecast, by Application 2020 & 2033
- Table 11: Global Clear Brine Fluids Market Revenue million Forecast, by Country 2020 & 2033
- Table 12: Global Clear Brine Fluids Market Volume K Tons Forecast, by Country 2020 & 2033
- Table 13: China Clear Brine Fluids Market Revenue (million) Forecast, by Application 2020 & 2033
- Table 14: China Clear Brine Fluids Market Volume (K Tons) Forecast, by Application 2020 & 2033
- Table 15: India Clear Brine Fluids Market Revenue (million) Forecast, by Application 2020 & 2033
- Table 16: India Clear Brine Fluids Market Volume (K Tons) Forecast, by Application 2020 & 2033
- Table 17: Japan Clear Brine Fluids Market Revenue (million) Forecast, by Application 2020 & 2033
- Table 18: Japan Clear Brine Fluids Market Volume (K Tons) Forecast, by Application 2020 & 2033
- Table 19: Rest of Asia Pacific Clear Brine Fluids Market Revenue (million) Forecast, by Application 2020 & 2033
- Table 20: Rest of Asia Pacific Clear Brine Fluids Market Volume (K Tons) Forecast, by Application 2020 & 2033
- Table 21: Global Clear Brine Fluids Market Revenue million Forecast, by Product Type 2020 & 2033
- Table 22: Global Clear Brine Fluids Market Volume K Tons Forecast, by Product Type 2020 & 2033
- Table 23: Global Clear Brine Fluids Market Revenue million Forecast, by Application 2020 & 2033
- Table 24: Global Clear Brine Fluids Market Volume K Tons Forecast, by Application 2020 & 2033
- Table 25: Global Clear Brine Fluids Market Revenue million Forecast, by Country 2020 & 2033
- Table 26: Global Clear Brine Fluids Market Volume K Tons Forecast, by Country 2020 & 2033
- Table 27: United States Clear Brine Fluids Market Revenue (million) Forecast, by Application 2020 & 2033
- Table 28: United States Clear Brine Fluids Market Volume (K Tons) Forecast, by Application 2020 & 2033
- Table 29: Canada Clear Brine Fluids Market Revenue (million) Forecast, by Application 2020 & 2033
- Table 30: Canada Clear Brine Fluids Market Volume (K Tons) Forecast, by Application 2020 & 2033
- Table 31: Rest of North America Clear Brine Fluids Market Revenue (million) Forecast, by Application 2020 & 2033
- Table 32: Rest of North America Clear Brine Fluids Market Volume (K Tons) Forecast, by Application 2020 & 2033
- Table 33: Global Clear Brine Fluids Market Revenue million Forecast, by Product Type 2020 & 2033
- Table 34: Global Clear Brine Fluids Market Volume K Tons Forecast, by Product Type 2020 & 2033
- Table 35: Global Clear Brine Fluids Market Revenue million Forecast, by Application 2020 & 2033
- Table 36: Global Clear Brine Fluids Market Volume K Tons Forecast, by Application 2020 & 2033
- Table 37: Global Clear Brine Fluids Market Revenue million Forecast, by Country 2020 & 2033
- Table 38: Global Clear Brine Fluids Market Volume K Tons Forecast, by Country 2020 & 2033
- Table 39: Germany Clear Brine Fluids Market Revenue (million) Forecast, by Application 2020 & 2033
- Table 40: Germany Clear Brine Fluids Market Volume (K Tons) Forecast, by Application 2020 & 2033
- Table 41: United Kingdom Clear Brine Fluids Market Revenue (million) Forecast, by Application 2020 & 2033
- Table 42: United Kingdom Clear Brine Fluids Market Volume (K Tons) Forecast, by Application 2020 & 2033
- Table 43: France Clear Brine Fluids Market Revenue (million) Forecast, by Application 2020 & 2033
- Table 44: France Clear Brine Fluids Market Volume (K Tons) Forecast, by Application 2020 & 2033
- Table 45: Russia Clear Brine Fluids Market Revenue (million) Forecast, by Application 2020 & 2033
- Table 46: Russia Clear Brine Fluids Market Volume (K Tons) Forecast, by Application 2020 & 2033
- Table 47: Rest of Europe Clear Brine Fluids Market Revenue (million) Forecast, by Application 2020 & 2033
- Table 48: Rest of Europe Clear Brine Fluids Market Volume (K Tons) Forecast, by Application 2020 & 2033
- Table 49: Global Clear Brine Fluids Market Revenue million Forecast, by Product Type 2020 & 2033
- Table 50: Global Clear Brine Fluids Market Volume K Tons Forecast, by Product Type 2020 & 2033
- Table 51: Global Clear Brine Fluids Market Revenue million Forecast, by Application 2020 & 2033
- Table 52: Global Clear Brine Fluids Market Volume K Tons Forecast, by Application 2020 & 2033
- Table 53: Global Clear Brine Fluids Market Revenue million Forecast, by Country 2020 & 2033
- Table 54: Global Clear Brine Fluids Market Volume K Tons Forecast, by Country 2020 & 2033
- Table 55: Brazil Clear Brine Fluids Market Revenue (million) Forecast, by Application 2020 & 2033
- Table 56: Brazil Clear Brine Fluids Market Volume (K Tons) Forecast, by Application 2020 & 2033
- Table 57: Argentina Clear Brine Fluids Market Revenue (million) Forecast, by Application 2020 & 2033
- Table 58: Argentina Clear Brine Fluids Market Volume (K Tons) Forecast, by Application 2020 & 2033
- Table 59: Rest of South America Clear Brine Fluids Market Revenue (million) Forecast, by Application 2020 & 2033
- Table 60: Rest of South America Clear Brine Fluids Market Volume (K Tons) Forecast, by Application 2020 & 2033
- Table 61: Global Clear Brine Fluids Market Revenue million Forecast, by Product Type 2020 & 2033
- Table 62: Global Clear Brine Fluids Market Volume K Tons Forecast, by Product Type 2020 & 2033
- Table 63: Global Clear Brine Fluids Market Revenue million Forecast, by Application 2020 & 2033
- Table 64: Global Clear Brine Fluids Market Volume K Tons Forecast, by Application 2020 & 2033
- Table 65: Global Clear Brine Fluids Market Revenue million Forecast, by Country 2020 & 2033
- Table 66: Global Clear Brine Fluids Market Volume K Tons Forecast, by Country 2020 & 2033
- Table 67: Saudi Arabia Clear Brine Fluids Market Revenue (million) Forecast, by Application 2020 & 2033
- Table 68: Saudi Arabia Clear Brine Fluids Market Volume (K Tons) Forecast, by Application 2020 & 2033
- Table 69: Qatar Clear Brine Fluids Market Revenue (million) Forecast, by Application 2020 & 2033
- Table 70: Qatar Clear Brine Fluids Market Volume (K Tons) Forecast, by Application 2020 & 2033
- Table 71: United Arab Emirates Clear Brine Fluids Market Revenue (million) Forecast, by Application 2020 & 2033
- Table 72: United Arab Emirates Clear Brine Fluids Market Volume (K Tons) Forecast, by Application 2020 & 2033
- Table 73: Rest of Middle East and Africa Clear Brine Fluids Market Revenue (million) Forecast, by Application 2020 & 2033
- Table 74: Rest of Middle East and Africa Clear Brine Fluids Market Volume (K Tons) Forecast, by Application 2020 & 2033
Frequently Asked Questions
1. What is the projected Compound Annual Growth Rate (CAGR) of the Clear Brine Fluids Market?
The projected CAGR is approximately 3.3%.
2. Which companies are prominent players in the Clear Brine Fluids Market?
Key companies in the market include ICL, Cabot Corporation, LANXESS, TETRA Technologies Inc , EMEC, Baker Hughes Company, Halliburton, Schlumberger Limited, Clements Fluids, Albemarle Corporation.
3. What are the main segments of the Clear Brine Fluids Market?
The market segments include Product Type, Application.
4. Can you provide details about the market size?
The market size is estimated to be USD 820 million as of 2022.
5. What are some drivers contributing to market growth?
Rising Global Hydrocarbon Exploration and Production; Increasing Enhanced Oil Recovery Activities.
6. What are the notable trends driving market growth?
Increasing Demand from the Oil and Gas Exploration Activity.
7. Are there any restraints impacting market growth?
Fluctuations in Crude Oil Prices; Impact of COVID-19 Outbreak.
8. Can you provide examples of recent developments in the market?
In May 2019, Baker Hughes, a GE company, announced the introduction of its DELTA-TEQ low-pressure-impact drilling fluid, a non-aqueous formulation that reduces the hydraulic impact with an advanced formulation of specialized clay and polymers.
9. What pricing options are available for accessing the report?
Pricing options include single-user, multi-user, and enterprise licenses priced at USD 3,950, USD 4,950, and USD 6,950 respectively.
10. Is the market size provided in terms of value or volume?
The market size is provided in terms of value, measured in million and volume, measured in K Tons.
11. Are there any specific market keywords associated with the report?
Yes, the market keyword associated with the report is "Clear Brine Fluids Market," which aids in identifying and referencing the specific market segment covered.
12. How do I determine which pricing option suits my needs best?
The pricing options vary based on user requirements and access needs. Individual users may opt for single-user licenses, while businesses requiring broader access may choose multi-user or enterprise licenses for cost-effective access to the report.
13. Are there any additional resources or data provided in the Clear Brine Fluids Market report?
While the report offers comprehensive insights, it's advisable to review the specific contents or supplementary materials provided to ascertain if additional resources or data are available.
14. How can I stay updated on further developments or reports in the Clear Brine Fluids Market?
To stay informed about further developments, trends, and reports in the Clear Brine Fluids Market, consider subscribing to industry newsletters, following relevant companies and organizations, or regularly checking reputable industry news sources and publications.
Methodology
Step 1 - Identification of Relevant Samples Size from Population Database


Step 2 - Approaches for Defining Global Market Size (Value, Volume* & Price*)

Note*: In applicable scenarios
Step 3 - Data Sources
Primary Research
- Web Analytics
- Survey Reports
- Research Institute
- Latest Research Reports
- Opinion Leaders
Secondary Research
- Annual Reports
- White Paper
- Latest Press Release
- Industry Association
- Paid Database
- Investor Presentations

Step 4 - Data Triangulation
Involves using different sources of information in order to increase the validity of a study
These sources are likely to be stakeholders in a program - participants, other researchers, program staff, other community members, and so on.
Then we put all data in single framework & apply various statistical tools to find out the dynamic on the market.
During the analysis stage, feedback from the stakeholder groups would be compared to determine areas of agreement as well as areas of divergence