

Key Insights
The global choline chloride market is experiencing robust growth, driven by increasing demand from the animal feed industry, particularly poultry and swine feed, due to its crucial role in animal health and productivity. The market's Compound Annual Growth Rate (CAGR) exceeding 4.00% from 2019 to 2024 suggests a sustained upward trajectory. Significant growth drivers include the rising global population leading to increased meat consumption, the adoption of advanced animal farming practices focused on improved feed efficiency, and the expanding pet food sector. Furthermore, the utilization of choline chloride in human nutrition supplements, albeit a smaller segment currently, represents a promising avenue for future expansion. Geographic expansion, particularly in developing economies of Asia-Pacific, fuels further market expansion. However, price fluctuations in raw materials and potential regulatory changes pose challenges to sustained growth. The market is moderately fragmented, with major players like BASF SE, Merck KGaA, and Thermo Fisher Scientific Inc. competing alongside numerous regional and specialty chemical companies. The market’s competitive landscape is shaped by strategies focused on product innovation, expansion into new markets, and mergers and acquisitions to gain a stronger foothold.
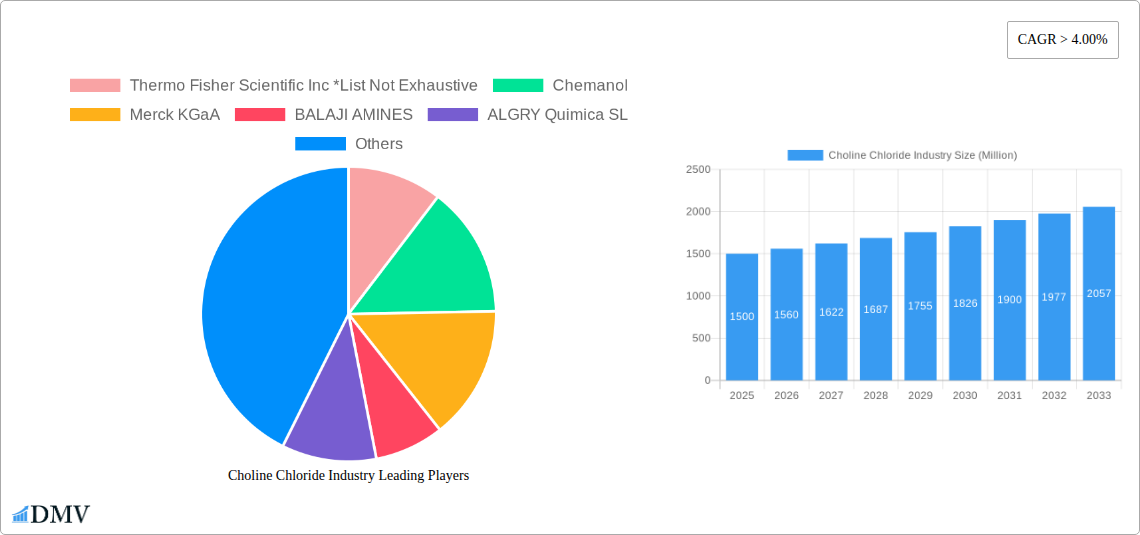
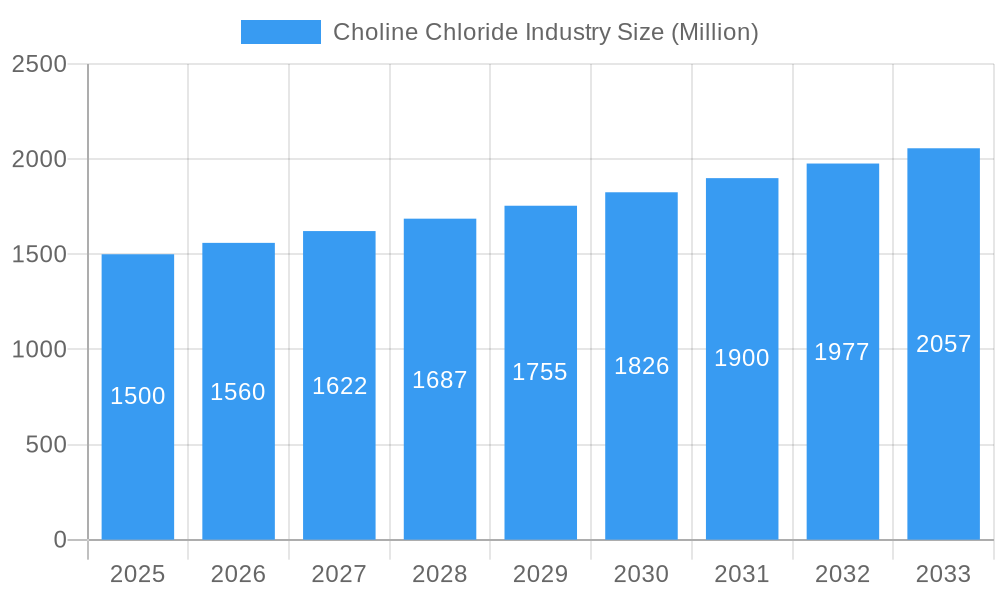
Choline Chloride Industry Market Size (In Billion)
Despite the challenges, the choline chloride market is projected to witness substantial growth over the forecast period (2025-2033). The continued emphasis on efficient and sustainable animal agriculture, coupled with growing awareness of choline chloride's benefits in human health, will propel demand. Strategic alliances and technological advancements in production processes are expected to influence the market structure. Companies are likely to focus on cost-effective manufacturing and diversification to mitigate risks associated with raw material prices. The Asia-Pacific region, driven by high demand from China and India, is anticipated to remain a key market, while other regions, including North America and Europe, will continue to contribute to the overall market growth through steady consumption and emerging applications in human nutrition and specialized industrial uses.
Choline Chloride Industry Company Market Share
Choline Chloride Industry: A Comprehensive Market Report (2019-2033)
This insightful report provides a detailed analysis of the global choline chloride industry, offering a comprehensive overview of market dynamics, growth drivers, challenges, and future opportunities from 2019 to 2033. The report leverages extensive primary and secondary research to deliver actionable insights for stakeholders across the value chain. With a base year of 2025 and a forecast period spanning 2025-2033, this study is an indispensable resource for businesses seeking to navigate the complexities of this dynamic market. The total market value is predicted to reach xx Million by 2033.
Choline Chloride Industry Market Composition & Trends
The choline chloride market exhibits a moderately concentrated structure, with key players such as Thermo Fisher Scientific Inc, Chemanol, Merck KGaA, and BASF SE holding significant market share. However, the presence of several smaller players indicates a competitive landscape. Innovation is driven by the need for higher purity products, improved efficiency in animal feed applications, and the exploration of new applications in human nutrition and other sectors. Regulatory landscapes vary across regions, impacting production and labeling requirements. Substitute products, while limited, include betaine and other choline sources, posing a minor competitive threat. End-user profiles are dominated by the animal feed industry (poultry, swine, and pet food), with growing interest from human nutrition and specialized chemical applications. Recent M&A activities have been relatively modest, with a notable example being Chemanol's USD 1.33 Million agreement with Saudi GDI in October 2022.
- Market Share Distribution (2024 Estimate): Thermo Fisher Scientific Inc (xx%), Chemanol (xx%), Merck KGaA (xx%), BASF SE (xx%), Others (xx%).
- M&A Deal Values (2019-2024): Total value estimated at xx Million USD.
- Key Innovation Catalysts: Higher purity demands, cost reduction strategies, expansion into novel applications.
- Regulatory Landscape: Varying regulations across different regions concerning food safety and chemical usage.
Choline Chloride Industry Industry Evolution
The choline chloride market has experienced steady growth over the historical period (2019-2024), driven primarily by the expansion of the animal feed industry, particularly in developing economies. Technological advancements, such as improved production processes and enhanced product formulations, have enhanced efficiency and product quality. Shifting consumer demands toward healthier and more sustainable food products are indirectly influencing the market, pushing for greater transparency and traceability in the supply chain. The market is expected to maintain a healthy growth trajectory (xx% CAGR) during the forecast period (2025-2033), fueled by increasing demand from various sectors, including human nutrition and specialized chemical applications. The adoption rate of choline chloride in animal feed has consistently increased, reflecting its crucial role in animal health and productivity. Specific data on growth rates and adoption metrics are detailed in the full report.
Leading Regions, Countries, or Segments in Choline Chloride Industry
The animal feed segment, specifically poultry feed, represents the largest application area for choline chloride, currently holding a market share of approximately xx%.
- Key Drivers for Poultry Feed Dominance:
- High demand for poultry meat globally.
- Essential role of choline chloride in poultry health and egg production.
- Relatively high inclusion rates in poultry feed compared to other animal feeds.
- Extensive research on the efficacy of choline chloride in poultry nutrition.
Other significant segments include swine feed and pet food, with increasing adoption rates. Growth in human nutrition and other applications is expected to gain momentum. Asia-Pacific emerges as a leading region, fueled by substantial growth in livestock production.
Choline Chloride Industry Product Innovations
Recent product innovations include the development of highly purified choline chloride formulations with enhanced bioavailability and improved stability. New delivery systems, such as encapsulated choline chloride, are being developed to optimize nutrient utilization in animal feed. These innovations offer unique selling propositions based on improved performance metrics, including enhanced animal growth rates, improved feed efficiency, and reduced production costs. Technological advancements in production processes are leading to cost reductions and enhanced sustainability.
Propelling Factors for Choline Chloride Industry Growth
Growth in the choline chloride market is driven by several factors: the rising global demand for animal protein, particularly poultry and pork; the increasing awareness of the importance of choline in animal and human nutrition; and technological advancements that are lowering production costs and improving product quality. Government regulations promoting sustainable animal agriculture are also positively influencing the market. For example, the increased adoption of sustainable farming practices enhances the value proposition of choline chloride as an efficient nutritional supplement.
Obstacles in the Choline Chloride Industry Market
Major barriers include fluctuating raw material prices, potential supply chain disruptions, and intense competition from established and emerging players. Regulatory hurdles, particularly concerning food safety and environmental standards, pose challenges in certain regions. The market is susceptible to variations in feed prices, impacting the affordability of choline chloride for animal feed manufacturers.
Future Opportunities in Choline Chloride Industry
Emerging opportunities lie in expanding into new markets, particularly in developing economies with rapidly growing livestock sectors. The development of novel applications in human nutrition and specialized chemical industries holds considerable potential. Innovation in delivery systems and formulations can enhance product performance and market penetration. Sustainability initiatives, such as the utilization of renewable feedstocks and eco-friendly production methods, present significant opportunities for differentiation and growth.
Major Players in the Choline Chloride Industry Ecosystem
- Thermo Fisher Scientific Inc
- Chemanol
- Merck KGaA
- BALAJI AMINES
- ALGRY Quimica SL
- SDA Products
- Liaoning Biochem Co Ltd
- Spectrum Chemical
- Neobiótica SA
- BASF SE
- NB Group Co Ltd
- IMPERIAL GROUP LIMITED
- Eastman Chemical Company
- Impextraco NV
- Tokyo Chemical Industry
- Kemin Industries Inc
- Balchem Inc
- Muby Chemicals of Mubychem Group
- GHW International
Key Developments in Choline Chloride Industry Industry
- January 2021: Balchem launched a new line of choline chloride products for Europe, the Middle East, Africa, and Asia, expanding its market reach and product portfolio.
- October 2022: Chemanol secured a USD 1.33 Million agreement with Saudi GDI for the production of specialty chemicals, including choline chloride, boosting its production capacity and market presence.
Strategic Choline Chloride Industry Market Forecast
The choline chloride market is poised for robust growth in the coming years, driven by strong demand from the animal feed industry and expanding applications in human nutrition and other sectors. The market's future potential is substantial, particularly in developing economies, and is expected to be significantly influenced by continued product innovation, favorable regulatory environments, and the expanding global demand for animal protein. Opportunities abound for companies to differentiate through sustainability initiatives and technological advancements in production processes.
Choline Chloride Industry Segmentation
-
1. Application
- 1.1. Poultry Feed
- 1.2. Swine Feed
- 1.3. Pet Feed
- 1.4. Human Nutrition
- 1.5. Oil and Gas
- 1.6. Other Applications
Choline Chloride Industry Segmentation By Geography
-
1. Asia Pacific
- 1.1. China
- 1.2. India
- 1.3. Japan
- 1.4. South Korea
- 1.5. Rest of Asia Pacific
-
2. North America
- 2.1. United States
- 2.2. Canada
- 2.3. Mexico
-
3. Europe
- 3.1. Germany
- 3.2. United Kingdom
- 3.3. Italy
- 3.4. France
- 3.5. Rest of Europe
-
4. South America
- 4.1. Brazil
- 4.2. Argentina
- 4.3. Rest of South America
-
5. Middle East and Africa
- 5.1. Saudi Arabia
- 5.2. South Africa
- 5.3. Rest of Middle East and Africa
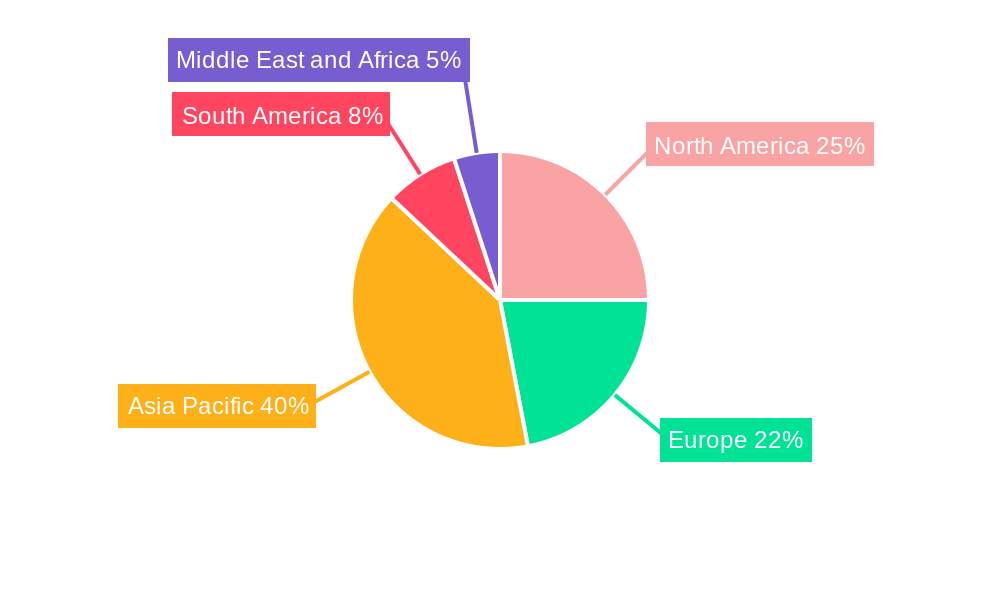
Choline Chloride Industry Regional Market Share
Geographic Coverage of Choline Chloride Industry
Choline Chloride Industry REPORT HIGHLIGHTS
| Aspects | Details |
|---|---|
| Study Period | 2020-2034 |
| Base Year | 2025 |
| Estimated Year | 2026 |
| Forecast Period | 2026-2034 |
| Historical Period | 2020-2025 |
| Growth Rate | CAGR of 6.1% from 2020-2034 |
| Segmentation |
|
Table of Contents
- 1. Introduction
- 1.1. Research Scope
- 1.2. Market Segmentation
- 1.3. Research Objective
- 1.4. Definitions and Assumptions
- 2. Executive Summary
- 2.1. Market Snapshot
- 3. Market Dynamics
- 3.1. Market Drivers
- 3.2. Market Restrains
- 3.3. Market Trends
- 3.4. Market Opportunities
- 4. Market Factor Analysis
- 4.1. Porters Five Forces
- 4.1.1. Bargaining Power of Suppliers
- 4.1.2. Bargaining Power of Buyers
- 4.1.3. Threat of New Entrants
- 4.1.4. Threat of Substitutes
- 4.1.5. Competitive Rivalry
- 4.2. PESTEL analysis
- 4.3. BCG Analysis
- 4.3.1. Stars (High Growth, High Market Share)
- 4.3.2. Cash Cows (Low Growth, High Market Share)
- 4.3.3. Question Mark (High Growth, Low Market Share)
- 4.3.4. Dogs (Low Growth, Low Market Share)
- 4.4. Ansoff Matrix Analysis
- 4.5. Supply Chain Analysis
- 4.6. Regulatory Landscape
- 4.7. Current Market Potential and Opportunity Assessment (TAM–SAM–SOM Framework)
- 4.8. DMV Analyst Note
- 4.1. Porters Five Forces
- 5. Market Analysis, Insights and Forecast 2021-2033
- 5.1. Market Analysis, Insights and Forecast - by Application
- 5.1.1. Poultry Feed
- 5.1.2. Swine Feed
- 5.1.3. Pet Feed
- 5.1.4. Human Nutrition
- 5.1.5. Oil and Gas
- 5.1.6. Other Applications
- 5.2. Market Analysis, Insights and Forecast - by Region
- 5.2.1. Asia Pacific
- 5.2.2. North America
- 5.2.3. Europe
- 5.2.4. South America
- 5.2.5. Middle East and Africa
- 5.1. Market Analysis, Insights and Forecast - by Application
- 6. Global Choline Chloride Industry Analysis, Insights and Forecast, 2021-2033
- 6.1. Market Analysis, Insights and Forecast - by Application
- 6.1.1. Poultry Feed
- 6.1.2. Swine Feed
- 6.1.3. Pet Feed
- 6.1.4. Human Nutrition
- 6.1.5. Oil and Gas
- 6.1.6. Other Applications
- 6.1. Market Analysis, Insights and Forecast - by Application
- 7. Asia Pacific Choline Chloride Industry Analysis, Insights and Forecast, 2020-2032
- 7.1. Market Analysis, Insights and Forecast - by Application
- 7.1.1. Poultry Feed
- 7.1.2. Swine Feed
- 7.1.3. Pet Feed
- 7.1.4. Human Nutrition
- 7.1.5. Oil and Gas
- 7.1.6. Other Applications
- 7.1. Market Analysis, Insights and Forecast - by Application
- 8. North America Choline Chloride Industry Analysis, Insights and Forecast, 2020-2032
- 8.1. Market Analysis, Insights and Forecast - by Application
- 8.1.1. Poultry Feed
- 8.1.2. Swine Feed
- 8.1.3. Pet Feed
- 8.1.4. Human Nutrition
- 8.1.5. Oil and Gas
- 8.1.6. Other Applications
- 8.1. Market Analysis, Insights and Forecast - by Application
- 9. Europe Choline Chloride Industry Analysis, Insights and Forecast, 2020-2032
- 9.1. Market Analysis, Insights and Forecast - by Application
- 9.1.1. Poultry Feed
- 9.1.2. Swine Feed
- 9.1.3. Pet Feed
- 9.1.4. Human Nutrition
- 9.1.5. Oil and Gas
- 9.1.6. Other Applications
- 9.1. Market Analysis, Insights and Forecast - by Application
- 10. South America Choline Chloride Industry Analysis, Insights and Forecast, 2020-2032
- 10.1. Market Analysis, Insights and Forecast - by Application
- 10.1.1. Poultry Feed
- 10.1.2. Swine Feed
- 10.1.3. Pet Feed
- 10.1.4. Human Nutrition
- 10.1.5. Oil and Gas
- 10.1.6. Other Applications
- 10.1. Market Analysis, Insights and Forecast - by Application
- 11. Middle East and Africa Choline Chloride Industry Analysis, Insights and Forecast, 2020-2032
- 11.1. Market Analysis, Insights and Forecast - by Application
- 11.1.1. Poultry Feed
- 11.1.2. Swine Feed
- 11.1.3. Pet Feed
- 11.1.4. Human Nutrition
- 11.1.5. Oil and Gas
- 11.1.6. Other Applications
- 11.1. Market Analysis, Insights and Forecast - by Application
- 12. Competitive Analysis
- 12.1. Company Profiles
- 12.1.1 Thermo Fisher Scientific Inc *List Not Exhaustive
- 12.1.1.1. Company Overview
- 12.1.1.2. Products
- 12.1.1.3. Company Financials
- 12.1.1.4. SWOT Analysis
- 12.1.2 Chemanol
- 12.1.2.1. Company Overview
- 12.1.2.2. Products
- 12.1.2.3. Company Financials
- 12.1.2.4. SWOT Analysis
- 12.1.3 Merck KGaA
- 12.1.3.1. Company Overview
- 12.1.3.2. Products
- 12.1.3.3. Company Financials
- 12.1.3.4. SWOT Analysis
- 12.1.4 BALAJI AMINES
- 12.1.4.1. Company Overview
- 12.1.4.2. Products
- 12.1.4.3. Company Financials
- 12.1.4.4. SWOT Analysis
- 12.1.5 ALGRY Quimica SL
- 12.1.5.1. Company Overview
- 12.1.5.2. Products
- 12.1.5.3. Company Financials
- 12.1.5.4. SWOT Analysis
- 12.1.6 SDA Products
- 12.1.6.1. Company Overview
- 12.1.6.2. Products
- 12.1.6.3. Company Financials
- 12.1.6.4. SWOT Analysis
- 12.1.7 Liaoning Biochem Co Ltd
- 12.1.7.1. Company Overview
- 12.1.7.2. Products
- 12.1.7.3. Company Financials
- 12.1.7.4. SWOT Analysis
- 12.1.8 Spectrum Chemical
- 12.1.8.1. Company Overview
- 12.1.8.2. Products
- 12.1.8.3. Company Financials
- 12.1.8.4. SWOT Analysis
- 12.1.9 Neobiótica SA
- 12.1.9.1. Company Overview
- 12.1.9.2. Products
- 12.1.9.3. Company Financials
- 12.1.9.4. SWOT Analysis
- 12.1.10 BASF SE
- 12.1.10.1. Company Overview
- 12.1.10.2. Products
- 12.1.10.3. Company Financials
- 12.1.10.4. SWOT Analysis
- 12.1.11 NB Group Co Ltd
- 12.1.11.1. Company Overview
- 12.1.11.2. Products
- 12.1.11.3. Company Financials
- 12.1.11.4. SWOT Analysis
- 12.1.12 IMPERIAL GROUP LIMITED
- 12.1.12.1. Company Overview
- 12.1.12.2. Products
- 12.1.12.3. Company Financials
- 12.1.12.4. SWOT Analysis
- 12.1.13 Eastman Chemical Company
- 12.1.13.1. Company Overview
- 12.1.13.2. Products
- 12.1.13.3. Company Financials
- 12.1.13.4. SWOT Analysis
- 12.1.14 Impextraco NV
- 12.1.14.1. Company Overview
- 12.1.14.2. Products
- 12.1.14.3. Company Financials
- 12.1.14.4. SWOT Analysis
- 12.1.15 Tokyo Chemical Industry
- 12.1.15.1. Company Overview
- 12.1.15.2. Products
- 12.1.15.3. Company Financials
- 12.1.15.4. SWOT Analysis
- 12.1.16 Kemin Industries Inc
- 12.1.16.1. Company Overview
- 12.1.16.2. Products
- 12.1.16.3. Company Financials
- 12.1.16.4. SWOT Analysis
- 12.1.17 Balchem Inc
- 12.1.17.1. Company Overview
- 12.1.17.2. Products
- 12.1.17.3. Company Financials
- 12.1.17.4. SWOT Analysis
- 12.1.18 Muby Chemicals of Mubychem Group
- 12.1.18.1. Company Overview
- 12.1.18.2. Products
- 12.1.18.3. Company Financials
- 12.1.18.4. SWOT Analysis
- 12.1.19 GHW International
- 12.1.19.1. Company Overview
- 12.1.19.2. Products
- 12.1.19.3. Company Financials
- 12.1.19.4. SWOT Analysis
- 12.1.1 Thermo Fisher Scientific Inc *List Not Exhaustive
- 12.2. Market Entropy
- 12.2.1 Company's Key Areas Served
- 12.2.2 Recent Developments
- 12.3. Company Market Share Analysis 2025
- 12.3.1 Top 5 Companies Market Share Analysis
- 12.3.2 Top 3 Companies Market Share Analysis
- 12.4. List of Potential Customers
- 13. Research Methodology
List of Figures
- Figure 1: Global Choline Chloride Industry Revenue Breakdown (million, %) by Region 2025 & 2033
- Figure 2: Asia Pacific Choline Chloride Industry Revenue (million), by Application 2025 & 2033
- Figure 3: Asia Pacific Choline Chloride Industry Revenue Share (%), by Application 2025 & 2033
- Figure 4: Asia Pacific Choline Chloride Industry Revenue (million), by Country 2025 & 2033
- Figure 5: Asia Pacific Choline Chloride Industry Revenue Share (%), by Country 2025 & 2033
- Figure 6: North America Choline Chloride Industry Revenue (million), by Application 2025 & 2033
- Figure 7: North America Choline Chloride Industry Revenue Share (%), by Application 2025 & 2033
- Figure 8: North America Choline Chloride Industry Revenue (million), by Country 2025 & 2033
- Figure 9: North America Choline Chloride Industry Revenue Share (%), by Country 2025 & 2033
- Figure 10: Europe Choline Chloride Industry Revenue (million), by Application 2025 & 2033
- Figure 11: Europe Choline Chloride Industry Revenue Share (%), by Application 2025 & 2033
- Figure 12: Europe Choline Chloride Industry Revenue (million), by Country 2025 & 2033
- Figure 13: Europe Choline Chloride Industry Revenue Share (%), by Country 2025 & 2033
- Figure 14: South America Choline Chloride Industry Revenue (million), by Application 2025 & 2033
- Figure 15: South America Choline Chloride Industry Revenue Share (%), by Application 2025 & 2033
- Figure 16: South America Choline Chloride Industry Revenue (million), by Country 2025 & 2033
- Figure 17: South America Choline Chloride Industry Revenue Share (%), by Country 2025 & 2033
- Figure 18: Middle East and Africa Choline Chloride Industry Revenue (million), by Application 2025 & 2033
- Figure 19: Middle East and Africa Choline Chloride Industry Revenue Share (%), by Application 2025 & 2033
- Figure 20: Middle East and Africa Choline Chloride Industry Revenue (million), by Country 2025 & 2033
- Figure 21: Middle East and Africa Choline Chloride Industry Revenue Share (%), by Country 2025 & 2033
List of Tables
- Table 1: Global Choline Chloride Industry Revenue million Forecast, by Application 2020 & 2033
- Table 2: Global Choline Chloride Industry Revenue million Forecast, by Region 2020 & 2033
- Table 3: Global Choline Chloride Industry Revenue million Forecast, by Application 2020 & 2033
- Table 4: Global Choline Chloride Industry Revenue million Forecast, by Country 2020 & 2033
- Table 5: China Choline Chloride Industry Revenue (million) Forecast, by Application 2020 & 2033
- Table 6: India Choline Chloride Industry Revenue (million) Forecast, by Application 2020 & 2033
- Table 7: Japan Choline Chloride Industry Revenue (million) Forecast, by Application 2020 & 2033
- Table 8: South Korea Choline Chloride Industry Revenue (million) Forecast, by Application 2020 & 2033
- Table 9: Rest of Asia Pacific Choline Chloride Industry Revenue (million) Forecast, by Application 2020 & 2033
- Table 10: Global Choline Chloride Industry Revenue million Forecast, by Application 2020 & 2033
- Table 11: Global Choline Chloride Industry Revenue million Forecast, by Country 2020 & 2033
- Table 12: United States Choline Chloride Industry Revenue (million) Forecast, by Application 2020 & 2033
- Table 13: Canada Choline Chloride Industry Revenue (million) Forecast, by Application 2020 & 2033
- Table 14: Mexico Choline Chloride Industry Revenue (million) Forecast, by Application 2020 & 2033
- Table 15: Global Choline Chloride Industry Revenue million Forecast, by Application 2020 & 2033
- Table 16: Global Choline Chloride Industry Revenue million Forecast, by Country 2020 & 2033
- Table 17: Germany Choline Chloride Industry Revenue (million) Forecast, by Application 2020 & 2033
- Table 18: United Kingdom Choline Chloride Industry Revenue (million) Forecast, by Application 2020 & 2033
- Table 19: Italy Choline Chloride Industry Revenue (million) Forecast, by Application 2020 & 2033
- Table 20: France Choline Chloride Industry Revenue (million) Forecast, by Application 2020 & 2033
- Table 21: Rest of Europe Choline Chloride Industry Revenue (million) Forecast, by Application 2020 & 2033
- Table 22: Global Choline Chloride Industry Revenue million Forecast, by Application 2020 & 2033
- Table 23: Global Choline Chloride Industry Revenue million Forecast, by Country 2020 & 2033
- Table 24: Brazil Choline Chloride Industry Revenue (million) Forecast, by Application 2020 & 2033
- Table 25: Argentina Choline Chloride Industry Revenue (million) Forecast, by Application 2020 & 2033
- Table 26: Rest of South America Choline Chloride Industry Revenue (million) Forecast, by Application 2020 & 2033
- Table 27: Global Choline Chloride Industry Revenue million Forecast, by Application 2020 & 2033
- Table 28: Global Choline Chloride Industry Revenue million Forecast, by Country 2020 & 2033
- Table 29: Saudi Arabia Choline Chloride Industry Revenue (million) Forecast, by Application 2020 & 2033
- Table 30: South Africa Choline Chloride Industry Revenue (million) Forecast, by Application 2020 & 2033
- Table 31: Rest of Middle East and Africa Choline Chloride Industry Revenue (million) Forecast, by Application 2020 & 2033
Frequently Asked Questions
1. What is the projected Compound Annual Growth Rate (CAGR) of the Choline Chloride Industry?
The projected CAGR is approximately 6.1%.
2. Which companies are prominent players in the Choline Chloride Industry?
Key companies in the market include Thermo Fisher Scientific Inc *List Not Exhaustive, Chemanol, Merck KGaA, BALAJI AMINES, ALGRY Quimica SL, SDA Products, Liaoning Biochem Co Ltd, Spectrum Chemical, Neobiótica SA, BASF SE, NB Group Co Ltd, IMPERIAL GROUP LIMITED, Eastman Chemical Company, Impextraco NV, Tokyo Chemical Industry, Kemin Industries Inc, Balchem Inc, Muby Chemicals of Mubychem Group, GHW International.
3. What are the main segments of the Choline Chloride Industry?
The market segments include Application.
4. Can you provide details about the market size?
The market size is estimated to be USD 550.13 million as of 2022.
5. What are some drivers contributing to market growth?
Rapidly Growing Demand from the Poultry Industry; Increased Intake as Human Nutrition Supplements.
6. What are the notable trends driving market growth?
High Demand from Poultry Feed Segment.
7. Are there any restraints impacting market growth?
Animal Disease Outbreaks.
8. Can you provide examples of recent developments in the market?
October 2022: Methanol Chemicals Company (Chemanol) signed an agreement worth nearly USD 1.33 million with Saudi GDI for the production of specialty chemicals that include choline chloride as well as methyl diethanolamine.
9. What pricing options are available for accessing the report?
Pricing options include single-user, multi-user, and enterprise licenses priced at USD 4750, USD 5250, and USD 8750 respectively.
10. Is the market size provided in terms of value or volume?
The market size is provided in terms of value, measured in million.
11. Are there any specific market keywords associated with the report?
Yes, the market keyword associated with the report is "Choline Chloride Industry," which aids in identifying and referencing the specific market segment covered.
12. How do I determine which pricing option suits my needs best?
The pricing options vary based on user requirements and access needs. Individual users may opt for single-user licenses, while businesses requiring broader access may choose multi-user or enterprise licenses for cost-effective access to the report.
13. Are there any additional resources or data provided in the Choline Chloride Industry report?
While the report offers comprehensive insights, it's advisable to review the specific contents or supplementary materials provided to ascertain if additional resources or data are available.
14. How can I stay updated on further developments or reports in the Choline Chloride Industry?
To stay informed about further developments, trends, and reports in the Choline Chloride Industry, consider subscribing to industry newsletters, following relevant companies and organizations, or regularly checking reputable industry news sources and publications.
Methodology
Step 1 - Identification of Relevant Samples Size from Population Database


Step 2 - Approaches for Defining Global Market Size (Value, Volume* & Price*)

Note*: In applicable scenarios
Step 3 - Data Sources
Primary Research
- Web Analytics
- Survey Reports
- Research Institute
- Latest Research Reports
- Opinion Leaders
Secondary Research
- Annual Reports
- White Paper
- Latest Press Release
- Industry Association
- Paid Database
- Investor Presentations

Step 4 - Data Triangulation
Involves using different sources of information in order to increase the validity of a study
These sources are likely to be stakeholders in a program - participants, other researchers, program staff, other community members, and so on.
Then we put all data in single framework & apply various statistical tools to find out the dynamic on the market.
During the analysis stage, feedback from the stakeholder groups would be compared to determine areas of agreement as well as areas of divergence