

Key Insights
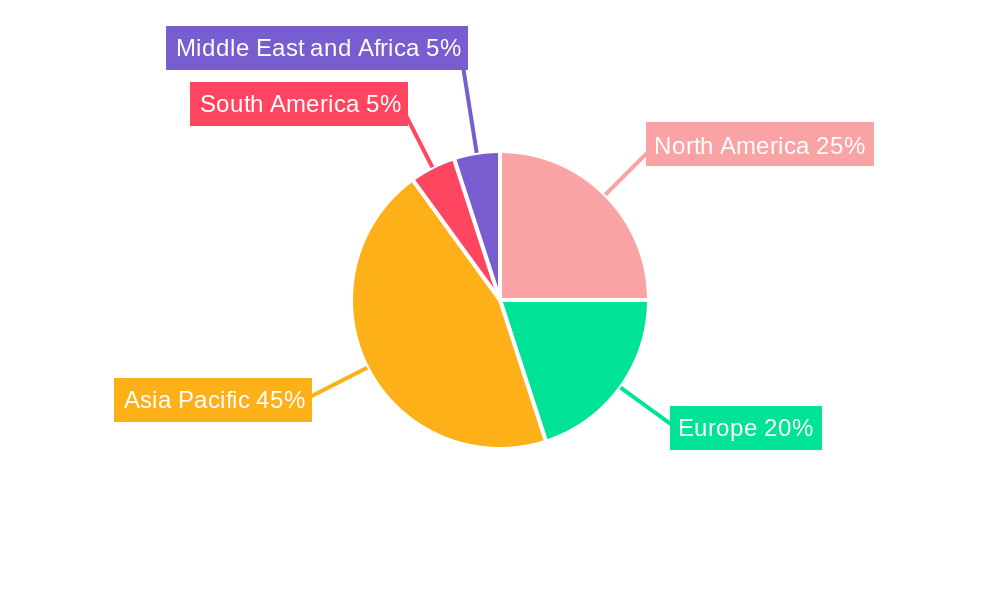
The global chloromethane market, valued at approximately $6.1 billion in 2025, is projected for robust expansion with a compound annual growth rate (CAGR) of 5.2% from 2025 to 2033. This growth is primarily fueled by escalating demand in key sectors including silicones, agricultural chemicals, and pharmaceuticals. The increasing adoption of silicone-based products across diverse industries, alongside the expansion of agriculture and pharmaceutical sectors, significantly drives market growth. Chloromethane's role as a critical chemical intermediate further bolsters its demand. However, stringent environmental regulations and health concerns associated with chloromethane present notable growth restraints. Industry players are actively investing in research and development for sustainable alternatives and process optimization. Geographically, the Asia Pacific region, led by China and India, is anticipated to experience the most substantial growth, driven by expanding manufacturing capabilities and rising disposable incomes. North America and Europe will see sustained growth, supported by mature industries and ongoing technological innovation.
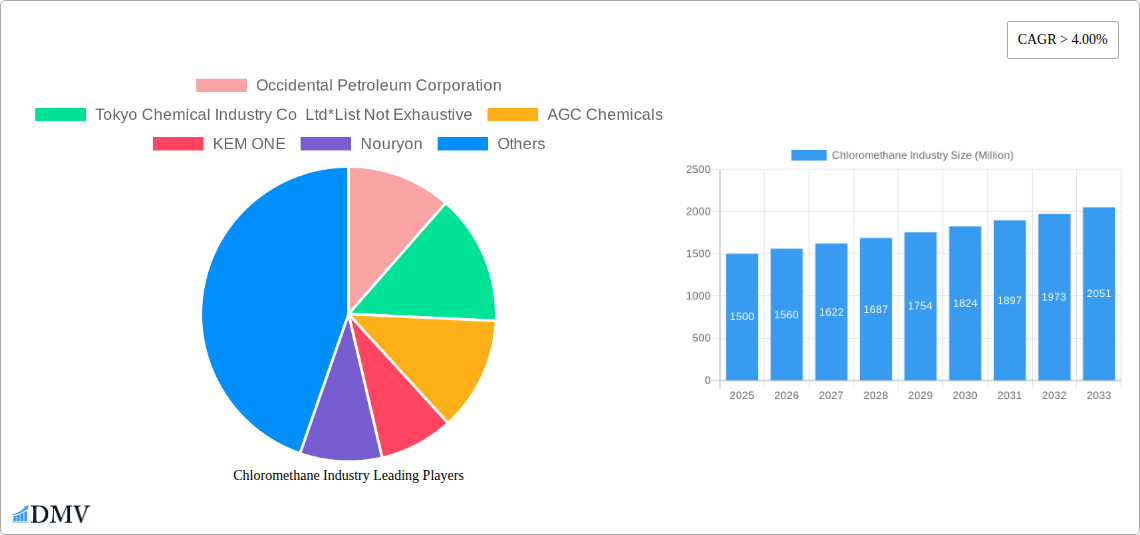
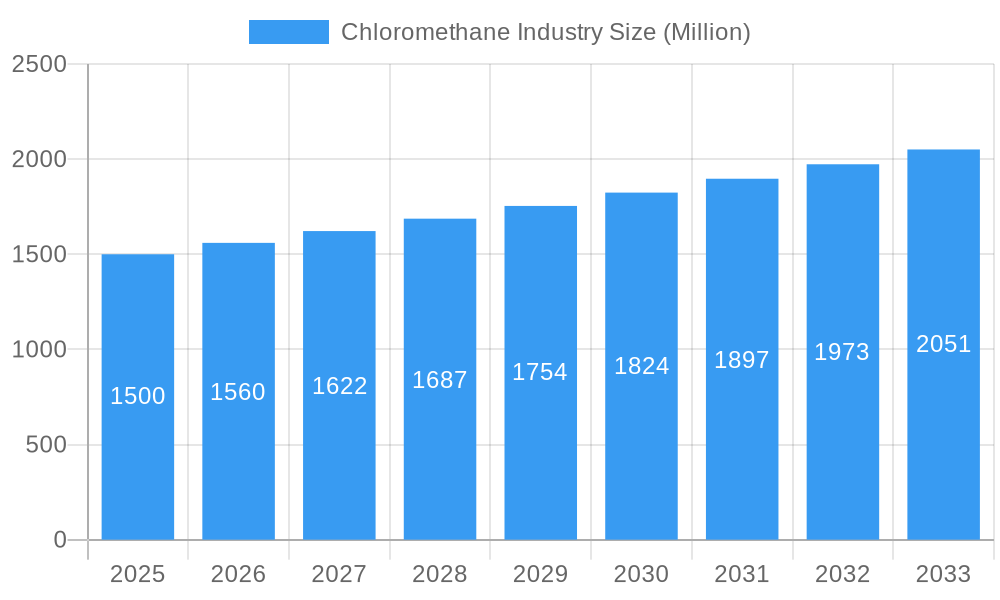
Chloromethane Industry Market Size (In Billion)
The competitive landscape features a mix of established global corporations and regional manufacturers. Leading entities such as Occidental Petroleum Corporation, Tokyo Chemical Industry Co. Ltd., and AGC Chemicals are employing strategic alliances, mergers, and acquisitions to enhance their market positions. Innovation in production technologies and geographical market expansion are key strategies for these companies. The market is segmented by product type—including methylene chloride, methyl chloride, carbon tetrachloride, and chloroform—and by application, offering detailed insights into segment-specific market dynamics. Future growth hinges on the successful development of sustainable production methods and the identification of novel applications that address environmental considerations. The forecast period of 2025-2033 indicates continued market growth, influenced by regulatory shifts and technological advancements.
Chloromethane Industry Company Market Share
Chloromethane Market Analysis: Trends, Drivers & Forecast (2025-2033)
This comprehensive report delivers in-depth analysis of the chloromethane industry, providing critical insights for stakeholders navigating this dynamic market. With a primary focus on the 2025 market size and a forecast extending to 2033, this report details market trends, growth catalysts, and future opportunities. The study offers granular analysis across product types (Methylene Chloride, Methyl Chloride, Carbon Tetrachloride, Chloroform) and applications (Silicones, Agricultural Chemicals, Pharmaceutical, Chemical Intermediate, Personal Care, Other Applications), providing a thorough understanding of this complex market.
Chloromethane Industry Market Composition & Trends
This section delves into the competitive landscape of the chloromethane market, evaluating market concentration, innovation drivers, regulatory influences, and the impact of substitute products. We analyze end-user profiles and major M&A activities, providing insights into market share distribution and deal values. The report analyzes the market's concentration level, identifying key players and their respective market shares. Innovation is examined through the lens of R&D investments, new product launches, and technological advancements. The influence of regulatory landscapes, including environmental regulations and safety standards, is thoroughly assessed. The impact of substitute products and their competitive threat is also analyzed. The report also profiles key end-users across various sectors, while providing a detailed overview of recent mergers and acquisitions, including deal values and their implications for market dynamics. Key data points include:
- Market Share Distribution: xx% held by top 5 players in 2024.
- M&A Deal Values: Total value of M&A activities between 2019 and 2024 estimated at USD xx Billion.
- Key Market Segments by Application: Silicones (xx Million), Agriculture Chemicals (xx Million), Pharmaceutical (xx Million), etc. (2024 figures).
Chloromethane Industry Industry Evolution
This section traces the evolution of the chloromethane industry, analyzing market growth trajectories from 2019 to 2024 and projecting growth until 2033. The report will examine technological advancements, including process innovations and efficiency improvements, and analyze how shifting consumer demands have impacted market dynamics. Data points like compound annual growth rates (CAGR) and adoption rates for new technologies are presented. The analysis will also explore the historical context, identifying key milestones and pivotal moments that have shaped the industry's trajectory. Finally, this section offers predictions for the future evolution of the market, considering emerging trends and potential disruptions. Specific data points like growth rates for each segment and adoption metrics for key technologies will be detailed in the report.
Leading Regions, Countries, or Segments in Chloromethane Industry
This section pinpoints the dominant regions, countries, and segments within the chloromethane industry. A detailed analysis of market leadership across product types (Methylene Chloride, Methyl Chloride, Carbon Tetrachloride, Chloroform) and applications (Silicones, Agriculture Chemicals, Pharmaceutical, Chemical Intermediate, Personal Care, Other Applications) will be provided. The drivers of regional dominance, such as investment trends and regulatory environments, will be explored.
- Key Drivers:
- Investment Trends: Significant investments in capacity expansion in [Region/Country] (USD xx Million).
- Regulatory Support: Favorable regulatory policies in [Region/Country] supporting industry growth.
- Dominance Factors: Analysis of factors like cost of production, availability of raw materials, proximity to key markets, and government incentives.
Chloromethane Industry Product Innovations
This section showcases recent product innovations, detailing their applications and performance metrics. The analysis will highlight unique selling propositions (USPs) and assess the impact of technological advancements on product features and market competitiveness. The discussion will encompass enhancements to existing products, as well as entirely new offerings, while examining the competitive advantage these innovations bring.
Propelling Factors for Chloromethane Industry Growth
This section pinpoints the key growth drivers within the chloromethane industry, focusing on technological advancements, economic factors, and regulatory influences. Specific examples will be provided to illustrate these drivers. The analysis will include the impact of technological advancements (automation, process optimization), economic factors (growing demand from key end-use sectors), and regulatory factors (favorable policies supporting industry growth).
Obstacles in the Chloromethane Industry Market
This section identifies and analyzes the key barriers and restraints affecting the chloromethane market. The impacts of regulatory challenges (environmental regulations, safety concerns), supply chain disruptions (raw material availability, logistics), and competitive pressures (price competition, market saturation) will be quantified and analyzed.
Future Opportunities in Chloromethane Industry
This section highlights emerging opportunities within the chloromethane market, focusing on new markets, technologies, and evolving consumer trends. The analysis will include opportunities in emerging markets, technological advancements (new applications, improved efficiency), and evolving consumer preferences.
Major Players in the Chloromethane Industry Ecosystem
- Occidental Petroleum Corporation
- Tokyo Chemical Industry Co Ltd
- AGC Chemicals
- KEM ONE
- Nouryon
- Merck KGaA
- Tokuyama Corporation
- The Sanmar Group
- Gujarat Alkalies and Chemical Limited
- Shin-Etsu Chemical Co Ltd
- Gujarat Fluorochemicals Limited
Key Developments in Chloromethane Industry Industry
- January 2023: Nouryon acquired a Poland-based supplier of specialty agricultural solutions, expanding its product offerings.
- May 2022: AGC Inc. invested USD 0.76 Billion to increase chlor-alkali production capacity in the Indochina Peninsula.
Strategic Chloromethane Industry Market Forecast
This section summarizes the key growth catalysts and provides a forecast for the chloromethane market, highlighting future opportunities and market potential. The discussion will encompass the expected growth trajectory, key market segments, and the overall outlook for the chloromethane industry, considering the factors analyzed in previous sections. The forecast will account for various factors, including technological advancements, economic growth, and regulatory changes.
Chloromethane Industry Segmentation
-
1. Product Type
- 1.1. Methylene Chloride
- 1.2. Methyl Chloride
- 1.3. Carbon Tetrachloride
- 1.4. Chloroform
-
2. Application
- 2.1. Silicones
- 2.2. Agriculture Chemicals
- 2.3. Pharmaceutical
- 2.4. Chemical Intermediate
- 2.5. Personal Care
- 2.6. Other Applications
Chloromethane Industry Segmentation By Geography
-
1. Asia Pacific
- 1.1. China
- 1.2. India
- 1.3. Japan
- 1.4. South Korea
- 1.5. Rest of Asia Pacific
-
2. North America
- 2.1. United States
- 2.2. Canada
- 2.3. Mexico
-
3. Europe
- 3.1. Germany
- 3.2. United Kingdom
- 3.3. Italy
- 3.4. France
- 3.5. Rest of Europe
-
4. South America
- 4.1. Brazil
- 4.2. Argentina
- 4.3. Rest of South America
-
5. Middle East and Africa
- 5.1. Saudi Arabia
- 5.2. South Africa
- 5.3. Rest of Middle East and Africa
Chloromethane Industry Regional Market Share
Geographic Coverage of Chloromethane Industry
Chloromethane Industry REPORT HIGHLIGHTS
| Aspects | Details |
|---|---|
| Study Period | 2020-2034 |
| Base Year | 2025 |
| Estimated Year | 2026 |
| Forecast Period | 2026-2034 |
| Historical Period | 2020-2025 |
| Growth Rate | CAGR of 5.2% from 2020-2034 |
| Segmentation |
|
Table of Contents
- 1. Introduction
- 1.1. Research Scope
- 1.2. Market Segmentation
- 1.3. Research Objective
- 1.4. Definitions and Assumptions
- 2. Executive Summary
- 2.1. Market Snapshot
- 3. Market Dynamics
- 3.1. Market Drivers
- 3.2. Market Restrains
- 3.3. Market Trends
- 3.4. Market Opportunities
- 4. Market Factor Analysis
- 4.1. Porters Five Forces
- 4.1.1. Bargaining Power of Suppliers
- 4.1.2. Bargaining Power of Buyers
- 4.1.3. Threat of New Entrants
- 4.1.4. Threat of Substitutes
- 4.1.5. Competitive Rivalry
- 4.2. PESTEL analysis
- 4.3. BCG Analysis
- 4.3.1. Stars (High Growth, High Market Share)
- 4.3.2. Cash Cows (Low Growth, High Market Share)
- 4.3.3. Question Mark (High Growth, Low Market Share)
- 4.3.4. Dogs (Low Growth, Low Market Share)
- 4.4. Ansoff Matrix Analysis
- 4.5. Supply Chain Analysis
- 4.6. Regulatory Landscape
- 4.7. Current Market Potential and Opportunity Assessment (TAM–SAM–SOM Framework)
- 4.8. DMV Analyst Note
- 4.1. Porters Five Forces
- 5. Market Analysis, Insights and Forecast 2021-2033
- 5.1. Market Analysis, Insights and Forecast - by Product Type
- 5.1.1. Methylene Chloride
- 5.1.2. Methyl Chloride
- 5.1.3. Carbon Tetrachloride
- 5.1.4. Chloroform
- 5.2. Market Analysis, Insights and Forecast - by Application
- 5.2.1. Silicones
- 5.2.2. Agriculture Chemicals
- 5.2.3. Pharmaceutical
- 5.2.4. Chemical Intermediate
- 5.2.5. Personal Care
- 5.2.6. Other Applications
- 5.3. Market Analysis, Insights and Forecast - by Region
- 5.3.1. Asia Pacific
- 5.3.2. North America
- 5.3.3. Europe
- 5.3.4. South America
- 5.3.5. Middle East and Africa
- 5.1. Market Analysis, Insights and Forecast - by Product Type
- 6. Global Chloromethane Industry Analysis, Insights and Forecast, 2021-2033
- 6.1. Market Analysis, Insights and Forecast - by Product Type
- 6.1.1. Methylene Chloride
- 6.1.2. Methyl Chloride
- 6.1.3. Carbon Tetrachloride
- 6.1.4. Chloroform
- 6.2. Market Analysis, Insights and Forecast - by Application
- 6.2.1. Silicones
- 6.2.2. Agriculture Chemicals
- 6.2.3. Pharmaceutical
- 6.2.4. Chemical Intermediate
- 6.2.5. Personal Care
- 6.2.6. Other Applications
- 6.1. Market Analysis, Insights and Forecast - by Product Type
- 7. Asia Pacific Chloromethane Industry Analysis, Insights and Forecast, 2020-2032
- 7.1. Market Analysis, Insights and Forecast - by Product Type
- 7.1.1. Methylene Chloride
- 7.1.2. Methyl Chloride
- 7.1.3. Carbon Tetrachloride
- 7.1.4. Chloroform
- 7.2. Market Analysis, Insights and Forecast - by Application
- 7.2.1. Silicones
- 7.2.2. Agriculture Chemicals
- 7.2.3. Pharmaceutical
- 7.2.4. Chemical Intermediate
- 7.2.5. Personal Care
- 7.2.6. Other Applications
- 7.1. Market Analysis, Insights and Forecast - by Product Type
- 8. North America Chloromethane Industry Analysis, Insights and Forecast, 2020-2032
- 8.1. Market Analysis, Insights and Forecast - by Product Type
- 8.1.1. Methylene Chloride
- 8.1.2. Methyl Chloride
- 8.1.3. Carbon Tetrachloride
- 8.1.4. Chloroform
- 8.2. Market Analysis, Insights and Forecast - by Application
- 8.2.1. Silicones
- 8.2.2. Agriculture Chemicals
- 8.2.3. Pharmaceutical
- 8.2.4. Chemical Intermediate
- 8.2.5. Personal Care
- 8.2.6. Other Applications
- 8.1. Market Analysis, Insights and Forecast - by Product Type
- 9. Europe Chloromethane Industry Analysis, Insights and Forecast, 2020-2032
- 9.1. Market Analysis, Insights and Forecast - by Product Type
- 9.1.1. Methylene Chloride
- 9.1.2. Methyl Chloride
- 9.1.3. Carbon Tetrachloride
- 9.1.4. Chloroform
- 9.2. Market Analysis, Insights and Forecast - by Application
- 9.2.1. Silicones
- 9.2.2. Agriculture Chemicals
- 9.2.3. Pharmaceutical
- 9.2.4. Chemical Intermediate
- 9.2.5. Personal Care
- 9.2.6. Other Applications
- 9.1. Market Analysis, Insights and Forecast - by Product Type
- 10. South America Chloromethane Industry Analysis, Insights and Forecast, 2020-2032
- 10.1. Market Analysis, Insights and Forecast - by Product Type
- 10.1.1. Methylene Chloride
- 10.1.2. Methyl Chloride
- 10.1.3. Carbon Tetrachloride
- 10.1.4. Chloroform
- 10.2. Market Analysis, Insights and Forecast - by Application
- 10.2.1. Silicones
- 10.2.2. Agriculture Chemicals
- 10.2.3. Pharmaceutical
- 10.2.4. Chemical Intermediate
- 10.2.5. Personal Care
- 10.2.6. Other Applications
- 10.1. Market Analysis, Insights and Forecast - by Product Type
- 11. Middle East and Africa Chloromethane Industry Analysis, Insights and Forecast, 2020-2032
- 11.1. Market Analysis, Insights and Forecast - by Product Type
- 11.1.1. Methylene Chloride
- 11.1.2. Methyl Chloride
- 11.1.3. Carbon Tetrachloride
- 11.1.4. Chloroform
- 11.2. Market Analysis, Insights and Forecast - by Application
- 11.2.1. Silicones
- 11.2.2. Agriculture Chemicals
- 11.2.3. Pharmaceutical
- 11.2.4. Chemical Intermediate
- 11.2.5. Personal Care
- 11.2.6. Other Applications
- 11.1. Market Analysis, Insights and Forecast - by Product Type
- 12. Competitive Analysis
- 12.1. Company Profiles
- 12.1.1 Occidental Petroleum Corporation
- 12.1.1.1. Company Overview
- 12.1.1.2. Products
- 12.1.1.3. Company Financials
- 12.1.1.4. SWOT Analysis
- 12.1.2 Tokyo Chemical Industry Co Ltd*List Not Exhaustive
- 12.1.2.1. Company Overview
- 12.1.2.2. Products
- 12.1.2.3. Company Financials
- 12.1.2.4. SWOT Analysis
- 12.1.3 AGC Chemicals
- 12.1.3.1. Company Overview
- 12.1.3.2. Products
- 12.1.3.3. Company Financials
- 12.1.3.4. SWOT Analysis
- 12.1.4 KEM ONE
- 12.1.4.1. Company Overview
- 12.1.4.2. Products
- 12.1.4.3. Company Financials
- 12.1.4.4. SWOT Analysis
- 12.1.5 Nouryon
- 12.1.5.1. Company Overview
- 12.1.5.2. Products
- 12.1.5.3. Company Financials
- 12.1.5.4. SWOT Analysis
- 12.1.6 Merck KGaA
- 12.1.6.1. Company Overview
- 12.1.6.2. Products
- 12.1.6.3. Company Financials
- 12.1.6.4. SWOT Analysis
- 12.1.7 Tokuyama Corporation
- 12.1.7.1. Company Overview
- 12.1.7.2. Products
- 12.1.7.3. Company Financials
- 12.1.7.4. SWOT Analysis
- 12.1.8 The Sanmar Group
- 12.1.8.1. Company Overview
- 12.1.8.2. Products
- 12.1.8.3. Company Financials
- 12.1.8.4. SWOT Analysis
- 12.1.9 Gujarat Alkalies and Chemical Limited
- 12.1.9.1. Company Overview
- 12.1.9.2. Products
- 12.1.9.3. Company Financials
- 12.1.9.4. SWOT Analysis
- 12.1.10 Shin-Etsu Chemical Co Ltd
- 12.1.10.1. Company Overview
- 12.1.10.2. Products
- 12.1.10.3. Company Financials
- 12.1.10.4. SWOT Analysis
- 12.1.11 Gujarat Fluorochemicals Limited
- 12.1.11.1. Company Overview
- 12.1.11.2. Products
- 12.1.11.3. Company Financials
- 12.1.11.4. SWOT Analysis
- 12.1.1 Occidental Petroleum Corporation
- 12.2. Market Entropy
- 12.2.1 Company's Key Areas Served
- 12.2.2 Recent Developments
- 12.3. Company Market Share Analysis 2025
- 12.3.1 Top 5 Companies Market Share Analysis
- 12.3.2 Top 3 Companies Market Share Analysis
- 12.4. List of Potential Customers
- 13. Research Methodology
List of Figures
- Figure 1: Global Chloromethane Industry Revenue Breakdown (billion, %) by Region 2025 & 2033
- Figure 2: Asia Pacific Chloromethane Industry Revenue (billion), by Product Type 2025 & 2033
- Figure 3: Asia Pacific Chloromethane Industry Revenue Share (%), by Product Type 2025 & 2033
- Figure 4: Asia Pacific Chloromethane Industry Revenue (billion), by Application 2025 & 2033
- Figure 5: Asia Pacific Chloromethane Industry Revenue Share (%), by Application 2025 & 2033
- Figure 6: Asia Pacific Chloromethane Industry Revenue (billion), by Country 2025 & 2033
- Figure 7: Asia Pacific Chloromethane Industry Revenue Share (%), by Country 2025 & 2033
- Figure 8: North America Chloromethane Industry Revenue (billion), by Product Type 2025 & 2033
- Figure 9: North America Chloromethane Industry Revenue Share (%), by Product Type 2025 & 2033
- Figure 10: North America Chloromethane Industry Revenue (billion), by Application 2025 & 2033
- Figure 11: North America Chloromethane Industry Revenue Share (%), by Application 2025 & 2033
- Figure 12: North America Chloromethane Industry Revenue (billion), by Country 2025 & 2033
- Figure 13: North America Chloromethane Industry Revenue Share (%), by Country 2025 & 2033
- Figure 14: Europe Chloromethane Industry Revenue (billion), by Product Type 2025 & 2033
- Figure 15: Europe Chloromethane Industry Revenue Share (%), by Product Type 2025 & 2033
- Figure 16: Europe Chloromethane Industry Revenue (billion), by Application 2025 & 2033
- Figure 17: Europe Chloromethane Industry Revenue Share (%), by Application 2025 & 2033
- Figure 18: Europe Chloromethane Industry Revenue (billion), by Country 2025 & 2033
- Figure 19: Europe Chloromethane Industry Revenue Share (%), by Country 2025 & 2033
- Figure 20: South America Chloromethane Industry Revenue (billion), by Product Type 2025 & 2033
- Figure 21: South America Chloromethane Industry Revenue Share (%), by Product Type 2025 & 2033
- Figure 22: South America Chloromethane Industry Revenue (billion), by Application 2025 & 2033
- Figure 23: South America Chloromethane Industry Revenue Share (%), by Application 2025 & 2033
- Figure 24: South America Chloromethane Industry Revenue (billion), by Country 2025 & 2033
- Figure 25: South America Chloromethane Industry Revenue Share (%), by Country 2025 & 2033
- Figure 26: Middle East and Africa Chloromethane Industry Revenue (billion), by Product Type 2025 & 2033
- Figure 27: Middle East and Africa Chloromethane Industry Revenue Share (%), by Product Type 2025 & 2033
- Figure 28: Middle East and Africa Chloromethane Industry Revenue (billion), by Application 2025 & 2033
- Figure 29: Middle East and Africa Chloromethane Industry Revenue Share (%), by Application 2025 & 2033
- Figure 30: Middle East and Africa Chloromethane Industry Revenue (billion), by Country 2025 & 2033
- Figure 31: Middle East and Africa Chloromethane Industry Revenue Share (%), by Country 2025 & 2033
List of Tables
- Table 1: Global Chloromethane Industry Revenue billion Forecast, by Product Type 2020 & 2033
- Table 2: Global Chloromethane Industry Revenue billion Forecast, by Application 2020 & 2033
- Table 3: Global Chloromethane Industry Revenue billion Forecast, by Region 2020 & 2033
- Table 4: Global Chloromethane Industry Revenue billion Forecast, by Product Type 2020 & 2033
- Table 5: Global Chloromethane Industry Revenue billion Forecast, by Application 2020 & 2033
- Table 6: Global Chloromethane Industry Revenue billion Forecast, by Country 2020 & 2033
- Table 7: China Chloromethane Industry Revenue (billion) Forecast, by Application 2020 & 2033
- Table 8: India Chloromethane Industry Revenue (billion) Forecast, by Application 2020 & 2033
- Table 9: Japan Chloromethane Industry Revenue (billion) Forecast, by Application 2020 & 2033
- Table 10: South Korea Chloromethane Industry Revenue (billion) Forecast, by Application 2020 & 2033
- Table 11: Rest of Asia Pacific Chloromethane Industry Revenue (billion) Forecast, by Application 2020 & 2033
- Table 12: Global Chloromethane Industry Revenue billion Forecast, by Product Type 2020 & 2033
- Table 13: Global Chloromethane Industry Revenue billion Forecast, by Application 2020 & 2033
- Table 14: Global Chloromethane Industry Revenue billion Forecast, by Country 2020 & 2033
- Table 15: United States Chloromethane Industry Revenue (billion) Forecast, by Application 2020 & 2033
- Table 16: Canada Chloromethane Industry Revenue (billion) Forecast, by Application 2020 & 2033
- Table 17: Mexico Chloromethane Industry Revenue (billion) Forecast, by Application 2020 & 2033
- Table 18: Global Chloromethane Industry Revenue billion Forecast, by Product Type 2020 & 2033
- Table 19: Global Chloromethane Industry Revenue billion Forecast, by Application 2020 & 2033
- Table 20: Global Chloromethane Industry Revenue billion Forecast, by Country 2020 & 2033
- Table 21: Germany Chloromethane Industry Revenue (billion) Forecast, by Application 2020 & 2033
- Table 22: United Kingdom Chloromethane Industry Revenue (billion) Forecast, by Application 2020 & 2033
- Table 23: Italy Chloromethane Industry Revenue (billion) Forecast, by Application 2020 & 2033
- Table 24: France Chloromethane Industry Revenue (billion) Forecast, by Application 2020 & 2033
- Table 25: Rest of Europe Chloromethane Industry Revenue (billion) Forecast, by Application 2020 & 2033
- Table 26: Global Chloromethane Industry Revenue billion Forecast, by Product Type 2020 & 2033
- Table 27: Global Chloromethane Industry Revenue billion Forecast, by Application 2020 & 2033
- Table 28: Global Chloromethane Industry Revenue billion Forecast, by Country 2020 & 2033
- Table 29: Brazil Chloromethane Industry Revenue (billion) Forecast, by Application 2020 & 2033
- Table 30: Argentina Chloromethane Industry Revenue (billion) Forecast, by Application 2020 & 2033
- Table 31: Rest of South America Chloromethane Industry Revenue (billion) Forecast, by Application 2020 & 2033
- Table 32: Global Chloromethane Industry Revenue billion Forecast, by Product Type 2020 & 2033
- Table 33: Global Chloromethane Industry Revenue billion Forecast, by Application 2020 & 2033
- Table 34: Global Chloromethane Industry Revenue billion Forecast, by Country 2020 & 2033
- Table 35: Saudi Arabia Chloromethane Industry Revenue (billion) Forecast, by Application 2020 & 2033
- Table 36: South Africa Chloromethane Industry Revenue (billion) Forecast, by Application 2020 & 2033
- Table 37: Rest of Middle East and Africa Chloromethane Industry Revenue (billion) Forecast, by Application 2020 & 2033
Frequently Asked Questions
1. What is the projected Compound Annual Growth Rate (CAGR) of the Chloromethane Industry?
The projected CAGR is approximately 5.2%.
2. Which companies are prominent players in the Chloromethane Industry?
Key companies in the market include Occidental Petroleum Corporation, Tokyo Chemical Industry Co Ltd*List Not Exhaustive, AGC Chemicals, KEM ONE, Nouryon, Merck KGaA, Tokuyama Corporation, The Sanmar Group, Gujarat Alkalies and Chemical Limited, Shin-Etsu Chemical Co Ltd, Gujarat Fluorochemicals Limited.
3. What are the main segments of the Chloromethane Industry?
The market segments include Product Type, Application.
4. Can you provide details about the market size?
The market size is estimated to be USD 6.1 billion as of 2022.
5. What are some drivers contributing to market growth?
Increasing Usage of Silicone in Various End-user Industries; Growing Demand from the Pharmaceutical and Personal Care Industries.
6. What are the notable trends driving market growth?
Increasing Usage of Silicone in Various End-user Industries.
7. Are there any restraints impacting market growth?
Stringent Regulations on Chloromethane; Negative Impact of the COVID-19 Pandemic.
8. Can you provide examples of recent developments in the market?
January 2023: Nouryon, a global leader in specialty chemicals, announced the acquisition of a Poland-based supplier of chelated micronutrients, foliar, and other specialty agricultural solutions. With this acquisition, the company would be able to expand its services and product offerings for customers in the industry,
9. What pricing options are available for accessing the report?
Pricing options include single-user, multi-user, and enterprise licenses priced at USD 4750, USD 5250, and USD 8750 respectively.
10. Is the market size provided in terms of value or volume?
The market size is provided in terms of value, measured in billion.
11. Are there any specific market keywords associated with the report?
Yes, the market keyword associated with the report is "Chloromethane Industry," which aids in identifying and referencing the specific market segment covered.
12. How do I determine which pricing option suits my needs best?
The pricing options vary based on user requirements and access needs. Individual users may opt for single-user licenses, while businesses requiring broader access may choose multi-user or enterprise licenses for cost-effective access to the report.
13. Are there any additional resources or data provided in the Chloromethane Industry report?
While the report offers comprehensive insights, it's advisable to review the specific contents or supplementary materials provided to ascertain if additional resources or data are available.
14. How can I stay updated on further developments or reports in the Chloromethane Industry?
To stay informed about further developments, trends, and reports in the Chloromethane Industry, consider subscribing to industry newsletters, following relevant companies and organizations, or regularly checking reputable industry news sources and publications.
Methodology
Step 1 - Identification of Relevant Samples Size from Population Database


Step 2 - Approaches for Defining Global Market Size (Value, Volume* & Price*)

Note*: In applicable scenarios
Step 3 - Data Sources
Primary Research
- Web Analytics
- Survey Reports
- Research Institute
- Latest Research Reports
- Opinion Leaders
Secondary Research
- Annual Reports
- White Paper
- Latest Press Release
- Industry Association
- Paid Database
- Investor Presentations

Step 4 - Data Triangulation
Involves using different sources of information in order to increase the validity of a study
These sources are likely to be stakeholders in a program - participants, other researchers, program staff, other community members, and so on.
Then we put all data in single framework & apply various statistical tools to find out the dynamic on the market.
During the analysis stage, feedback from the stakeholder groups would be compared to determine areas of agreement as well as areas of divergence