

Key Insights
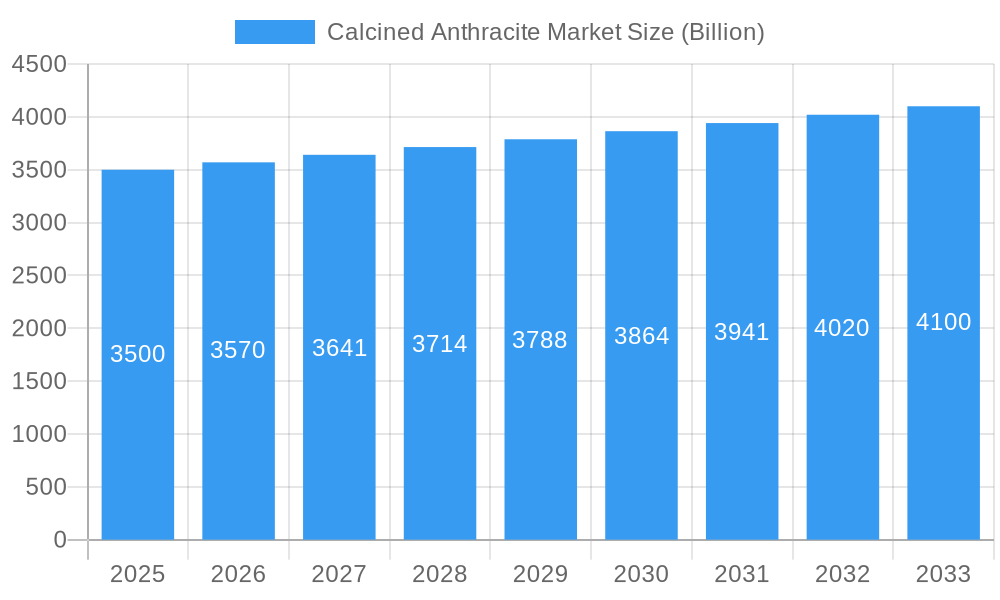
The global calcined anthracite market, valued at $3.5 billion in 2025, is projected to experience steady growth, driven primarily by its increasing application in steelmaking processes, particularly in blast furnaces and basic oxygen furnaces. The market's Compound Annual Growth Rate (CAGR) of 1.9% over the forecast period (2025-2033) reflects a consistent demand fueled by the ongoing expansion of the steel industry, especially in rapidly developing economies within Asia-Pacific. While the electric arc furnace segment is expected to see moderate growth, the continued reliance on traditional steelmaking methods ensures a substantial market for calcined anthracite. Key market segments include gas and electrical calcination types, with the gas calcination method currently dominating due to cost-effectiveness and established infrastructure. Geographic expansion is another significant driver, with growth anticipated across regions like Asia-Pacific and the Middle East, fueled by infrastructural development and industrialization. However, environmental regulations concerning carbon emissions pose a potential restraint, prompting companies to explore more sustainable alternatives and potentially slowing growth in specific regions. Competitive pressures amongst established players like Southern Carbon & Chemical and emerging regional players will also influence the market's trajectory. The increasing adoption of improved energy-efficient calcination techniques could counterbalance some of the environmental concerns and stimulate further market growth.
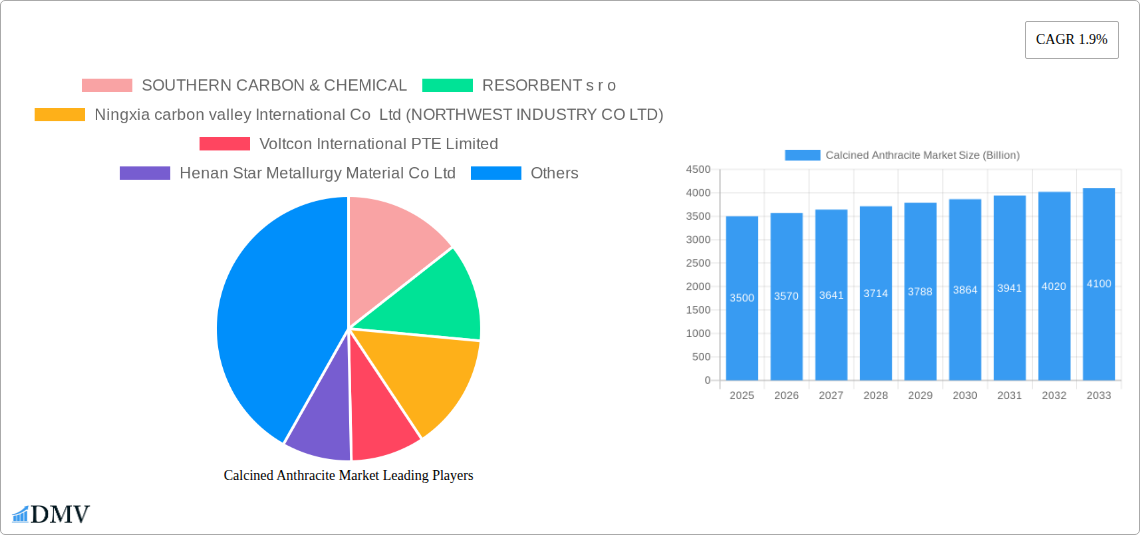
Calcined Anthracite Market Market Size (In Billion)
The consistent demand for calcined anthracite is primarily linked to its crucial role in improving the efficiency and quality of steel production. Its unique properties, including high carbon content and purity, make it an indispensable component in various steelmaking processes. While the market faces challenges from environmental concerns and competitive pressures, ongoing technological advancements and the persistent demand from the steel industry are expected to sustain market growth over the long term. The strategic expansion of manufacturing facilities into high-growth regions, coupled with investments in research and development to improve efficiency and reduce environmental impact, will likely shape the competitive landscape in the coming years. The relatively low CAGR reflects a mature market with established players; however, opportunities exist for companies focused on innovation and sustainable practices.
Calcined Anthracite Market Company Market Share
Calcined Anthracite Market: A Comprehensive Report (2019-2033)
This insightful report provides a detailed analysis of the global Calcined Anthracite market, offering a comprehensive overview of market trends, leading players, and future growth prospects. Valued at $XX Billion in 2025, the market is poised for significant expansion, reaching $XX Billion by 2033, exhibiting a CAGR of XX% during the forecast period (2025-2033). The study covers the historical period (2019-2024), with 2025 serving as the base year. This report is an indispensable resource for stakeholders seeking to understand and capitalize on the opportunities within this dynamic market.
Calcined Anthracite Market Market Composition & Trends
The Calcined Anthracite market is characterized by a moderately concentrated landscape, with key players like SOUTHERN CARBON & CHEMICAL, RESORBENT s r o, and Ningxia carbon valley International Co Ltd (NORTHWEST INDUSTRY CO LTD) holding significant market share. Market concentration is estimated at XX%, with the top 5 players accounting for approximately YY% of the total market revenue in 2025. Innovation is driven by advancements in calcination technologies (Gas and Electrical), focused on enhancing product quality and efficiency. Stringent environmental regulations are increasingly influencing market dynamics, pushing for cleaner production methods. Substitute products, such as petroleum coke and graphite, pose a competitive threat, although Calcined Anthracite retains a strong position due to its superior properties in specific applications. The market witnesses occasional M&A activity, with deal values averaging $XX Billion in the past five years. End-users are primarily concentrated in the steel and metallurgical industries, with significant demand from the Pulverized Coal Injection (PCI) and Basic Oxygen Steel Making (BOS) sectors.
- Market Share Distribution (2025): Top 5 players - YY%, Others - ZZ%
- M&A Deal Value (Avg. 2020-2024): $XX Billion
- Key End-Users: Blast Furnaces, Basic Oxygen Furnaces, Electric Arc Furnaces
Calcined Anthracite Market Industry Evolution
The Calcined Anthracite market has witnessed consistent growth over the past five years, driven by the expanding steel and metallurgical industries globally. The historical period (2019-2024) saw an average annual growth rate of XX%, primarily fueled by increasing demand from emerging economies. Technological advancements, such as the optimization of gas and electrical calcination processes, have significantly improved product quality and reduced production costs. Shifting consumer demands toward high-quality, consistent products are further impacting the market. The adoption of advanced calcination technologies is increasing at a rate of XX% annually, leading to improved energy efficiency and reduced environmental impact. Future growth will be influenced by factors such as infrastructure development in emerging markets, technological innovations, and fluctuating raw material prices. This ongoing evolution is expected to lead to further market expansion, with a projected CAGR of YY% during the forecast period (2025-2033). The increasing adoption of Electric Arc Furnaces (EAFs) is also a significant driver, contributing to a projected XX% increase in demand by 2033.
Leading Regions, Countries, or Segments in Calcined Anthracite Market
The Asia-Pacific region dominates the global Calcined Anthracite market, driven by robust growth in steel production and significant investments in infrastructure development in countries like China and India. Within the calcination type segment, the gas calcination method holds the largest share, owing to its cost-effectiveness and established infrastructure. Pulverized Coal Injection (PCI) in blast furnaces remains the primary application, accounting for the largest segment share.
- Key Drivers in Asia-Pacific:
- High steel production capacity.
- Significant government investments in infrastructure.
- Growing demand from construction and automotive sectors.
- Dominance Factors:
- Abundance of raw materials.
- Lower production costs.
- Established supply chains.
Calcined Anthracite Market Product Innovations
Recent innovations in Calcined Anthracite focus on enhancing product purity, reducing ash content, and improving its reactivity. New calcination processes, coupled with advanced material characterization techniques, are leading to the development of higher-quality products with improved performance metrics, specifically targeted at enhancing efficiency and reducing emissions in steelmaking processes. These innovations offer unique selling propositions through enhanced reactivity, leading to improved fuel efficiency and reduced costs for end-users.
Propelling Factors for Calcined Anthracite Market Growth
The growth of the Calcined Anthracite market is primarily driven by the increasing demand from the steel industry, particularly in emerging economies. Technological advancements in calcination processes leading to improved product quality and reduced costs are also significant contributors. Furthermore, supportive government policies promoting sustainable industrial practices further bolster market growth. The increasing adoption of electric arc furnaces, which utilize Calcined Anthracite, is another key driver of market expansion.
Obstacles in the Calcined Anthracite Market Market
The Calcined Anthracite market faces challenges such as fluctuating raw material prices, which impact production costs. Environmental regulations concerning emissions from calcination plants pose operational hurdles. Intense competition from substitute materials and supply chain disruptions due to geopolitical factors also affect market growth. The overall impact of these factors is estimated to reduce the market growth rate by approximately XX% in the next five years.
Future Opportunities in Calcined Anthracite Market
Future opportunities lie in expanding into new applications beyond steelmaking, such as filter mediums and electrodes. Technological advancements in calcination and the development of specialized grades of Calcined Anthracite for niche applications present significant growth potential. Exploration of new geographical markets, particularly in Africa and Latin America, offers promising avenues for market expansion.
Major Players in the Calcined Anthracite Market Ecosystem
- SOUTHERN CARBON & CHEMICAL
- RESORBENT s r o
- Ningxia carbon valley International Co Ltd (NORTHWEST INDUSTRY CO LTD)
- Voltcon International PTE Limited
- Henan Star Metallurgy Material Co Ltd
- Black Diamond
- JH CARBON
- Kingstone Group
- Aluminium Rheinfelden GmbH
Key Developments in Calcined Anthracite Market Industry
- 2022-Q4: SOUTHERN CARBON & CHEMICAL announced a new investment in a state-of-the-art calcination plant.
- 2023-Q1: RESORBENT s r o launched a new line of high-purity Calcined Anthracite for specialized applications.
- 2024-Q2: A major merger between two key players resulted in a significant increase in market concentration. (Further details unavailable, predicted value XX Billion)
Strategic Calcined Anthracite Market Market Forecast
The Calcined Anthracite market is poised for continued growth, driven by the increasing demand from the steel industry and ongoing technological advancements. Emerging applications and expansion into new markets will contribute significantly to market growth during the forecast period. The market is expected to reach a value of $XX Billion by 2033, creating significant opportunities for both established players and new entrants. The focus on sustainable and environmentally friendly production methods will play a crucial role in shaping the future of the Calcined Anthracite market.
Calcined Anthracite Market Segmentation
-
1. Calcination Type
- 1.1. Gas
- 1.2. Electrical
-
2. Application
- 2.1. Pulverized Coal Injection (Blast furnace)
- 2.2. Basic Oxygen Steel Making (BOS)
- 2.3. Electric Arc Furnace
- 2.4. Others (Electrodes, Filter Medium, etc.,)
Calcined Anthracite Market Segmentation By Geography
-
1. Asia Pacific
- 1.1. China
- 1.2. India
- 1.3. Japan
- 1.4. South Korea
- 1.5. Rest of Asia Pacific
-
2. North America
- 2.1. United States
- 2.2. Canada
- 2.3. Mexico
-
3. Europe
- 3.1. Germany
- 3.2. United Kingdom
- 3.3. Italy
- 3.4. France
- 3.5. Rest of Europe
-
4. South America
- 4.1. Brazil
- 4.2. Argentina
- 4.3. Rest of South America
-
5. Middle East and Africa
- 5.1. Saudi Arabia
- 5.2. South Africa
- 5.3. Rest of Middle East and Africa
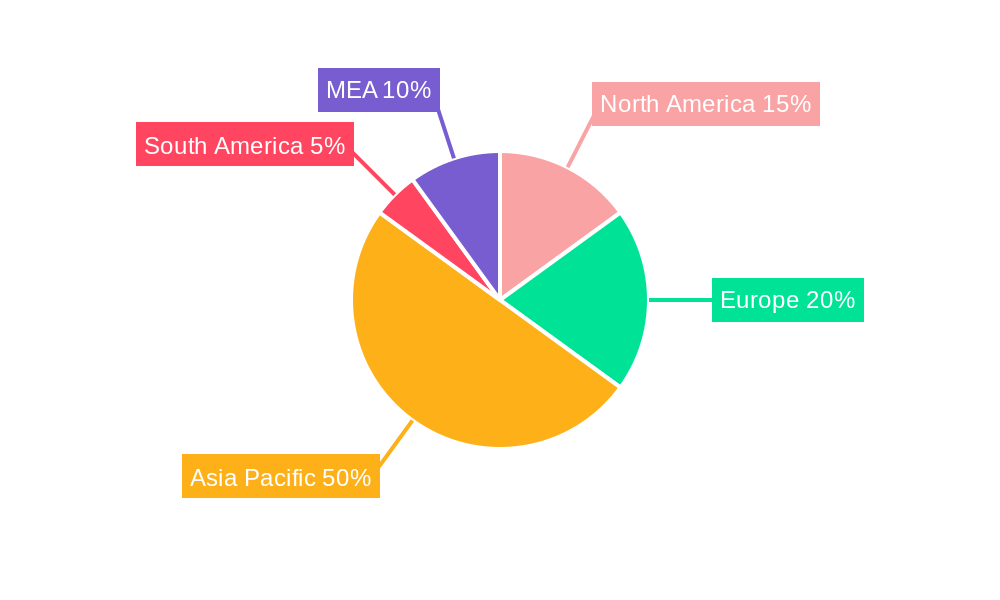
Calcined Anthracite Market Regional Market Share
Geographic Coverage of Calcined Anthracite Market
Calcined Anthracite Market REPORT HIGHLIGHTS
| Aspects | Details |
|---|---|
| Study Period | 2020-2034 |
| Base Year | 2025 |
| Estimated Year | 2026 |
| Forecast Period | 2026-2034 |
| Historical Period | 2020-2025 |
| Growth Rate | CAGR of 1.9% from 2020-2034 |
| Segmentation |
|
Table of Contents
- 1. Introduction
- 1.1. Research Scope
- 1.2. Market Segmentation
- 1.3. Research Objective
- 1.4. Definitions and Assumptions
- 2. Executive Summary
- 2.1. Market Snapshot
- 3. Market Dynamics
- 3.1. Market Drivers
- 3.2. Market Restrains
- 3.3. Market Trends
- 3.4. Market Opportunities
- 4. Market Factor Analysis
- 4.1. Porters Five Forces
- 4.1.1. Bargaining Power of Suppliers
- 4.1.2. Bargaining Power of Buyers
- 4.1.3. Threat of New Entrants
- 4.1.4. Threat of Substitutes
- 4.1.5. Competitive Rivalry
- 4.2. PESTEL analysis
- 4.3. BCG Analysis
- 4.3.1. Stars (High Growth, High Market Share)
- 4.3.2. Cash Cows (Low Growth, High Market Share)
- 4.3.3. Question Mark (High Growth, Low Market Share)
- 4.3.4. Dogs (Low Growth, Low Market Share)
- 4.4. Ansoff Matrix Analysis
- 4.5. Supply Chain Analysis
- 4.6. Regulatory Landscape
- 4.7. Current Market Potential and Opportunity Assessment (TAM–SAM–SOM Framework)
- 4.8. DMV Analyst Note
- 4.1. Porters Five Forces
- 5. Market Analysis, Insights and Forecast 2021-2033
- 5.1. Market Analysis, Insights and Forecast - by Calcination Type
- 5.1.1. Gas
- 5.1.2. Electrical
- 5.2. Market Analysis, Insights and Forecast - by Application
- 5.2.1. Pulverized Coal Injection (Blast furnace)
- 5.2.2. Basic Oxygen Steel Making (BOS)
- 5.2.3. Electric Arc Furnace
- 5.2.4. Others (Electrodes, Filter Medium, etc.,)
- 5.3. Market Analysis, Insights and Forecast - by Region
- 5.3.1. Asia Pacific
- 5.3.2. North America
- 5.3.3. Europe
- 5.3.4. South America
- 5.3.5. Middle East and Africa
- 5.1. Market Analysis, Insights and Forecast - by Calcination Type
- 6. Global Calcined Anthracite Market Analysis, Insights and Forecast, 2021-2033
- 6.1. Market Analysis, Insights and Forecast - by Calcination Type
- 6.1.1. Gas
- 6.1.2. Electrical
- 6.2. Market Analysis, Insights and Forecast - by Application
- 6.2.1. Pulverized Coal Injection (Blast furnace)
- 6.2.2. Basic Oxygen Steel Making (BOS)
- 6.2.3. Electric Arc Furnace
- 6.2.4. Others (Electrodes, Filter Medium, etc.,)
- 6.1. Market Analysis, Insights and Forecast - by Calcination Type
- 7. Asia Pacific Calcined Anthracite Market Analysis, Insights and Forecast, 2020-2032
- 7.1. Market Analysis, Insights and Forecast - by Calcination Type
- 7.1.1. Gas
- 7.1.2. Electrical
- 7.2. Market Analysis, Insights and Forecast - by Application
- 7.2.1. Pulverized Coal Injection (Blast furnace)
- 7.2.2. Basic Oxygen Steel Making (BOS)
- 7.2.3. Electric Arc Furnace
- 7.2.4. Others (Electrodes, Filter Medium, etc.,)
- 7.1. Market Analysis, Insights and Forecast - by Calcination Type
- 8. North America Calcined Anthracite Market Analysis, Insights and Forecast, 2020-2032
- 8.1. Market Analysis, Insights and Forecast - by Calcination Type
- 8.1.1. Gas
- 8.1.2. Electrical
- 8.2. Market Analysis, Insights and Forecast - by Application
- 8.2.1. Pulverized Coal Injection (Blast furnace)
- 8.2.2. Basic Oxygen Steel Making (BOS)
- 8.2.3. Electric Arc Furnace
- 8.2.4. Others (Electrodes, Filter Medium, etc.,)
- 8.1. Market Analysis, Insights and Forecast - by Calcination Type
- 9. Europe Calcined Anthracite Market Analysis, Insights and Forecast, 2020-2032
- 9.1. Market Analysis, Insights and Forecast - by Calcination Type
- 9.1.1. Gas
- 9.1.2. Electrical
- 9.2. Market Analysis, Insights and Forecast - by Application
- 9.2.1. Pulverized Coal Injection (Blast furnace)
- 9.2.2. Basic Oxygen Steel Making (BOS)
- 9.2.3. Electric Arc Furnace
- 9.2.4. Others (Electrodes, Filter Medium, etc.,)
- 9.1. Market Analysis, Insights and Forecast - by Calcination Type
- 10. South America Calcined Anthracite Market Analysis, Insights and Forecast, 2020-2032
- 10.1. Market Analysis, Insights and Forecast - by Calcination Type
- 10.1.1. Gas
- 10.1.2. Electrical
- 10.2. Market Analysis, Insights and Forecast - by Application
- 10.2.1. Pulverized Coal Injection (Blast furnace)
- 10.2.2. Basic Oxygen Steel Making (BOS)
- 10.2.3. Electric Arc Furnace
- 10.2.4. Others (Electrodes, Filter Medium, etc.,)
- 10.1. Market Analysis, Insights and Forecast - by Calcination Type
- 11. Middle East and Africa Calcined Anthracite Market Analysis, Insights and Forecast, 2020-2032
- 11.1. Market Analysis, Insights and Forecast - by Calcination Type
- 11.1.1. Gas
- 11.1.2. Electrical
- 11.2. Market Analysis, Insights and Forecast - by Application
- 11.2.1. Pulverized Coal Injection (Blast furnace)
- 11.2.2. Basic Oxygen Steel Making (BOS)
- 11.2.3. Electric Arc Furnace
- 11.2.4. Others (Electrodes, Filter Medium, etc.,)
- 11.1. Market Analysis, Insights and Forecast - by Calcination Type
- 12. Competitive Analysis
- 12.1. Company Profiles
- 12.1.1 SOUTHERN CARBON & CHEMICAL
- 12.1.1.1. Company Overview
- 12.1.1.2. Products
- 12.1.1.3. Company Financials
- 12.1.1.4. SWOT Analysis
- 12.1.2 RESORBENT s r o
- 12.1.2.1. Company Overview
- 12.1.2.2. Products
- 12.1.2.3. Company Financials
- 12.1.2.4. SWOT Analysis
- 12.1.3 Ningxia carbon valley International Co Ltd (NORTHWEST INDUSTRY CO LTD)
- 12.1.3.1. Company Overview
- 12.1.3.2. Products
- 12.1.3.3. Company Financials
- 12.1.3.4. SWOT Analysis
- 12.1.4 Voltcon International PTE Limited
- 12.1.4.1. Company Overview
- 12.1.4.2. Products
- 12.1.4.3. Company Financials
- 12.1.4.4. SWOT Analysis
- 12.1.5 Henan Star Metallurgy Material Co Ltd
- 12.1.5.1. Company Overview
- 12.1.5.2. Products
- 12.1.5.3. Company Financials
- 12.1.5.4. SWOT Analysis
- 12.1.6 Black Diamond
- 12.1.6.1. Company Overview
- 12.1.6.2. Products
- 12.1.6.3. Company Financials
- 12.1.6.4. SWOT Analysis
- 12.1.7 JH CARBON
- 12.1.7.1. Company Overview
- 12.1.7.2. Products
- 12.1.7.3. Company Financials
- 12.1.7.4. SWOT Analysis
- 12.1.8 Kingstone Group
- 12.1.8.1. Company Overview
- 12.1.8.2. Products
- 12.1.8.3. Company Financials
- 12.1.8.4. SWOT Analysis
- 12.1.9 Aluminium Rheinfelden GmbH
- 12.1.9.1. Company Overview
- 12.1.9.2. Products
- 12.1.9.3. Company Financials
- 12.1.9.4. SWOT Analysis
- 12.1.1 SOUTHERN CARBON & CHEMICAL
- 12.2. Market Entropy
- 12.2.1 Company's Key Areas Served
- 12.2.2 Recent Developments
- 12.3. Company Market Share Analysis 2025
- 12.3.1 Top 5 Companies Market Share Analysis
- 12.3.2 Top 3 Companies Market Share Analysis
- 12.4. List of Potential Customers
- 13. Research Methodology
List of Figures
- Figure 1: Global Calcined Anthracite Market Revenue Breakdown (Billion, %) by Region 2025 & 2033
- Figure 2: Global Calcined Anthracite Market Volume Breakdown (K Tons, %) by Region 2025 & 2033
- Figure 3: Asia Pacific Calcined Anthracite Market Revenue (Billion), by Calcination Type 2025 & 2033
- Figure 4: Asia Pacific Calcined Anthracite Market Volume (K Tons), by Calcination Type 2025 & 2033
- Figure 5: Asia Pacific Calcined Anthracite Market Revenue Share (%), by Calcination Type 2025 & 2033
- Figure 6: Asia Pacific Calcined Anthracite Market Volume Share (%), by Calcination Type 2025 & 2033
- Figure 7: Asia Pacific Calcined Anthracite Market Revenue (Billion), by Application 2025 & 2033
- Figure 8: Asia Pacific Calcined Anthracite Market Volume (K Tons), by Application 2025 & 2033
- Figure 9: Asia Pacific Calcined Anthracite Market Revenue Share (%), by Application 2025 & 2033
- Figure 10: Asia Pacific Calcined Anthracite Market Volume Share (%), by Application 2025 & 2033
- Figure 11: Asia Pacific Calcined Anthracite Market Revenue (Billion), by Country 2025 & 2033
- Figure 12: Asia Pacific Calcined Anthracite Market Volume (K Tons), by Country 2025 & 2033
- Figure 13: Asia Pacific Calcined Anthracite Market Revenue Share (%), by Country 2025 & 2033
- Figure 14: Asia Pacific Calcined Anthracite Market Volume Share (%), by Country 2025 & 2033
- Figure 15: North America Calcined Anthracite Market Revenue (Billion), by Calcination Type 2025 & 2033
- Figure 16: North America Calcined Anthracite Market Volume (K Tons), by Calcination Type 2025 & 2033
- Figure 17: North America Calcined Anthracite Market Revenue Share (%), by Calcination Type 2025 & 2033
- Figure 18: North America Calcined Anthracite Market Volume Share (%), by Calcination Type 2025 & 2033
- Figure 19: North America Calcined Anthracite Market Revenue (Billion), by Application 2025 & 2033
- Figure 20: North America Calcined Anthracite Market Volume (K Tons), by Application 2025 & 2033
- Figure 21: North America Calcined Anthracite Market Revenue Share (%), by Application 2025 & 2033
- Figure 22: North America Calcined Anthracite Market Volume Share (%), by Application 2025 & 2033
- Figure 23: North America Calcined Anthracite Market Revenue (Billion), by Country 2025 & 2033
- Figure 24: North America Calcined Anthracite Market Volume (K Tons), by Country 2025 & 2033
- Figure 25: North America Calcined Anthracite Market Revenue Share (%), by Country 2025 & 2033
- Figure 26: North America Calcined Anthracite Market Volume Share (%), by Country 2025 & 2033
- Figure 27: Europe Calcined Anthracite Market Revenue (Billion), by Calcination Type 2025 & 2033
- Figure 28: Europe Calcined Anthracite Market Volume (K Tons), by Calcination Type 2025 & 2033
- Figure 29: Europe Calcined Anthracite Market Revenue Share (%), by Calcination Type 2025 & 2033
- Figure 30: Europe Calcined Anthracite Market Volume Share (%), by Calcination Type 2025 & 2033
- Figure 31: Europe Calcined Anthracite Market Revenue (Billion), by Application 2025 & 2033
- Figure 32: Europe Calcined Anthracite Market Volume (K Tons), by Application 2025 & 2033
- Figure 33: Europe Calcined Anthracite Market Revenue Share (%), by Application 2025 & 2033
- Figure 34: Europe Calcined Anthracite Market Volume Share (%), by Application 2025 & 2033
- Figure 35: Europe Calcined Anthracite Market Revenue (Billion), by Country 2025 & 2033
- Figure 36: Europe Calcined Anthracite Market Volume (K Tons), by Country 2025 & 2033
- Figure 37: Europe Calcined Anthracite Market Revenue Share (%), by Country 2025 & 2033
- Figure 38: Europe Calcined Anthracite Market Volume Share (%), by Country 2025 & 2033
- Figure 39: South America Calcined Anthracite Market Revenue (Billion), by Calcination Type 2025 & 2033
- Figure 40: South America Calcined Anthracite Market Volume (K Tons), by Calcination Type 2025 & 2033
- Figure 41: South America Calcined Anthracite Market Revenue Share (%), by Calcination Type 2025 & 2033
- Figure 42: South America Calcined Anthracite Market Volume Share (%), by Calcination Type 2025 & 2033
- Figure 43: South America Calcined Anthracite Market Revenue (Billion), by Application 2025 & 2033
- Figure 44: South America Calcined Anthracite Market Volume (K Tons), by Application 2025 & 2033
- Figure 45: South America Calcined Anthracite Market Revenue Share (%), by Application 2025 & 2033
- Figure 46: South America Calcined Anthracite Market Volume Share (%), by Application 2025 & 2033
- Figure 47: South America Calcined Anthracite Market Revenue (Billion), by Country 2025 & 2033
- Figure 48: South America Calcined Anthracite Market Volume (K Tons), by Country 2025 & 2033
- Figure 49: South America Calcined Anthracite Market Revenue Share (%), by Country 2025 & 2033
- Figure 50: South America Calcined Anthracite Market Volume Share (%), by Country 2025 & 2033
- Figure 51: Middle East and Africa Calcined Anthracite Market Revenue (Billion), by Calcination Type 2025 & 2033
- Figure 52: Middle East and Africa Calcined Anthracite Market Volume (K Tons), by Calcination Type 2025 & 2033
- Figure 53: Middle East and Africa Calcined Anthracite Market Revenue Share (%), by Calcination Type 2025 & 2033
- Figure 54: Middle East and Africa Calcined Anthracite Market Volume Share (%), by Calcination Type 2025 & 2033
- Figure 55: Middle East and Africa Calcined Anthracite Market Revenue (Billion), by Application 2025 & 2033
- Figure 56: Middle East and Africa Calcined Anthracite Market Volume (K Tons), by Application 2025 & 2033
- Figure 57: Middle East and Africa Calcined Anthracite Market Revenue Share (%), by Application 2025 & 2033
- Figure 58: Middle East and Africa Calcined Anthracite Market Volume Share (%), by Application 2025 & 2033
- Figure 59: Middle East and Africa Calcined Anthracite Market Revenue (Billion), by Country 2025 & 2033
- Figure 60: Middle East and Africa Calcined Anthracite Market Volume (K Tons), by Country 2025 & 2033
- Figure 61: Middle East and Africa Calcined Anthracite Market Revenue Share (%), by Country 2025 & 2033
- Figure 62: Middle East and Africa Calcined Anthracite Market Volume Share (%), by Country 2025 & 2033
List of Tables
- Table 1: Global Calcined Anthracite Market Revenue Billion Forecast, by Calcination Type 2020 & 2033
- Table 2: Global Calcined Anthracite Market Volume K Tons Forecast, by Calcination Type 2020 & 2033
- Table 3: Global Calcined Anthracite Market Revenue Billion Forecast, by Application 2020 & 2033
- Table 4: Global Calcined Anthracite Market Volume K Tons Forecast, by Application 2020 & 2033
- Table 5: Global Calcined Anthracite Market Revenue Billion Forecast, by Region 2020 & 2033
- Table 6: Global Calcined Anthracite Market Volume K Tons Forecast, by Region 2020 & 2033
- Table 7: Global Calcined Anthracite Market Revenue Billion Forecast, by Calcination Type 2020 & 2033
- Table 8: Global Calcined Anthracite Market Volume K Tons Forecast, by Calcination Type 2020 & 2033
- Table 9: Global Calcined Anthracite Market Revenue Billion Forecast, by Application 2020 & 2033
- Table 10: Global Calcined Anthracite Market Volume K Tons Forecast, by Application 2020 & 2033
- Table 11: Global Calcined Anthracite Market Revenue Billion Forecast, by Country 2020 & 2033
- Table 12: Global Calcined Anthracite Market Volume K Tons Forecast, by Country 2020 & 2033
- Table 13: China Calcined Anthracite Market Revenue (Billion) Forecast, by Application 2020 & 2033
- Table 14: China Calcined Anthracite Market Volume (K Tons) Forecast, by Application 2020 & 2033
- Table 15: India Calcined Anthracite Market Revenue (Billion) Forecast, by Application 2020 & 2033
- Table 16: India Calcined Anthracite Market Volume (K Tons) Forecast, by Application 2020 & 2033
- Table 17: Japan Calcined Anthracite Market Revenue (Billion) Forecast, by Application 2020 & 2033
- Table 18: Japan Calcined Anthracite Market Volume (K Tons) Forecast, by Application 2020 & 2033
- Table 19: South Korea Calcined Anthracite Market Revenue (Billion) Forecast, by Application 2020 & 2033
- Table 20: South Korea Calcined Anthracite Market Volume (K Tons) Forecast, by Application 2020 & 2033
- Table 21: Rest of Asia Pacific Calcined Anthracite Market Revenue (Billion) Forecast, by Application 2020 & 2033
- Table 22: Rest of Asia Pacific Calcined Anthracite Market Volume (K Tons) Forecast, by Application 2020 & 2033
- Table 23: Global Calcined Anthracite Market Revenue Billion Forecast, by Calcination Type 2020 & 2033
- Table 24: Global Calcined Anthracite Market Volume K Tons Forecast, by Calcination Type 2020 & 2033
- Table 25: Global Calcined Anthracite Market Revenue Billion Forecast, by Application 2020 & 2033
- Table 26: Global Calcined Anthracite Market Volume K Tons Forecast, by Application 2020 & 2033
- Table 27: Global Calcined Anthracite Market Revenue Billion Forecast, by Country 2020 & 2033
- Table 28: Global Calcined Anthracite Market Volume K Tons Forecast, by Country 2020 & 2033
- Table 29: United States Calcined Anthracite Market Revenue (Billion) Forecast, by Application 2020 & 2033
- Table 30: United States Calcined Anthracite Market Volume (K Tons) Forecast, by Application 2020 & 2033
- Table 31: Canada Calcined Anthracite Market Revenue (Billion) Forecast, by Application 2020 & 2033
- Table 32: Canada Calcined Anthracite Market Volume (K Tons) Forecast, by Application 2020 & 2033
- Table 33: Mexico Calcined Anthracite Market Revenue (Billion) Forecast, by Application 2020 & 2033
- Table 34: Mexico Calcined Anthracite Market Volume (K Tons) Forecast, by Application 2020 & 2033
- Table 35: Global Calcined Anthracite Market Revenue Billion Forecast, by Calcination Type 2020 & 2033
- Table 36: Global Calcined Anthracite Market Volume K Tons Forecast, by Calcination Type 2020 & 2033
- Table 37: Global Calcined Anthracite Market Revenue Billion Forecast, by Application 2020 & 2033
- Table 38: Global Calcined Anthracite Market Volume K Tons Forecast, by Application 2020 & 2033
- Table 39: Global Calcined Anthracite Market Revenue Billion Forecast, by Country 2020 & 2033
- Table 40: Global Calcined Anthracite Market Volume K Tons Forecast, by Country 2020 & 2033
- Table 41: Germany Calcined Anthracite Market Revenue (Billion) Forecast, by Application 2020 & 2033
- Table 42: Germany Calcined Anthracite Market Volume (K Tons) Forecast, by Application 2020 & 2033
- Table 43: United Kingdom Calcined Anthracite Market Revenue (Billion) Forecast, by Application 2020 & 2033
- Table 44: United Kingdom Calcined Anthracite Market Volume (K Tons) Forecast, by Application 2020 & 2033
- Table 45: Italy Calcined Anthracite Market Revenue (Billion) Forecast, by Application 2020 & 2033
- Table 46: Italy Calcined Anthracite Market Volume (K Tons) Forecast, by Application 2020 & 2033
- Table 47: France Calcined Anthracite Market Revenue (Billion) Forecast, by Application 2020 & 2033
- Table 48: France Calcined Anthracite Market Volume (K Tons) Forecast, by Application 2020 & 2033
- Table 49: Rest of Europe Calcined Anthracite Market Revenue (Billion) Forecast, by Application 2020 & 2033
- Table 50: Rest of Europe Calcined Anthracite Market Volume (K Tons) Forecast, by Application 2020 & 2033
- Table 51: Global Calcined Anthracite Market Revenue Billion Forecast, by Calcination Type 2020 & 2033
- Table 52: Global Calcined Anthracite Market Volume K Tons Forecast, by Calcination Type 2020 & 2033
- Table 53: Global Calcined Anthracite Market Revenue Billion Forecast, by Application 2020 & 2033
- Table 54: Global Calcined Anthracite Market Volume K Tons Forecast, by Application 2020 & 2033
- Table 55: Global Calcined Anthracite Market Revenue Billion Forecast, by Country 2020 & 2033
- Table 56: Global Calcined Anthracite Market Volume K Tons Forecast, by Country 2020 & 2033
- Table 57: Brazil Calcined Anthracite Market Revenue (Billion) Forecast, by Application 2020 & 2033
- Table 58: Brazil Calcined Anthracite Market Volume (K Tons) Forecast, by Application 2020 & 2033
- Table 59: Argentina Calcined Anthracite Market Revenue (Billion) Forecast, by Application 2020 & 2033
- Table 60: Argentina Calcined Anthracite Market Volume (K Tons) Forecast, by Application 2020 & 2033
- Table 61: Rest of South America Calcined Anthracite Market Revenue (Billion) Forecast, by Application 2020 & 2033
- Table 62: Rest of South America Calcined Anthracite Market Volume (K Tons) Forecast, by Application 2020 & 2033
- Table 63: Global Calcined Anthracite Market Revenue Billion Forecast, by Calcination Type 2020 & 2033
- Table 64: Global Calcined Anthracite Market Volume K Tons Forecast, by Calcination Type 2020 & 2033
- Table 65: Global Calcined Anthracite Market Revenue Billion Forecast, by Application 2020 & 2033
- Table 66: Global Calcined Anthracite Market Volume K Tons Forecast, by Application 2020 & 2033
- Table 67: Global Calcined Anthracite Market Revenue Billion Forecast, by Country 2020 & 2033
- Table 68: Global Calcined Anthracite Market Volume K Tons Forecast, by Country 2020 & 2033
- Table 69: Saudi Arabia Calcined Anthracite Market Revenue (Billion) Forecast, by Application 2020 & 2033
- Table 70: Saudi Arabia Calcined Anthracite Market Volume (K Tons) Forecast, by Application 2020 & 2033
- Table 71: South Africa Calcined Anthracite Market Revenue (Billion) Forecast, by Application 2020 & 2033
- Table 72: South Africa Calcined Anthracite Market Volume (K Tons) Forecast, by Application 2020 & 2033
- Table 73: Rest of Middle East and Africa Calcined Anthracite Market Revenue (Billion) Forecast, by Application 2020 & 2033
- Table 74: Rest of Middle East and Africa Calcined Anthracite Market Volume (K Tons) Forecast, by Application 2020 & 2033
Frequently Asked Questions
1. What is the projected Compound Annual Growth Rate (CAGR) of the Calcined Anthracite Market?
The projected CAGR is approximately 1.9%.
2. Which companies are prominent players in the Calcined Anthracite Market?
Key companies in the market include SOUTHERN CARBON & CHEMICAL, RESORBENT s r o, Ningxia carbon valley International Co Ltd (NORTHWEST INDUSTRY CO LTD), Voltcon International PTE Limited, Henan Star Metallurgy Material Co Ltd, Black Diamond, JH CARBON, Kingstone Group, Aluminium Rheinfelden GmbH.
3. What are the main segments of the Calcined Anthracite Market?
The market segments include Calcination Type, Application.
4. Can you provide details about the market size?
The market size is estimated to be USD 3.50 Billion as of 2022.
5. What are some drivers contributing to market growth?
; Growing Demand form Steel Manufacturing Industries; Other Drivers.
6. What are the notable trends driving market growth?
Growing Demand from Steel Manufacturing Industries.
7. Are there any restraints impacting market growth?
; Depletion & Volatile Process of Raw Materials; Unfavorable Conditions Arising Due to the COVID-19 Outbreak.
8. Can you provide examples of recent developments in the market?
N/A
9. What pricing options are available for accessing the report?
Pricing options include single-user, multi-user, and enterprise licenses priced at USD 4750, USD 5250, and USD 8750 respectively.
10. Is the market size provided in terms of value or volume?
The market size is provided in terms of value, measured in Billion and volume, measured in K Tons.
11. Are there any specific market keywords associated with the report?
Yes, the market keyword associated with the report is "Calcined Anthracite Market," which aids in identifying and referencing the specific market segment covered.
12. How do I determine which pricing option suits my needs best?
The pricing options vary based on user requirements and access needs. Individual users may opt for single-user licenses, while businesses requiring broader access may choose multi-user or enterprise licenses for cost-effective access to the report.
13. Are there any additional resources or data provided in the Calcined Anthracite Market report?
While the report offers comprehensive insights, it's advisable to review the specific contents or supplementary materials provided to ascertain if additional resources or data are available.
14. How can I stay updated on further developments or reports in the Calcined Anthracite Market?
To stay informed about further developments, trends, and reports in the Calcined Anthracite Market, consider subscribing to industry newsletters, following relevant companies and organizations, or regularly checking reputable industry news sources and publications.
Methodology
Step 1 - Identification of Relevant Samples Size from Population Database


Step 2 - Approaches for Defining Global Market Size (Value, Volume* & Price*)

Note*: In applicable scenarios
Step 3 - Data Sources
Primary Research
- Web Analytics
- Survey Reports
- Research Institute
- Latest Research Reports
- Opinion Leaders
Secondary Research
- Annual Reports
- White Paper
- Latest Press Release
- Industry Association
- Paid Database
- Investor Presentations

Step 4 - Data Triangulation
Involves using different sources of information in order to increase the validity of a study
These sources are likely to be stakeholders in a program - participants, other researchers, program staff, other community members, and so on.
Then we put all data in single framework & apply various statistical tools to find out the dynamic on the market.
During the analysis stage, feedback from the stakeholder groups would be compared to determine areas of agreement as well as areas of divergence