

Key Insights
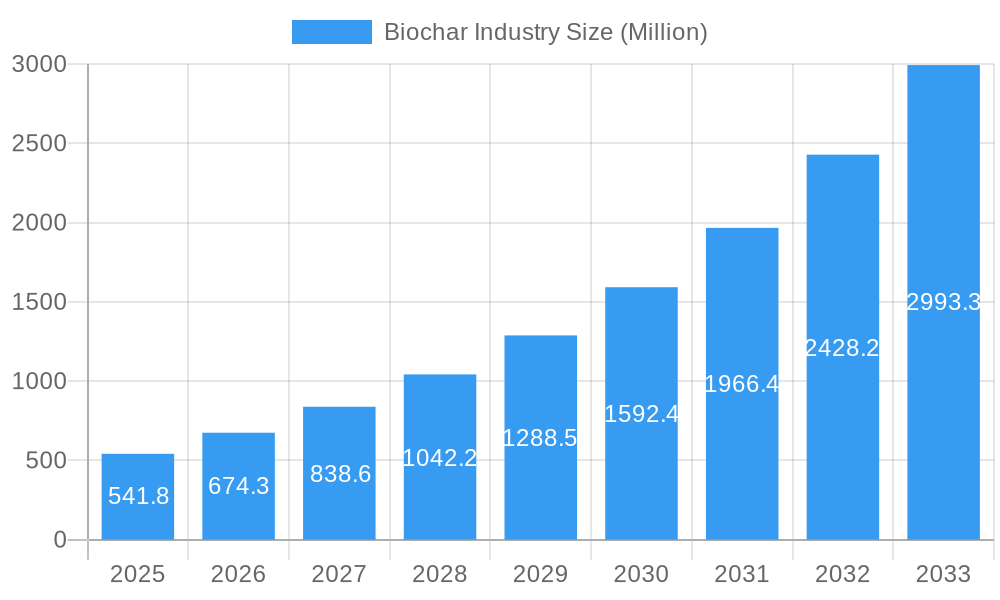
The global biochar market, valued at $541.8 million in 2025, is experiencing robust growth, projected to expand at a CAGR exceeding 24.50% from 2025 to 2033. This significant expansion is driven by several key factors. Increasing awareness of biochar's role in sustainable agriculture, particularly soil amendment and carbon sequestration, is a major catalyst. The growing demand for environmentally friendly solutions in various sectors, including animal farming and industrial applications, further fuels market growth. Technological advancements in pyrolysis and gasification systems, leading to improved efficiency and cost-effectiveness of biochar production, are also contributing to market expansion. Furthermore, supportive government policies and initiatives promoting sustainable agriculture and carbon neutrality are creating a favorable regulatory environment. The market segmentation reveals strong demand across various applications, with agriculture and animal farming currently dominating, followed by a steadily growing industrial sector incorporating biochar into diverse materials and processes.
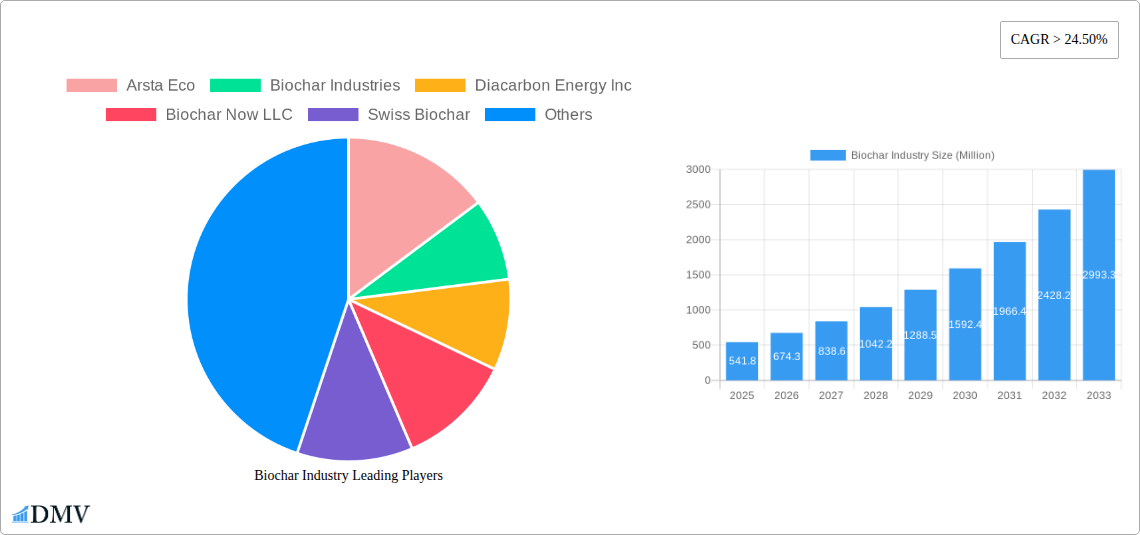
Biochar Industry Market Size (In Million)
However, challenges remain. The relatively high initial investment costs associated with biochar production technologies can pose a barrier to entry for smaller players. Ensuring consistent quality and standardization of biochar products across diverse production methods is also crucial for wider market adoption. Furthermore, the lack of widespread awareness among end-users in certain regions, particularly in developing countries, limits market penetration. Despite these restraints, the long-term outlook for the biochar market remains highly positive, driven by increasing environmental concerns, technological advancements, and supportive government regulations. Strategic collaborations between technology providers, agricultural stakeholders, and policymakers are key to unlocking the full potential of this burgeoning market. The diverse applications and the environmentally friendly nature of biochar position it as a crucial element in the global transition towards sustainable practices.
Biochar Industry Company Market Share
Biochar Industry Market Report: 2019-2033
This comprehensive report provides an in-depth analysis of the Biochar industry, projecting a market valuation of xx Million by 2033. It covers market dynamics, key players, technological advancements, and future growth opportunities, offering valuable insights for stakeholders across the value chain. The study period spans 2019-2033, with 2025 serving as the base and estimated year. The forecast period is 2025-2033, and the historical period is 2019-2024.
Biochar Industry Market Composition & Trends
The global biochar market exhibits a moderately fragmented landscape, with several key players vying for market share. Market concentration is expected to shift slightly towards consolidation as larger players invest in expansion and smaller companies face challenges in scaling operations. Innovation is heavily driven by the need for improved production efficiency and diversified applications, fueled by growing environmental concerns and government incentives. Regulatory landscapes vary significantly across regions, influencing production costs and market access. Substitute products, such as activated carbon, pose competition, especially in specific applications. End-users are primarily concentrated in the agriculture and environmental remediation sectors. Significant M&A activity is anticipated in the coming years, driven by strategic consolidation and technological advancement acquisition.
- Market Share Distribution (2024): Arsta Eco (xx%), Biochar Industries (xx%), Diacarbon Energy Inc (xx%), and others (xx%). Exact figures are unavailable.
- M&A Deal Values (2019-2024): A total estimated value of xx Million in M&A transactions. Specific deal values are confidential.
Biochar Industry Evolution
The biochar industry has witnessed substantial growth since 2019, propelled by increasing awareness of its environmental benefits and its diverse applications across various sectors. The market experienced a Compound Annual Growth Rate (CAGR) of xx% during the historical period (2019-2024) and is projected to maintain a CAGR of xx% during the forecast period (2025-2033), reaching an estimated xx Million by 2033. This growth is driven by advancements in pyrolysis and gasification technologies, enabling cost-effective and efficient biochar production. Furthermore, changing consumer demands for sustainable and environmentally friendly products, coupled with increasing government support for renewable energy initiatives, are fostering market expansion. The adoption of biochar in agriculture is increasing rapidly, driven by its soil amendment properties and its ability to sequester carbon.
Leading Regions, Countries, or Segments in Biochar Industry
While the global market presents opportunities, specific regions and applications show significant leadership.
- Technology: Pyrolysis currently dominates the biochar production technology segment due to its relative maturity and cost-effectiveness. Gasification is gaining traction for its potential to generate syngas alongside biochar. Hydrothermal carbonization is a niche technology with specific applications.
- Application: Agriculture is currently the leading application segment, accounting for approximately xx% of the market due to biochar's role in enhancing soil health and improving crop yields. Animal farming is another significant application driven by improved feed efficiency and reduced greenhouse gas emissions. Industrial uses are developing, including water purification and filtration.
Key Drivers:
- Agriculture: Growing demand for sustainable agricultural practices and increasing awareness of biochar's soil amendment properties.
- Environmental Remediation: Stringent environmental regulations and the need for effective carbon sequestration solutions.
- Investment Trends: Increasing venture capital and private equity investments in biochar technology companies.
- Regulatory Support: Government incentives and policies promoting renewable energy and sustainable agriculture.
Biochar Industry Product Innovations
Recent innovations focus on enhancing biochar's performance characteristics, such as improving its porosity and surface area to maximize its adsorption capabilities. New applications are constantly being explored, including its use in concrete and composite materials. The development of advanced pyrolysis and gasification systems are further improving production efficiency and reducing costs. Unique selling propositions include tailored biochar formulations designed to address specific needs in agriculture and environmental remediation.
Propelling Factors for Biochar Industry Growth
The biochar industry's growth is fueled by several key factors: increasing environmental concerns leading to carbon sequestration mandates, the need for sustainable agricultural practices driving its use as a soil amendment, advancements in production technologies lowering costs, and supportive government policies offering incentives for renewable energy and sustainable agriculture development. The growing awareness of biochar's diverse applications across various industries also fuels market expansion.
Obstacles in the Biochar Industry Market
Challenges include inconsistencies in biochar quality and standardization, high initial investment costs for production facilities, limited awareness in certain regions, the emergence of competing carbon sequestration technologies, and potential supply chain disruptions affecting feedstock availability. These issues can significantly hinder the widespread adoption and growth of the biochar industry.
Future Opportunities in Biochar Industry
The biochar industry has significant potential for growth. Emerging applications in advanced materials, bioremediation, and carbon capture, utilization, and storage (CCUS) represent lucrative opportunities. Technological advancements, including artificial intelligence-driven process optimization and the development of more efficient pyrolysis systems, will further enhance its cost-competitiveness. Expansion into new markets in developing countries with high agricultural needs will also drive growth.
Major Players in the Biochar Industry Ecosystem
- Arsta Eco
- Biochar Industries
- Diacarbon Energy Inc
- Biochar Now LLC
- Swiss Biochar
- PyroCore
- Sunriver Biochar
- Airex Energy
- Phoenix Energy
- Karr Group
- Wonjin Group
- Carbon Gold Ltd
- Biochar Supreme
- BIOSORRA
- Pyreg GmbH
Key Developments in Biochar Industry Industry
- November 2023: BIOSORRA launched a biochar production plant in Thika, Kenya, supplying biochar to Kenya Nut Company.
- November 2023: Pyreg GmbH launched Biochar Carbon Removal (BCR) through its carbonization systems, accelerating deployment via Climate Finance Solutions (PCFS).
- June 2022: Airex Energy joined the BDO Zone Strategic Alliance, facilitating biobased project development.
Strategic Biochar Industry Market Forecast
The biochar market is poised for significant expansion due to increasing environmental awareness, technological advancements driving down production costs, and supportive government policies. The rising demand for sustainable solutions in agriculture and environmental remediation will further propel market growth. New applications and innovations will open up further opportunities, leading to a substantial increase in market value in the coming years.
Biochar Industry Segmentation
-
1. Technology
- 1.1. Pyrolysis
- 1.2. Gasification Systems
- 1.3. Other Technologies (Hydrothermal Carbonization)
-
2. Application
- 2.1. Agriculture
- 2.2. Animal Farming
- 2.3. Industrial Uses
- 2.4. Other Applications (Environmental Remediation)
Biochar Industry Segmentation By Geography
-
1. Asia Pacific
- 1.1. China
- 1.2. Australia
- 1.3. South Korea
- 1.4. Rest of Asia Pacific
-
2. North America
- 2.1. United States
- 2.2. Canada
-
3. Europe
- 3.1. Germany
- 3.2. Sweden
- 3.3. Austria
- 3.4. Switzerland
- 3.5. United Kingdom
- 3.6. Rest of Europe
- 4. Rest of the World
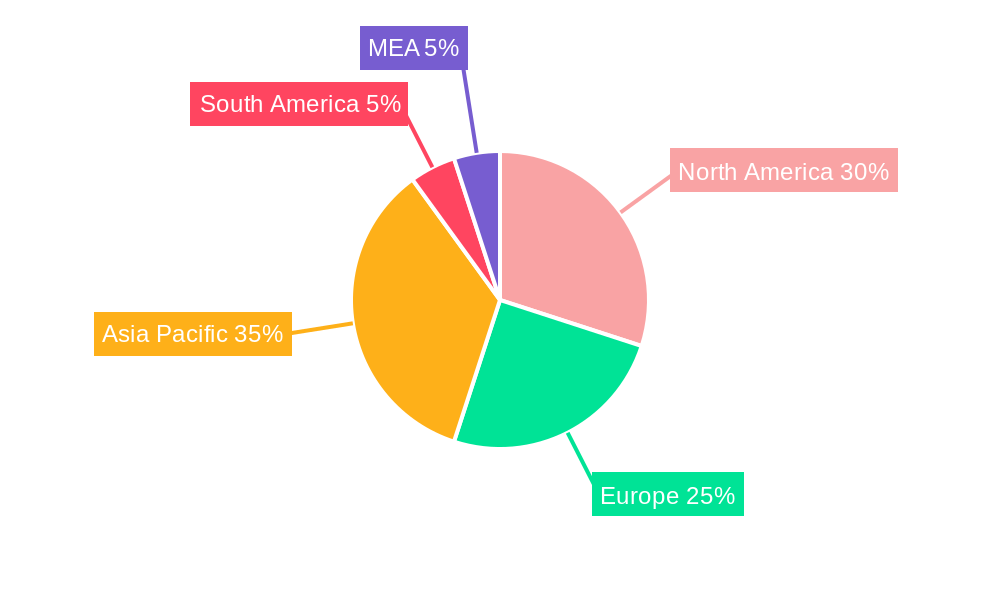
Biochar Industry Regional Market Share
Geographic Coverage of Biochar Industry
Biochar Industry REPORT HIGHLIGHTS
| Aspects | Details |
|---|---|
| Study Period | 2020-2034 |
| Base Year | 2025 |
| Estimated Year | 2026 |
| Forecast Period | 2026-2034 |
| Historical Period | 2020-2025 |
| Growth Rate | CAGR of > 24.50% from 2020-2034 |
| Segmentation |
|
Table of Contents
- 1. Introduction
- 1.1. Research Scope
- 1.2. Market Segmentation
- 1.3. Research Objective
- 1.4. Definitions and Assumptions
- 2. Executive Summary
- 2.1. Market Snapshot
- 3. Market Dynamics
- 3.1. Market Drivers
- 3.2. Market Restrains
- 3.3. Market Trends
- 3.4. Market Opportunities
- 4. Market Factor Analysis
- 4.1. Porters Five Forces
- 4.1.1. Bargaining Power of Suppliers
- 4.1.2. Bargaining Power of Buyers
- 4.1.3. Threat of New Entrants
- 4.1.4. Threat of Substitutes
- 4.1.5. Competitive Rivalry
- 4.2. PESTEL analysis
- 4.3. BCG Analysis
- 4.3.1. Stars (High Growth, High Market Share)
- 4.3.2. Cash Cows (Low Growth, High Market Share)
- 4.3.3. Question Mark (High Growth, Low Market Share)
- 4.3.4. Dogs (Low Growth, Low Market Share)
- 4.4. Ansoff Matrix Analysis
- 4.5. Supply Chain Analysis
- 4.6. Regulatory Landscape
- 4.7. Current Market Potential and Opportunity Assessment (TAM–SAM–SOM Framework)
- 4.8. DMV Analyst Note
- 4.1. Porters Five Forces
- 5. Market Analysis, Insights and Forecast 2021-2033
- 5.1. Market Analysis, Insights and Forecast - by Technology
- 5.1.1. Pyrolysis
- 5.1.2. Gasification Systems
- 5.1.3. Other Technologies (Hydrothermal Carbonization)
- 5.2. Market Analysis, Insights and Forecast - by Application
- 5.2.1. Agriculture
- 5.2.2. Animal Farming
- 5.2.3. Industrial Uses
- 5.2.4. Other Applications (Environmental Remediation)
- 5.3. Market Analysis, Insights and Forecast - by Region
- 5.3.1. Asia Pacific
- 5.3.2. North America
- 5.3.3. Europe
- 5.3.4. Rest of the World
- 5.1. Market Analysis, Insights and Forecast - by Technology
- 6. Global Biochar Industry Analysis, Insights and Forecast, 2021-2033
- 6.1. Market Analysis, Insights and Forecast - by Technology
- 6.1.1. Pyrolysis
- 6.1.2. Gasification Systems
- 6.1.3. Other Technologies (Hydrothermal Carbonization)
- 6.2. Market Analysis, Insights and Forecast - by Application
- 6.2.1. Agriculture
- 6.2.2. Animal Farming
- 6.2.3. Industrial Uses
- 6.2.4. Other Applications (Environmental Remediation)
- 6.1. Market Analysis, Insights and Forecast - by Technology
- 7. Asia Pacific Biochar Industry Analysis, Insights and Forecast, 2020-2032
- 7.1. Market Analysis, Insights and Forecast - by Technology
- 7.1.1. Pyrolysis
- 7.1.2. Gasification Systems
- 7.1.3. Other Technologies (Hydrothermal Carbonization)
- 7.2. Market Analysis, Insights and Forecast - by Application
- 7.2.1. Agriculture
- 7.2.2. Animal Farming
- 7.2.3. Industrial Uses
- 7.2.4. Other Applications (Environmental Remediation)
- 7.1. Market Analysis, Insights and Forecast - by Technology
- 8. North America Biochar Industry Analysis, Insights and Forecast, 2020-2032
- 8.1. Market Analysis, Insights and Forecast - by Technology
- 8.1.1. Pyrolysis
- 8.1.2. Gasification Systems
- 8.1.3. Other Technologies (Hydrothermal Carbonization)
- 8.2. Market Analysis, Insights and Forecast - by Application
- 8.2.1. Agriculture
- 8.2.2. Animal Farming
- 8.2.3. Industrial Uses
- 8.2.4. Other Applications (Environmental Remediation)
- 8.1. Market Analysis, Insights and Forecast - by Technology
- 9. Europe Biochar Industry Analysis, Insights and Forecast, 2020-2032
- 9.1. Market Analysis, Insights and Forecast - by Technology
- 9.1.1. Pyrolysis
- 9.1.2. Gasification Systems
- 9.1.3. Other Technologies (Hydrothermal Carbonization)
- 9.2. Market Analysis, Insights and Forecast - by Application
- 9.2.1. Agriculture
- 9.2.2. Animal Farming
- 9.2.3. Industrial Uses
- 9.2.4. Other Applications (Environmental Remediation)
- 9.1. Market Analysis, Insights and Forecast - by Technology
- 10. Rest of the World Biochar Industry Analysis, Insights and Forecast, 2020-2032
- 10.1. Market Analysis, Insights and Forecast - by Technology
- 10.1.1. Pyrolysis
- 10.1.2. Gasification Systems
- 10.1.3. Other Technologies (Hydrothermal Carbonization)
- 10.2. Market Analysis, Insights and Forecast - by Application
- 10.2.1. Agriculture
- 10.2.2. Animal Farming
- 10.2.3. Industrial Uses
- 10.2.4. Other Applications (Environmental Remediation)
- 10.1. Market Analysis, Insights and Forecast - by Technology
- 11. Competitive Analysis
- 11.1. Company Profiles
- 11.1.1 Arsta Eco
- 11.1.1.1. Company Overview
- 11.1.1.2. Products
- 11.1.1.3. Company Financials
- 11.1.1.4. SWOT Analysis
- 11.1.2 Biochar Industries
- 11.1.2.1. Company Overview
- 11.1.2.2. Products
- 11.1.2.3. Company Financials
- 11.1.2.4. SWOT Analysis
- 11.1.3 Diacarbon Energy Inc
- 11.1.3.1. Company Overview
- 11.1.3.2. Products
- 11.1.3.3. Company Financials
- 11.1.3.4. SWOT Analysis
- 11.1.4 Biochar Now LLC
- 11.1.4.1. Company Overview
- 11.1.4.2. Products
- 11.1.4.3. Company Financials
- 11.1.4.4. SWOT Analysis
- 11.1.5 Swiss Biochar
- 11.1.5.1. Company Overview
- 11.1.5.2. Products
- 11.1.5.3. Company Financials
- 11.1.5.4. SWOT Analysis
- 11.1.6 PyroCore
- 11.1.6.1. Company Overview
- 11.1.6.2. Products
- 11.1.6.3. Company Financials
- 11.1.6.4. SWOT Analysis
- 11.1.7 Sunriver Biochar
- 11.1.7.1. Company Overview
- 11.1.7.2. Products
- 11.1.7.3. Company Financials
- 11.1.7.4. SWOT Analysis
- 11.1.8 Airex Energy
- 11.1.8.1. Company Overview
- 11.1.8.2. Products
- 11.1.8.3. Company Financials
- 11.1.8.4. SWOT Analysis
- 11.1.9 Phoenix Energy
- 11.1.9.1. Company Overview
- 11.1.9.2. Products
- 11.1.9.3. Company Financials
- 11.1.9.4. SWOT Analysis
- 11.1.10 Karr Group
- 11.1.10.1. Company Overview
- 11.1.10.2. Products
- 11.1.10.3. Company Financials
- 11.1.10.4. SWOT Analysis
- 11.1.11 Wonjin Group*List Not Exhaustive
- 11.1.11.1. Company Overview
- 11.1.11.2. Products
- 11.1.11.3. Company Financials
- 11.1.11.4. SWOT Analysis
- 11.1.12 Carbon Gold Ltd
- 11.1.12.1. Company Overview
- 11.1.12.2. Products
- 11.1.12.3. Company Financials
- 11.1.12.4. SWOT Analysis
- 11.1.13 Biochar Supreme
- 11.1.13.1. Company Overview
- 11.1.13.2. Products
- 11.1.13.3. Company Financials
- 11.1.13.4. SWOT Analysis
- 11.1.14 BIOSORRA
- 11.1.14.1. Company Overview
- 11.1.14.2. Products
- 11.1.14.3. Company Financials
- 11.1.14.4. SWOT Analysis
- 11.1.15 Pyreg GmbH
- 11.1.15.1. Company Overview
- 11.1.15.2. Products
- 11.1.15.3. Company Financials
- 11.1.15.4. SWOT Analysis
- 11.1.1 Arsta Eco
- 11.2. Market Entropy
- 11.2.1 Company's Key Areas Served
- 11.2.2 Recent Developments
- 11.3. Company Market Share Analysis 2025
- 11.3.1 Top 5 Companies Market Share Analysis
- 11.3.2 Top 3 Companies Market Share Analysis
- 11.4. List of Potential Customers
- 12. Research Methodology
List of Figures
- Figure 1: Global Biochar Industry Revenue Breakdown (Million, %) by Region 2025 & 2033
- Figure 2: Global Biochar Industry Volume Breakdown (K Tons, %) by Region 2025 & 2033
- Figure 3: Asia Pacific Biochar Industry Revenue (Million), by Technology 2025 & 2033
- Figure 4: Asia Pacific Biochar Industry Volume (K Tons), by Technology 2025 & 2033
- Figure 5: Asia Pacific Biochar Industry Revenue Share (%), by Technology 2025 & 2033
- Figure 6: Asia Pacific Biochar Industry Volume Share (%), by Technology 2025 & 2033
- Figure 7: Asia Pacific Biochar Industry Revenue (Million), by Application 2025 & 2033
- Figure 8: Asia Pacific Biochar Industry Volume (K Tons), by Application 2025 & 2033
- Figure 9: Asia Pacific Biochar Industry Revenue Share (%), by Application 2025 & 2033
- Figure 10: Asia Pacific Biochar Industry Volume Share (%), by Application 2025 & 2033
- Figure 11: Asia Pacific Biochar Industry Revenue (Million), by Country 2025 & 2033
- Figure 12: Asia Pacific Biochar Industry Volume (K Tons), by Country 2025 & 2033
- Figure 13: Asia Pacific Biochar Industry Revenue Share (%), by Country 2025 & 2033
- Figure 14: Asia Pacific Biochar Industry Volume Share (%), by Country 2025 & 2033
- Figure 15: North America Biochar Industry Revenue (Million), by Technology 2025 & 2033
- Figure 16: North America Biochar Industry Volume (K Tons), by Technology 2025 & 2033
- Figure 17: North America Biochar Industry Revenue Share (%), by Technology 2025 & 2033
- Figure 18: North America Biochar Industry Volume Share (%), by Technology 2025 & 2033
- Figure 19: North America Biochar Industry Revenue (Million), by Application 2025 & 2033
- Figure 20: North America Biochar Industry Volume (K Tons), by Application 2025 & 2033
- Figure 21: North America Biochar Industry Revenue Share (%), by Application 2025 & 2033
- Figure 22: North America Biochar Industry Volume Share (%), by Application 2025 & 2033
- Figure 23: North America Biochar Industry Revenue (Million), by Country 2025 & 2033
- Figure 24: North America Biochar Industry Volume (K Tons), by Country 2025 & 2033
- Figure 25: North America Biochar Industry Revenue Share (%), by Country 2025 & 2033
- Figure 26: North America Biochar Industry Volume Share (%), by Country 2025 & 2033
- Figure 27: Europe Biochar Industry Revenue (Million), by Technology 2025 & 2033
- Figure 28: Europe Biochar Industry Volume (K Tons), by Technology 2025 & 2033
- Figure 29: Europe Biochar Industry Revenue Share (%), by Technology 2025 & 2033
- Figure 30: Europe Biochar Industry Volume Share (%), by Technology 2025 & 2033
- Figure 31: Europe Biochar Industry Revenue (Million), by Application 2025 & 2033
- Figure 32: Europe Biochar Industry Volume (K Tons), by Application 2025 & 2033
- Figure 33: Europe Biochar Industry Revenue Share (%), by Application 2025 & 2033
- Figure 34: Europe Biochar Industry Volume Share (%), by Application 2025 & 2033
- Figure 35: Europe Biochar Industry Revenue (Million), by Country 2025 & 2033
- Figure 36: Europe Biochar Industry Volume (K Tons), by Country 2025 & 2033
- Figure 37: Europe Biochar Industry Revenue Share (%), by Country 2025 & 2033
- Figure 38: Europe Biochar Industry Volume Share (%), by Country 2025 & 2033
- Figure 39: Rest of the World Biochar Industry Revenue (Million), by Technology 2025 & 2033
- Figure 40: Rest of the World Biochar Industry Volume (K Tons), by Technology 2025 & 2033
- Figure 41: Rest of the World Biochar Industry Revenue Share (%), by Technology 2025 & 2033
- Figure 42: Rest of the World Biochar Industry Volume Share (%), by Technology 2025 & 2033
- Figure 43: Rest of the World Biochar Industry Revenue (Million), by Application 2025 & 2033
- Figure 44: Rest of the World Biochar Industry Volume (K Tons), by Application 2025 & 2033
- Figure 45: Rest of the World Biochar Industry Revenue Share (%), by Application 2025 & 2033
- Figure 46: Rest of the World Biochar Industry Volume Share (%), by Application 2025 & 2033
- Figure 47: Rest of the World Biochar Industry Revenue (Million), by Country 2025 & 2033
- Figure 48: Rest of the World Biochar Industry Volume (K Tons), by Country 2025 & 2033
- Figure 49: Rest of the World Biochar Industry Revenue Share (%), by Country 2025 & 2033
- Figure 50: Rest of the World Biochar Industry Volume Share (%), by Country 2025 & 2033
List of Tables
- Table 1: Global Biochar Industry Revenue Million Forecast, by Technology 2020 & 2033
- Table 2: Global Biochar Industry Volume K Tons Forecast, by Technology 2020 & 2033
- Table 3: Global Biochar Industry Revenue Million Forecast, by Application 2020 & 2033
- Table 4: Global Biochar Industry Volume K Tons Forecast, by Application 2020 & 2033
- Table 5: Global Biochar Industry Revenue Million Forecast, by Region 2020 & 2033
- Table 6: Global Biochar Industry Volume K Tons Forecast, by Region 2020 & 2033
- Table 7: Global Biochar Industry Revenue Million Forecast, by Technology 2020 & 2033
- Table 8: Global Biochar Industry Volume K Tons Forecast, by Technology 2020 & 2033
- Table 9: Global Biochar Industry Revenue Million Forecast, by Application 2020 & 2033
- Table 10: Global Biochar Industry Volume K Tons Forecast, by Application 2020 & 2033
- Table 11: Global Biochar Industry Revenue Million Forecast, by Country 2020 & 2033
- Table 12: Global Biochar Industry Volume K Tons Forecast, by Country 2020 & 2033
- Table 13: China Biochar Industry Revenue (Million) Forecast, by Application 2020 & 2033
- Table 14: China Biochar Industry Volume (K Tons) Forecast, by Application 2020 & 2033
- Table 15: Australia Biochar Industry Revenue (Million) Forecast, by Application 2020 & 2033
- Table 16: Australia Biochar Industry Volume (K Tons) Forecast, by Application 2020 & 2033
- Table 17: South Korea Biochar Industry Revenue (Million) Forecast, by Application 2020 & 2033
- Table 18: South Korea Biochar Industry Volume (K Tons) Forecast, by Application 2020 & 2033
- Table 19: Rest of Asia Pacific Biochar Industry Revenue (Million) Forecast, by Application 2020 & 2033
- Table 20: Rest of Asia Pacific Biochar Industry Volume (K Tons) Forecast, by Application 2020 & 2033
- Table 21: Global Biochar Industry Revenue Million Forecast, by Technology 2020 & 2033
- Table 22: Global Biochar Industry Volume K Tons Forecast, by Technology 2020 & 2033
- Table 23: Global Biochar Industry Revenue Million Forecast, by Application 2020 & 2033
- Table 24: Global Biochar Industry Volume K Tons Forecast, by Application 2020 & 2033
- Table 25: Global Biochar Industry Revenue Million Forecast, by Country 2020 & 2033
- Table 26: Global Biochar Industry Volume K Tons Forecast, by Country 2020 & 2033
- Table 27: United States Biochar Industry Revenue (Million) Forecast, by Application 2020 & 2033
- Table 28: United States Biochar Industry Volume (K Tons) Forecast, by Application 2020 & 2033
- Table 29: Canada Biochar Industry Revenue (Million) Forecast, by Application 2020 & 2033
- Table 30: Canada Biochar Industry Volume (K Tons) Forecast, by Application 2020 & 2033
- Table 31: Global Biochar Industry Revenue Million Forecast, by Technology 2020 & 2033
- Table 32: Global Biochar Industry Volume K Tons Forecast, by Technology 2020 & 2033
- Table 33: Global Biochar Industry Revenue Million Forecast, by Application 2020 & 2033
- Table 34: Global Biochar Industry Volume K Tons Forecast, by Application 2020 & 2033
- Table 35: Global Biochar Industry Revenue Million Forecast, by Country 2020 & 2033
- Table 36: Global Biochar Industry Volume K Tons Forecast, by Country 2020 & 2033
- Table 37: Germany Biochar Industry Revenue (Million) Forecast, by Application 2020 & 2033
- Table 38: Germany Biochar Industry Volume (K Tons) Forecast, by Application 2020 & 2033
- Table 39: Sweden Biochar Industry Revenue (Million) Forecast, by Application 2020 & 2033
- Table 40: Sweden Biochar Industry Volume (K Tons) Forecast, by Application 2020 & 2033
- Table 41: Austria Biochar Industry Revenue (Million) Forecast, by Application 2020 & 2033
- Table 42: Austria Biochar Industry Volume (K Tons) Forecast, by Application 2020 & 2033
- Table 43: Switzerland Biochar Industry Revenue (Million) Forecast, by Application 2020 & 2033
- Table 44: Switzerland Biochar Industry Volume (K Tons) Forecast, by Application 2020 & 2033
- Table 45: United Kingdom Biochar Industry Revenue (Million) Forecast, by Application 2020 & 2033
- Table 46: United Kingdom Biochar Industry Volume (K Tons) Forecast, by Application 2020 & 2033
- Table 47: Rest of Europe Biochar Industry Revenue (Million) Forecast, by Application 2020 & 2033
- Table 48: Rest of Europe Biochar Industry Volume (K Tons) Forecast, by Application 2020 & 2033
- Table 49: Global Biochar Industry Revenue Million Forecast, by Technology 2020 & 2033
- Table 50: Global Biochar Industry Volume K Tons Forecast, by Technology 2020 & 2033
- Table 51: Global Biochar Industry Revenue Million Forecast, by Application 2020 & 2033
- Table 52: Global Biochar Industry Volume K Tons Forecast, by Application 2020 & 2033
- Table 53: Global Biochar Industry Revenue Million Forecast, by Country 2020 & 2033
- Table 54: Global Biochar Industry Volume K Tons Forecast, by Country 2020 & 2033
Frequently Asked Questions
1. What is the projected Compound Annual Growth Rate (CAGR) of the Biochar Industry?
The projected CAGR is approximately > 24.50%.
2. Which companies are prominent players in the Biochar Industry?
Key companies in the market include Arsta Eco, Biochar Industries, Diacarbon Energy Inc, Biochar Now LLC, Swiss Biochar, PyroCore, Sunriver Biochar, Airex Energy, Phoenix Energy, Karr Group, Wonjin Group*List Not Exhaustive, Carbon Gold Ltd, Biochar Supreme, BIOSORRA, Pyreg GmbH.
3. What are the main segments of the Biochar Industry?
The market segments include Technology, Application.
4. Can you provide details about the market size?
The market size is estimated to be USD 541.8 Million as of 2022.
5. What are some drivers contributing to market growth?
Increasing Applications for Plant Growth and Development; Growing Demand for Organic Foods in Developing Countries.
6. What are the notable trends driving market growth?
Agriculture Segment to Dominate the Market.
7. Are there any restraints impacting market growth?
High Production Costs; Competition from Alternative Products.
8. Can you provide examples of recent developments in the market?
November 2023: BIOSORRA launched a production plant for biochar in East Africa at Thika in Kiambu County, Kenya. This biochar would be provided to Kenya Nut Company, a multinational agribusiness company involved in growing a wide range of products.
9. What pricing options are available for accessing the report?
Pricing options include single-user, multi-user, and enterprise licenses priced at USD 4750, USD 5250, and USD 8750 respectively.
10. Is the market size provided in terms of value or volume?
The market size is provided in terms of value, measured in Million and volume, measured in K Tons.
11. Are there any specific market keywords associated with the report?
Yes, the market keyword associated with the report is "Biochar Industry," which aids in identifying and referencing the specific market segment covered.
12. How do I determine which pricing option suits my needs best?
The pricing options vary based on user requirements and access needs. Individual users may opt for single-user licenses, while businesses requiring broader access may choose multi-user or enterprise licenses for cost-effective access to the report.
13. Are there any additional resources or data provided in the Biochar Industry report?
While the report offers comprehensive insights, it's advisable to review the specific contents or supplementary materials provided to ascertain if additional resources or data are available.
14. How can I stay updated on further developments or reports in the Biochar Industry?
To stay informed about further developments, trends, and reports in the Biochar Industry, consider subscribing to industry newsletters, following relevant companies and organizations, or regularly checking reputable industry news sources and publications.
Methodology
Step 1 - Identification of Relevant Samples Size from Population Database


Step 2 - Approaches for Defining Global Market Size (Value, Volume* & Price*)

Note*: In applicable scenarios
Step 3 - Data Sources
Primary Research
- Web Analytics
- Survey Reports
- Research Institute
- Latest Research Reports
- Opinion Leaders
Secondary Research
- Annual Reports
- White Paper
- Latest Press Release
- Industry Association
- Paid Database
- Investor Presentations

Step 4 - Data Triangulation
Involves using different sources of information in order to increase the validity of a study
These sources are likely to be stakeholders in a program - participants, other researchers, program staff, other community members, and so on.
Then we put all data in single framework & apply various statistical tools to find out the dynamic on the market.
During the analysis stage, feedback from the stakeholder groups would be compared to determine areas of agreement as well as areas of divergence