

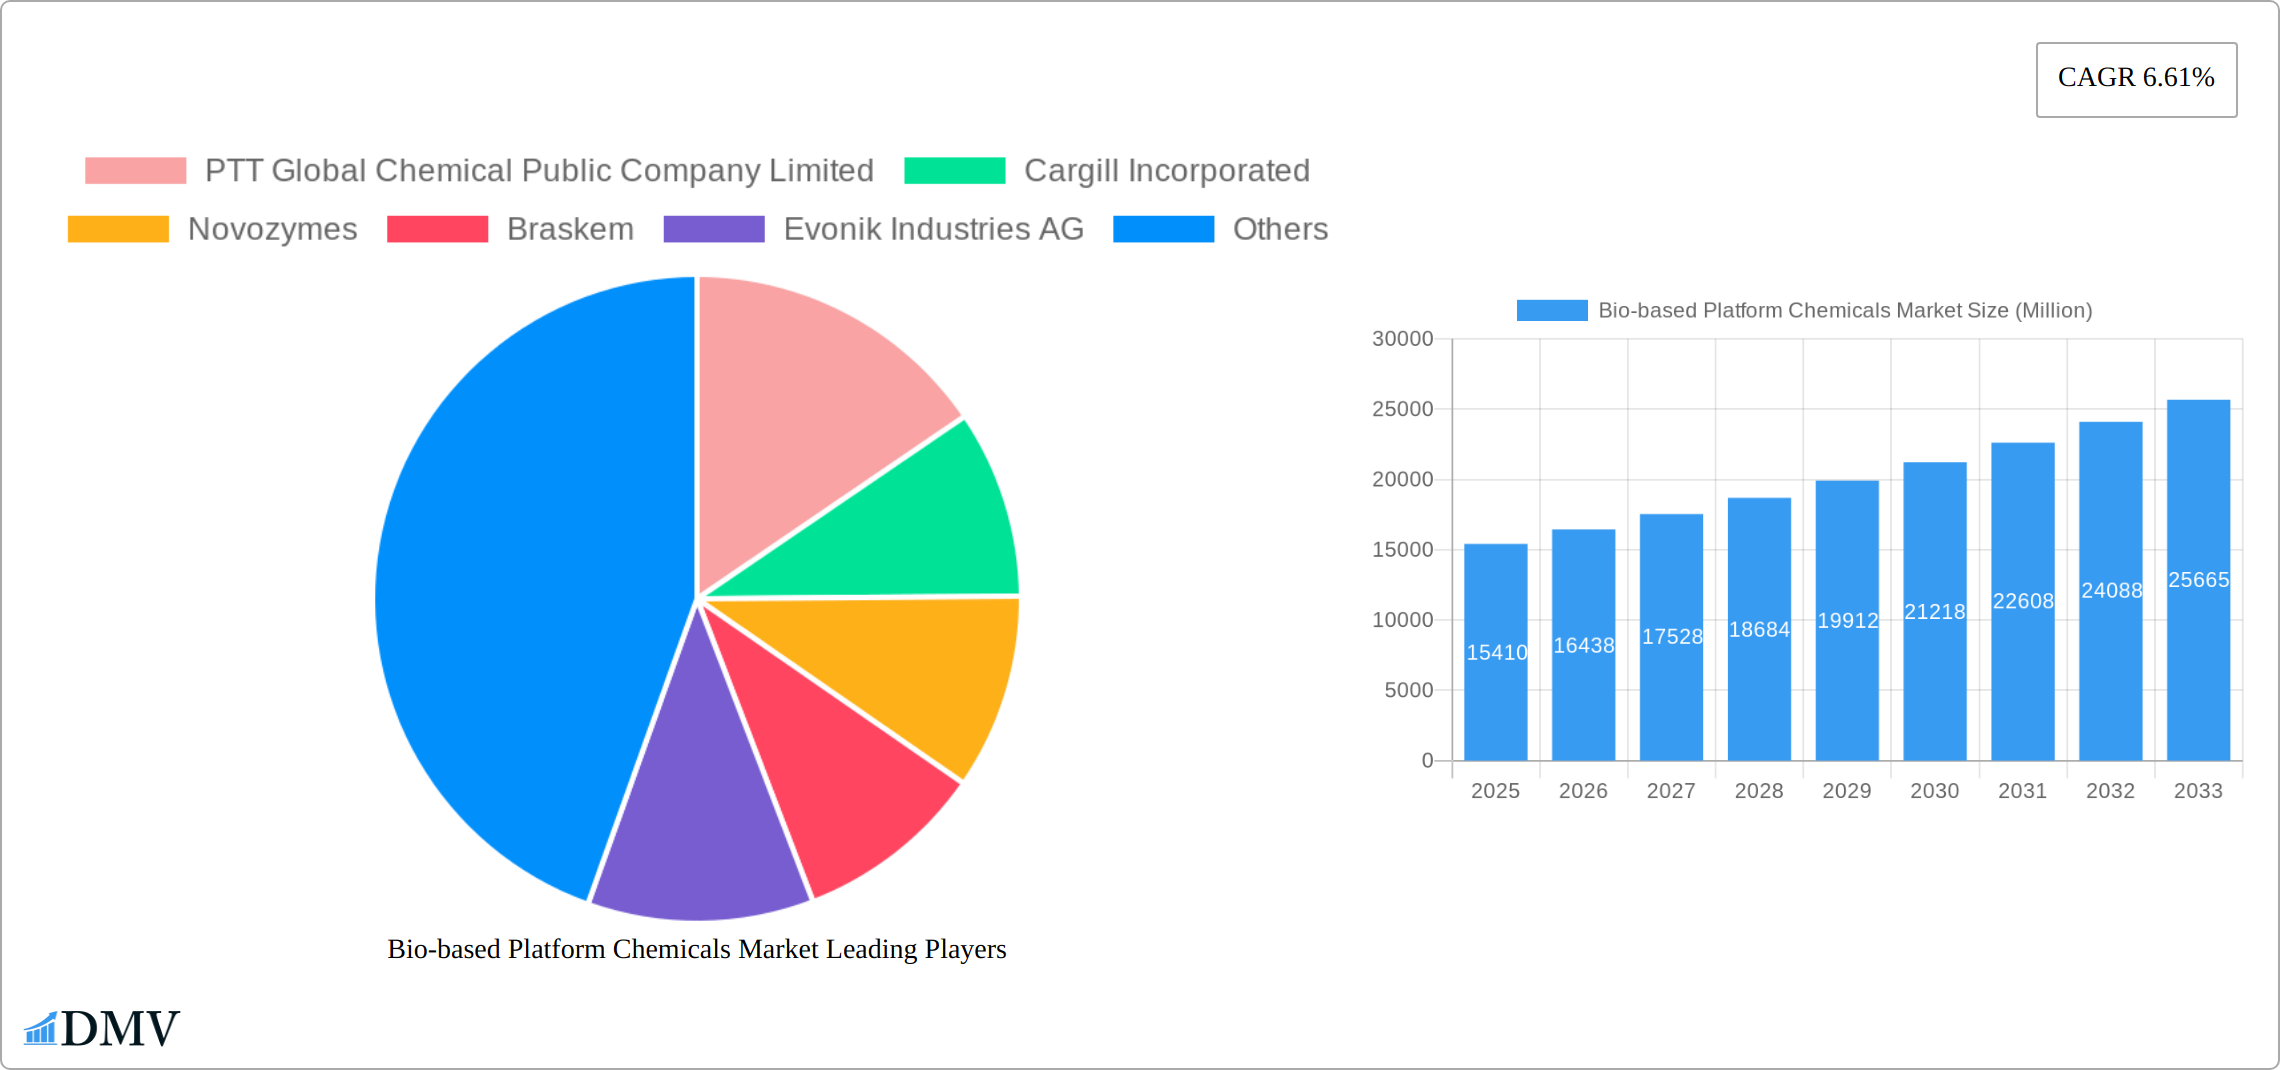
Key Insights
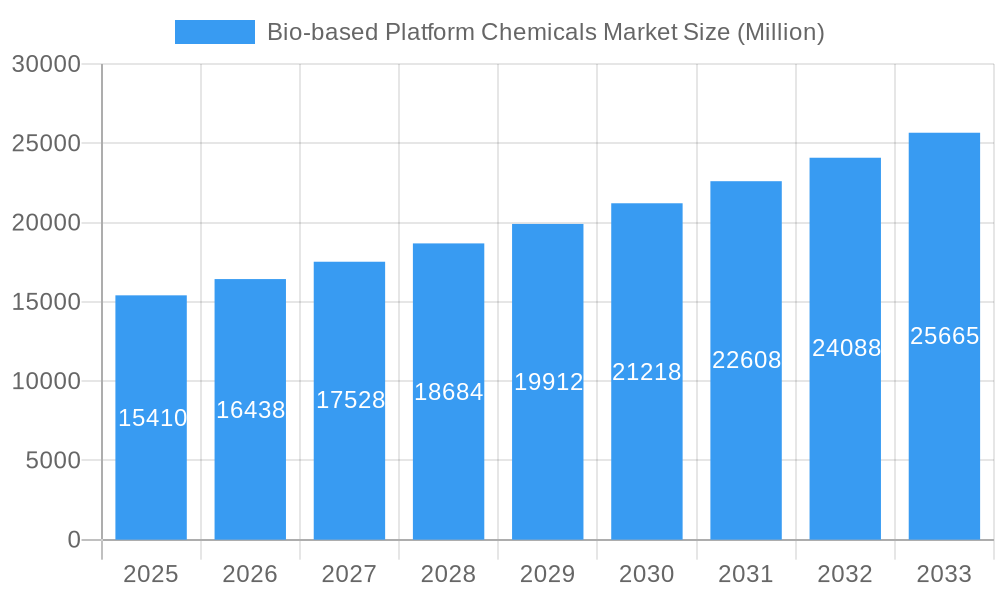
The Bio-based Platform Chemicals market is experiencing robust growth, projected to reach \$15.41 billion in 2025 and exhibiting a Compound Annual Growth Rate (CAGR) of 6.61% from 2025 to 2033. This expansion is driven by increasing demand for sustainable and renewable alternatives to petroleum-based chemicals across various industries, including food and beverage, pharmaceuticals, cosmetics, and plastics. The rising awareness of environmental concerns and stringent government regulations promoting bio-based products further fuel market growth. Key product segments like bio-glycerol, bio-succinic acid, and bio-glutamic acid are witnessing significant traction due to their versatile applications and established market presence. Technological advancements in bio-based chemical production, coupled with decreasing production costs, are enhancing the competitiveness and accessibility of these products. However, challenges remain, including the relatively higher cost compared to their petroleum-based counterparts and the need for further advancements in production efficiency and scalability to meet the growing global demand. The Asia Pacific region, particularly China and India, is expected to dominate the market due to rapid industrialization and significant government support for the bio-based economy. North America and Europe also hold substantial market shares, driven by strong regulatory frameworks and a high adoption rate of sustainable products. Competition is fierce, with major players like Cargill, Novozymes, BASF, and Evonik actively investing in research and development and expanding their production capacities to cater to the growing market demand.
Bio-based Platform Chemicals Market Market Size (In Billion)
The projected market size for 2033 can be estimated by extrapolating the CAGR. Using a 6.61% CAGR from the 2025 base of $15.41 billion, the market is expected to show substantial growth over the forecast period. This growth will be influenced by factors such as continued technological improvements, evolving consumer preferences, and supportive government policies. The market's segmentation by product type will continue to evolve, with certain bio-based platform chemicals gaining prominence due to their diverse applications and cost-effectiveness. Regional variations will also persist, with certain regions exhibiting higher growth rates than others based on factors like economic development, regulatory landscape, and consumer demand for sustainable products. Companies will likely focus on strategic partnerships, mergers and acquisitions, and capacity expansions to strengthen their market position and meet the increasing demand for bio-based platform chemicals.
Bio-based Platform Chemicals Market Company Market Share
Bio-based Platform Chemicals Market: A Comprehensive Report (2019-2033)
This insightful report provides a comprehensive analysis of the Bio-based Platform Chemicals Market, offering crucial data and forecasts for stakeholders across the value chain. With a study period spanning 2019-2033, a base year of 2025, and a forecast period of 2025-2033, this report unveils the market's dynamics, trends, and future potential. Valued at xx Million in 2025, the market is poised for significant growth, driven by increasing demand for sustainable solutions and stringent environmental regulations.
Bio-based Platform Chemicals Market Market Composition & Trends
This section provides a comprehensive analysis of the competitive dynamics within the bio-based platform chemicals market. We explore key market concentration indicators, identify primary innovation drivers, and dissect the influence of prevailing regulatory frameworks. The report also scrutinizes the threat posed by substitute products, profiles the diverse end-user segments, and examines the impact of mergers and acquisitions (M&A) activities on market structure.
We meticulously assess the market share distribution among prominent players such as PTT Global Chemical, Cargill, Novozymes, Braskem, Evonik, and BASF, offering a clear perspective on the competitive intensity and market dominance. Furthermore, M&A activity is quantified, with an evaluation of the value of completed deals and their direct contribution to market consolidation.
Innovation catalysts are thoroughly investigated, including government incentives designed to foster bio-based technologies and significant advancements in biotechnology. The evolving regulatory landscape and its multifaceted influence on market expansion are also critically examined. The impact of alternative products and the shifting preferences of end-users across various sectors, including food & beverage, plastics, pharmaceuticals, and textiles, are assessed in detail. Specific data on market share distribution and M&A deal values (in Millions) are available within the comprehensive report.
Bio-based Platform Chemicals Market Industry Evolution
This section meticulously charts the historical trajectory and future growth potential of the bio-based platform chemicals market. We analyze market growth trends from 2019 to 2033, highlighting key phases of development. Significant technological advancements are explored, with a particular focus on enhancements in fermentation processes and enzymatic catalysis, which are crucial for improving production efficiency and achieving greater cost-effectiveness.
The report details how the escalating global consumer demand for sustainable and eco-friendly products has significantly influenced market expansion. This is supported by quantifiable data, including projected compound annual growth rates (CAGR) and adoption rates of bio-based chemicals across various industrial applications. The influence of external factors, such as fluctuations in raw material prices and the continuous evolution of downstream processing technologies, are also addressed. Detailed analysis encompassing the historical period (2019-2024) and comprehensive projections for the forecast period (2025-2033) are presented.
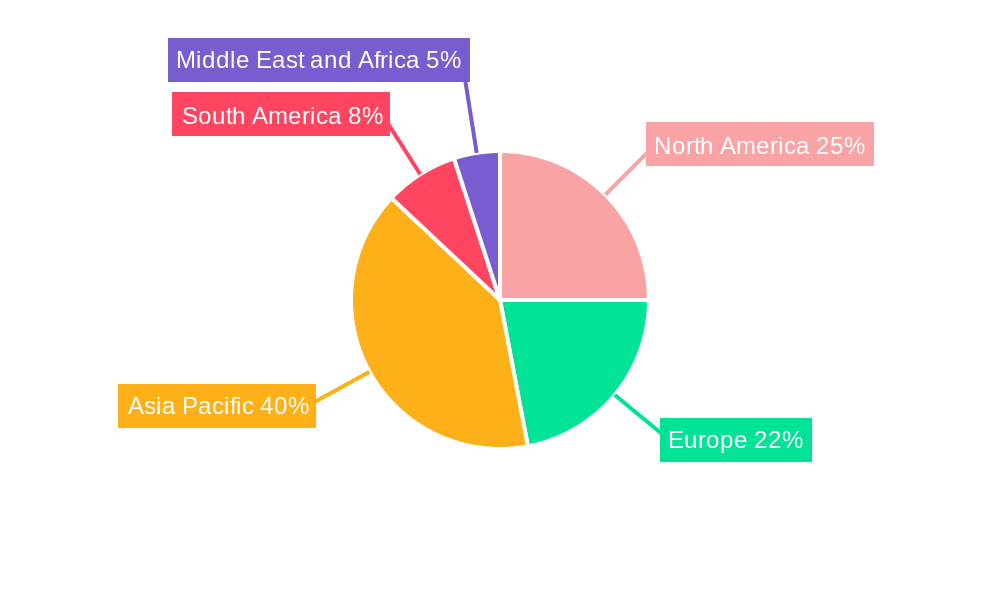
Leading Regions, Countries, or Segments in Bio-based Platform Chemicals Market
This section identifies the leading regions, countries, and segments within the bio-based platform chemicals market. We analyze the dominance of specific product types: Bio Glycerol, Bio Glutamic Acid, Bio Itaconic Acid, Bio-3-Hydroxypropionic Acid, Bio Succinic Acid, and Other Product Types. The analysis includes a deep dive into the key drivers behind the leading segment's success.
- Key Drivers:
- Investment trends in research and development.
- Government policies and regulatory support promoting bio-based solutions.
- Favorable economic conditions and market demand.
- Technological advancements in production and processing.
The report provides an in-depth analysis of the factors contributing to this dominance, including economic conditions, governmental support, and consumer preferences within each region and segment.
Bio-based Platform Chemicals Market Product Innovations
This section highlights recent product innovations, applications, and performance metrics within the bio-based platform chemicals market. We showcase examples of unique selling propositions (USPs) and advancements in technology, highlighting improved yields, reduced production costs, and enhanced material properties. The impact of these innovations on market competitiveness and adoption rates is assessed.
Propelling Factors for Bio-based Platform Chemicals Market Growth
Several factors drive the growth of the bio-based platform chemicals market. Technological advancements, including improved bio-catalysis and fermentation processes, significantly contribute. Favorable government policies and incentives, coupled with increasing consumer awareness of environmental sustainability, further propel the market. The growing demand for bio-based materials from various industries, such as plastics, food & beverage, and pharmaceuticals, accelerates market growth.
Obstacles in the Bio-based Platform Chemicals Market
The bio-based platform chemicals market, while experiencing robust growth, encounters several significant challenges that impact its trajectory. Prominent among these are regulatory hurdles, which encompass the intricate processes for approval and the establishment of standardization for bio-based products, often leading to slower market penetration. Furthermore, the market is susceptible to supply chain disruptions, exacerbated by geopolitical factors and unforeseen events, alongside the inherent volatility in raw material prices, which directly affects production costs and market stability.
Intense competition among established players, coupled with the potential for new entrants to disrupt the market dynamics, adds further complexity. These critical factors, along with their quantifiable impact on overall market growth and investment strategies, are thoroughly examined in this section.
Future Opportunities in Bio-based Platform Chemicals Market
Future opportunities lie in exploring new applications for bio-based platform chemicals across various sectors. The development of novel technologies and processes to enhance efficiency and reduce costs presents significant potential. Changing consumer preferences toward sustainable and eco-friendly products will continue to fuel market expansion. Emerging markets in developing economies offer considerable growth prospects.
Major Players in the Bio-based Platform Chemicals Market Ecosystem
- PTT Global Chemical Public Company Limited
- Cargill Incorporated
- Novozymes
- Braskem
- Evonik Industries AG
- Tokyo Chemical Industry Co Ltd
- BASF SE
- LyondellBasell Industries Holdings B V
- Aktin Chemicals Inc
- DSM
- DuPont
- NIPPON SHOKUBAI CO LTD
- Champlor (Valtris Specialty Chemicals)
- GFBiochemicals Ltd
Key Developments in Bio-based Platform Chemicals Market Industry
- July 2023: Braskem launched its bio-based polyethylene (PE) resin derived from sugarcane.
- October 2022: Evonik introduced its bio-based polyamide 12 from renewable castor oil.
- June 2022: Novozymes partnered with Cargill to develop bio-based food & beverage ingredients.
- March 2021: BASF and Toyota Tsusho formed a joint venture for a bio-based succinic acid plant in Japan.
Strategic Bio-based Platform Chemicals Market Forecast
The bio-based platform chemicals market is projected to experience robust growth, driven by the increasing adoption of sustainable solutions and supportive government regulations. The market's future is promising, fueled by innovation, expanding applications, and a growing awareness of environmental concerns. The continued development of cost-effective and high-performance bio-based materials will be crucial in realizing the market’s full potential.
Bio-based Platform Chemicals Market Segmentation
-
1. Product Type
- 1.1. Bio Glycerol
- 1.2. Bio Glutamic Acid
- 1.3. Bio Itaconic Acid
- 1.4. Bio-3-Hydroxypropionic Acid
- 1.5. Bio Succinic Acid
- 1.6. Other Product Types
Bio-based Platform Chemicals Market Segmentation By Geography
-
1. Asia Pacific
- 1.1. China
- 1.2. India
- 1.3. Japan
- 1.4. South Korea
- 1.5. Rest of Asia Pacific
-
2. North America
- 2.1. United States
- 2.2. Canada
- 2.3. Mexico
-
3. Europe
- 3.1. Germany
- 3.2. United Kingdom
- 3.3. Italy
- 3.4. France
- 3.5. Rest of Europe
-
4. South America
- 4.1. Brazil
- 4.2. Argentina
- 4.3. Rest of South America
-
5. Middle East and Africa
- 5.1. South Africa
- 5.2. Saudi Arabia
- 5.3. Rest of Middle East and Africa
Bio-based Platform Chemicals Market Regional Market Share
Geographic Coverage of Bio-based Platform Chemicals Market
Bio-based Platform Chemicals Market REPORT HIGHLIGHTS
| Aspects | Details |
|---|---|
| Study Period | 2020-2034 |
| Base Year | 2025 |
| Estimated Year | 2026 |
| Forecast Period | 2026-2034 |
| Historical Period | 2020-2025 |
| Growth Rate | CAGR of 6.61% from 2020-2034 |
| Segmentation |
|
Table of Contents
- 1. Introduction
- 1.1. Research Scope
- 1.2. Market Segmentation
- 1.3. Research Objective
- 1.4. Definitions and Assumptions
- 2. Executive Summary
- 2.1. Market Snapshot
- 3. Market Dynamics
- 3.1. Market Drivers
- 3.2. Market Restrains
- 3.3. Market Trends
- 3.4. Market Opportunities
- 4. Market Factor Analysis
- 4.1. Porters Five Forces
- 4.1.1. Bargaining Power of Suppliers
- 4.1.2. Bargaining Power of Buyers
- 4.1.3. Threat of New Entrants
- 4.1.4. Threat of Substitutes
- 4.1.5. Competitive Rivalry
- 4.2. PESTEL analysis
- 4.3. BCG Analysis
- 4.3.1. Stars (High Growth, High Market Share)
- 4.3.2. Cash Cows (Low Growth, High Market Share)
- 4.3.3. Question Mark (High Growth, Low Market Share)
- 4.3.4. Dogs (Low Growth, Low Market Share)
- 4.4. Ansoff Matrix Analysis
- 4.5. Supply Chain Analysis
- 4.6. Regulatory Landscape
- 4.7. Current Market Potential and Opportunity Assessment (TAM–SAM–SOM Framework)
- 4.8. DMV Analyst Note
- 4.1. Porters Five Forces
- 5. Market Analysis, Insights and Forecast 2021-2033
- 5.1. Market Analysis, Insights and Forecast - by Product Type
- 5.1.1. Bio Glycerol
- 5.1.2. Bio Glutamic Acid
- 5.1.3. Bio Itaconic Acid
- 5.1.4. Bio-3-Hydroxypropionic Acid
- 5.1.5. Bio Succinic Acid
- 5.1.6. Other Product Types
- 5.2. Market Analysis, Insights and Forecast - by Region
- 5.2.1. Asia Pacific
- 5.2.2. North America
- 5.2.3. Europe
- 5.2.4. South America
- 5.2.5. Middle East and Africa
- 5.1. Market Analysis, Insights and Forecast - by Product Type
- 6. Global Bio-based Platform Chemicals Market Analysis, Insights and Forecast, 2021-2033
- 6.1. Market Analysis, Insights and Forecast - by Product Type
- 6.1.1. Bio Glycerol
- 6.1.2. Bio Glutamic Acid
- 6.1.3. Bio Itaconic Acid
- 6.1.4. Bio-3-Hydroxypropionic Acid
- 6.1.5. Bio Succinic Acid
- 6.1.6. Other Product Types
- 6.1. Market Analysis, Insights and Forecast - by Product Type
- 7. Asia Pacific Bio-based Platform Chemicals Market Analysis, Insights and Forecast, 2020-2032
- 7.1. Market Analysis, Insights and Forecast - by Product Type
- 7.1.1. Bio Glycerol
- 7.1.2. Bio Glutamic Acid
- 7.1.3. Bio Itaconic Acid
- 7.1.4. Bio-3-Hydroxypropionic Acid
- 7.1.5. Bio Succinic Acid
- 7.1.6. Other Product Types
- 7.1. Market Analysis, Insights and Forecast - by Product Type
- 8. North America Bio-based Platform Chemicals Market Analysis, Insights and Forecast, 2020-2032
- 8.1. Market Analysis, Insights and Forecast - by Product Type
- 8.1.1. Bio Glycerol
- 8.1.2. Bio Glutamic Acid
- 8.1.3. Bio Itaconic Acid
- 8.1.4. Bio-3-Hydroxypropionic Acid
- 8.1.5. Bio Succinic Acid
- 8.1.6. Other Product Types
- 8.1. Market Analysis, Insights and Forecast - by Product Type
- 9. Europe Bio-based Platform Chemicals Market Analysis, Insights and Forecast, 2020-2032
- 9.1. Market Analysis, Insights and Forecast - by Product Type
- 9.1.1. Bio Glycerol
- 9.1.2. Bio Glutamic Acid
- 9.1.3. Bio Itaconic Acid
- 9.1.4. Bio-3-Hydroxypropionic Acid
- 9.1.5. Bio Succinic Acid
- 9.1.6. Other Product Types
- 9.1. Market Analysis, Insights and Forecast - by Product Type
- 10. South America Bio-based Platform Chemicals Market Analysis, Insights and Forecast, 2020-2032
- 10.1. Market Analysis, Insights and Forecast - by Product Type
- 10.1.1. Bio Glycerol
- 10.1.2. Bio Glutamic Acid
- 10.1.3. Bio Itaconic Acid
- 10.1.4. Bio-3-Hydroxypropionic Acid
- 10.1.5. Bio Succinic Acid
- 10.1.6. Other Product Types
- 10.1. Market Analysis, Insights and Forecast - by Product Type
- 11. Middle East and Africa Bio-based Platform Chemicals Market Analysis, Insights and Forecast, 2020-2032
- 11.1. Market Analysis, Insights and Forecast - by Product Type
- 11.1.1. Bio Glycerol
- 11.1.2. Bio Glutamic Acid
- 11.1.3. Bio Itaconic Acid
- 11.1.4. Bio-3-Hydroxypropionic Acid
- 11.1.5. Bio Succinic Acid
- 11.1.6. Other Product Types
- 11.1. Market Analysis, Insights and Forecast - by Product Type
- 12. Competitive Analysis
- 12.1. Company Profiles
- 12.1.1 PTT Global Chemical Public Company Limited
- 12.1.1.1. Company Overview
- 12.1.1.2. Products
- 12.1.1.3. Company Financials
- 12.1.1.4. SWOT Analysis
- 12.1.2 Cargill Incorporated
- 12.1.2.1. Company Overview
- 12.1.2.2. Products
- 12.1.2.3. Company Financials
- 12.1.2.4. SWOT Analysis
- 12.1.3 Novozymes
- 12.1.3.1. Company Overview
- 12.1.3.2. Products
- 12.1.3.3. Company Financials
- 12.1.3.4. SWOT Analysis
- 12.1.4 Braskem
- 12.1.4.1. Company Overview
- 12.1.4.2. Products
- 12.1.4.3. Company Financials
- 12.1.4.4. SWOT Analysis
- 12.1.5 Evonik Industries AG
- 12.1.5.1. Company Overview
- 12.1.5.2. Products
- 12.1.5.3. Company Financials
- 12.1.5.4. SWOT Analysis
- 12.1.6 Tokyo Chemical Industry Co Ltd *List Not Exhaustive
- 12.1.6.1. Company Overview
- 12.1.6.2. Products
- 12.1.6.3. Company Financials
- 12.1.6.4. SWOT Analysis
- 12.1.7 BASF SE
- 12.1.7.1. Company Overview
- 12.1.7.2. Products
- 12.1.7.3. Company Financials
- 12.1.7.4. SWOT Analysis
- 12.1.8 LyondellBasell Industries Holdings B V
- 12.1.8.1. Company Overview
- 12.1.8.2. Products
- 12.1.8.3. Company Financials
- 12.1.8.4. SWOT Analysis
- 12.1.9 Aktin Chemicals Inc
- 12.1.9.1. Company Overview
- 12.1.9.2. Products
- 12.1.9.3. Company Financials
- 12.1.9.4. SWOT Analysis
- 12.1.10 DSM
- 12.1.10.1. Company Overview
- 12.1.10.2. Products
- 12.1.10.3. Company Financials
- 12.1.10.4. SWOT Analysis
- 12.1.11 DuPont
- 12.1.11.1. Company Overview
- 12.1.11.2. Products
- 12.1.11.3. Company Financials
- 12.1.11.4. SWOT Analysis
- 12.1.12 NIPPON SHOKUBAI CO LTD
- 12.1.12.1. Company Overview
- 12.1.12.2. Products
- 12.1.12.3. Company Financials
- 12.1.12.4. SWOT Analysis
- 12.1.13 Champlor (Valtris Specialty Chemicals)
- 12.1.13.1. Company Overview
- 12.1.13.2. Products
- 12.1.13.3. Company Financials
- 12.1.13.4. SWOT Analysis
- 12.1.14 GFBiochemicals Ltd
- 12.1.14.1. Company Overview
- 12.1.14.2. Products
- 12.1.14.3. Company Financials
- 12.1.14.4. SWOT Analysis
- 12.1.1 PTT Global Chemical Public Company Limited
- 12.2. Market Entropy
- 12.2.1 Company's Key Areas Served
- 12.2.2 Recent Developments
- 12.3. Company Market Share Analysis 2025
- 12.3.1 Top 5 Companies Market Share Analysis
- 12.3.2 Top 3 Companies Market Share Analysis
- 12.4. List of Potential Customers
- 13. Research Methodology
List of Figures
- Figure 1: Global Bio-based Platform Chemicals Market Revenue Breakdown (Million, %) by Region 2025 & 2033
- Figure 2: Global Bio-based Platform Chemicals Market Volume Breakdown (K Tons, %) by Region 2025 & 2033
- Figure 3: Asia Pacific Bio-based Platform Chemicals Market Revenue (Million), by Product Type 2025 & 2033
- Figure 4: Asia Pacific Bio-based Platform Chemicals Market Volume (K Tons), by Product Type 2025 & 2033
- Figure 5: Asia Pacific Bio-based Platform Chemicals Market Revenue Share (%), by Product Type 2025 & 2033
- Figure 6: Asia Pacific Bio-based Platform Chemicals Market Volume Share (%), by Product Type 2025 & 2033
- Figure 7: Asia Pacific Bio-based Platform Chemicals Market Revenue (Million), by Country 2025 & 2033
- Figure 8: Asia Pacific Bio-based Platform Chemicals Market Volume (K Tons), by Country 2025 & 2033
- Figure 9: Asia Pacific Bio-based Platform Chemicals Market Revenue Share (%), by Country 2025 & 2033
- Figure 10: Asia Pacific Bio-based Platform Chemicals Market Volume Share (%), by Country 2025 & 2033
- Figure 11: North America Bio-based Platform Chemicals Market Revenue (Million), by Product Type 2025 & 2033
- Figure 12: North America Bio-based Platform Chemicals Market Volume (K Tons), by Product Type 2025 & 2033
- Figure 13: North America Bio-based Platform Chemicals Market Revenue Share (%), by Product Type 2025 & 2033
- Figure 14: North America Bio-based Platform Chemicals Market Volume Share (%), by Product Type 2025 & 2033
- Figure 15: North America Bio-based Platform Chemicals Market Revenue (Million), by Country 2025 & 2033
- Figure 16: North America Bio-based Platform Chemicals Market Volume (K Tons), by Country 2025 & 2033
- Figure 17: North America Bio-based Platform Chemicals Market Revenue Share (%), by Country 2025 & 2033
- Figure 18: North America Bio-based Platform Chemicals Market Volume Share (%), by Country 2025 & 2033
- Figure 19: Europe Bio-based Platform Chemicals Market Revenue (Million), by Product Type 2025 & 2033
- Figure 20: Europe Bio-based Platform Chemicals Market Volume (K Tons), by Product Type 2025 & 2033
- Figure 21: Europe Bio-based Platform Chemicals Market Revenue Share (%), by Product Type 2025 & 2033
- Figure 22: Europe Bio-based Platform Chemicals Market Volume Share (%), by Product Type 2025 & 2033
- Figure 23: Europe Bio-based Platform Chemicals Market Revenue (Million), by Country 2025 & 2033
- Figure 24: Europe Bio-based Platform Chemicals Market Volume (K Tons), by Country 2025 & 2033
- Figure 25: Europe Bio-based Platform Chemicals Market Revenue Share (%), by Country 2025 & 2033
- Figure 26: Europe Bio-based Platform Chemicals Market Volume Share (%), by Country 2025 & 2033
- Figure 27: South America Bio-based Platform Chemicals Market Revenue (Million), by Product Type 2025 & 2033
- Figure 28: South America Bio-based Platform Chemicals Market Volume (K Tons), by Product Type 2025 & 2033
- Figure 29: South America Bio-based Platform Chemicals Market Revenue Share (%), by Product Type 2025 & 2033
- Figure 30: South America Bio-based Platform Chemicals Market Volume Share (%), by Product Type 2025 & 2033
- Figure 31: South America Bio-based Platform Chemicals Market Revenue (Million), by Country 2025 & 2033
- Figure 32: South America Bio-based Platform Chemicals Market Volume (K Tons), by Country 2025 & 2033
- Figure 33: South America Bio-based Platform Chemicals Market Revenue Share (%), by Country 2025 & 2033
- Figure 34: South America Bio-based Platform Chemicals Market Volume Share (%), by Country 2025 & 2033
- Figure 35: Middle East and Africa Bio-based Platform Chemicals Market Revenue (Million), by Product Type 2025 & 2033
- Figure 36: Middle East and Africa Bio-based Platform Chemicals Market Volume (K Tons), by Product Type 2025 & 2033
- Figure 37: Middle East and Africa Bio-based Platform Chemicals Market Revenue Share (%), by Product Type 2025 & 2033
- Figure 38: Middle East and Africa Bio-based Platform Chemicals Market Volume Share (%), by Product Type 2025 & 2033
- Figure 39: Middle East and Africa Bio-based Platform Chemicals Market Revenue (Million), by Country 2025 & 2033
- Figure 40: Middle East and Africa Bio-based Platform Chemicals Market Volume (K Tons), by Country 2025 & 2033
- Figure 41: Middle East and Africa Bio-based Platform Chemicals Market Revenue Share (%), by Country 2025 & 2033
- Figure 42: Middle East and Africa Bio-based Platform Chemicals Market Volume Share (%), by Country 2025 & 2033
List of Tables
- Table 1: Global Bio-based Platform Chemicals Market Revenue Million Forecast, by Product Type 2020 & 2033
- Table 2: Global Bio-based Platform Chemicals Market Volume K Tons Forecast, by Product Type 2020 & 2033
- Table 3: Global Bio-based Platform Chemicals Market Revenue Million Forecast, by Region 2020 & 2033
- Table 4: Global Bio-based Platform Chemicals Market Volume K Tons Forecast, by Region 2020 & 2033
- Table 5: Global Bio-based Platform Chemicals Market Revenue Million Forecast, by Product Type 2020 & 2033
- Table 6: Global Bio-based Platform Chemicals Market Volume K Tons Forecast, by Product Type 2020 & 2033
- Table 7: Global Bio-based Platform Chemicals Market Revenue Million Forecast, by Country 2020 & 2033
- Table 8: Global Bio-based Platform Chemicals Market Volume K Tons Forecast, by Country 2020 & 2033
- Table 9: China Bio-based Platform Chemicals Market Revenue (Million) Forecast, by Application 2020 & 2033
- Table 10: China Bio-based Platform Chemicals Market Volume (K Tons) Forecast, by Application 2020 & 2033
- Table 11: India Bio-based Platform Chemicals Market Revenue (Million) Forecast, by Application 2020 & 2033
- Table 12: India Bio-based Platform Chemicals Market Volume (K Tons) Forecast, by Application 2020 & 2033
- Table 13: Japan Bio-based Platform Chemicals Market Revenue (Million) Forecast, by Application 2020 & 2033
- Table 14: Japan Bio-based Platform Chemicals Market Volume (K Tons) Forecast, by Application 2020 & 2033
- Table 15: South Korea Bio-based Platform Chemicals Market Revenue (Million) Forecast, by Application 2020 & 2033
- Table 16: South Korea Bio-based Platform Chemicals Market Volume (K Tons) Forecast, by Application 2020 & 2033
- Table 17: Rest of Asia Pacific Bio-based Platform Chemicals Market Revenue (Million) Forecast, by Application 2020 & 2033
- Table 18: Rest of Asia Pacific Bio-based Platform Chemicals Market Volume (K Tons) Forecast, by Application 2020 & 2033
- Table 19: Global Bio-based Platform Chemicals Market Revenue Million Forecast, by Product Type 2020 & 2033
- Table 20: Global Bio-based Platform Chemicals Market Volume K Tons Forecast, by Product Type 2020 & 2033
- Table 21: Global Bio-based Platform Chemicals Market Revenue Million Forecast, by Country 2020 & 2033
- Table 22: Global Bio-based Platform Chemicals Market Volume K Tons Forecast, by Country 2020 & 2033
- Table 23: United States Bio-based Platform Chemicals Market Revenue (Million) Forecast, by Application 2020 & 2033
- Table 24: United States Bio-based Platform Chemicals Market Volume (K Tons) Forecast, by Application 2020 & 2033
- Table 25: Canada Bio-based Platform Chemicals Market Revenue (Million) Forecast, by Application 2020 & 2033
- Table 26: Canada Bio-based Platform Chemicals Market Volume (K Tons) Forecast, by Application 2020 & 2033
- Table 27: Mexico Bio-based Platform Chemicals Market Revenue (Million) Forecast, by Application 2020 & 2033
- Table 28: Mexico Bio-based Platform Chemicals Market Volume (K Tons) Forecast, by Application 2020 & 2033
- Table 29: Global Bio-based Platform Chemicals Market Revenue Million Forecast, by Product Type 2020 & 2033
- Table 30: Global Bio-based Platform Chemicals Market Volume K Tons Forecast, by Product Type 2020 & 2033
- Table 31: Global Bio-based Platform Chemicals Market Revenue Million Forecast, by Country 2020 & 2033
- Table 32: Global Bio-based Platform Chemicals Market Volume K Tons Forecast, by Country 2020 & 2033
- Table 33: Germany Bio-based Platform Chemicals Market Revenue (Million) Forecast, by Application 2020 & 2033
- Table 34: Germany Bio-based Platform Chemicals Market Volume (K Tons) Forecast, by Application 2020 & 2033
- Table 35: United Kingdom Bio-based Platform Chemicals Market Revenue (Million) Forecast, by Application 2020 & 2033
- Table 36: United Kingdom Bio-based Platform Chemicals Market Volume (K Tons) Forecast, by Application 2020 & 2033
- Table 37: Italy Bio-based Platform Chemicals Market Revenue (Million) Forecast, by Application 2020 & 2033
- Table 38: Italy Bio-based Platform Chemicals Market Volume (K Tons) Forecast, by Application 2020 & 2033
- Table 39: France Bio-based Platform Chemicals Market Revenue (Million) Forecast, by Application 2020 & 2033
- Table 40: France Bio-based Platform Chemicals Market Volume (K Tons) Forecast, by Application 2020 & 2033
- Table 41: Rest of Europe Bio-based Platform Chemicals Market Revenue (Million) Forecast, by Application 2020 & 2033
- Table 42: Rest of Europe Bio-based Platform Chemicals Market Volume (K Tons) Forecast, by Application 2020 & 2033
- Table 43: Global Bio-based Platform Chemicals Market Revenue Million Forecast, by Product Type 2020 & 2033
- Table 44: Global Bio-based Platform Chemicals Market Volume K Tons Forecast, by Product Type 2020 & 2033
- Table 45: Global Bio-based Platform Chemicals Market Revenue Million Forecast, by Country 2020 & 2033
- Table 46: Global Bio-based Platform Chemicals Market Volume K Tons Forecast, by Country 2020 & 2033
- Table 47: Brazil Bio-based Platform Chemicals Market Revenue (Million) Forecast, by Application 2020 & 2033
- Table 48: Brazil Bio-based Platform Chemicals Market Volume (K Tons) Forecast, by Application 2020 & 2033
- Table 49: Argentina Bio-based Platform Chemicals Market Revenue (Million) Forecast, by Application 2020 & 2033
- Table 50: Argentina Bio-based Platform Chemicals Market Volume (K Tons) Forecast, by Application 2020 & 2033
- Table 51: Rest of South America Bio-based Platform Chemicals Market Revenue (Million) Forecast, by Application 2020 & 2033
- Table 52: Rest of South America Bio-based Platform Chemicals Market Volume (K Tons) Forecast, by Application 2020 & 2033
- Table 53: Global Bio-based Platform Chemicals Market Revenue Million Forecast, by Product Type 2020 & 2033
- Table 54: Global Bio-based Platform Chemicals Market Volume K Tons Forecast, by Product Type 2020 & 2033
- Table 55: Global Bio-based Platform Chemicals Market Revenue Million Forecast, by Country 2020 & 2033
- Table 56: Global Bio-based Platform Chemicals Market Volume K Tons Forecast, by Country 2020 & 2033
- Table 57: South Africa Bio-based Platform Chemicals Market Revenue (Million) Forecast, by Application 2020 & 2033
- Table 58: South Africa Bio-based Platform Chemicals Market Volume (K Tons) Forecast, by Application 2020 & 2033
- Table 59: Saudi Arabia Bio-based Platform Chemicals Market Revenue (Million) Forecast, by Application 2020 & 2033
- Table 60: Saudi Arabia Bio-based Platform Chemicals Market Volume (K Tons) Forecast, by Application 2020 & 2033
- Table 61: Rest of Middle East and Africa Bio-based Platform Chemicals Market Revenue (Million) Forecast, by Application 2020 & 2033
- Table 62: Rest of Middle East and Africa Bio-based Platform Chemicals Market Volume (K Tons) Forecast, by Application 2020 & 2033
Frequently Asked Questions
1. What is the projected Compound Annual Growth Rate (CAGR) of the Bio-based Platform Chemicals Market?
The projected CAGR is approximately 6.61%.
2. Which companies are prominent players in the Bio-based Platform Chemicals Market?
Key companies in the market include PTT Global Chemical Public Company Limited, Cargill Incorporated, Novozymes, Braskem, Evonik Industries AG, Tokyo Chemical Industry Co Ltd *List Not Exhaustive, BASF SE, LyondellBasell Industries Holdings B V, Aktin Chemicals Inc, DSM, DuPont, NIPPON SHOKUBAI CO LTD, Champlor (Valtris Specialty Chemicals), GFBiochemicals Ltd.
3. What are the main segments of the Bio-based Platform Chemicals Market?
The market segments include Product Type.
4. Can you provide details about the market size?
The market size is estimated to be USD 15.41 Million as of 2022.
5. What are some drivers contributing to market growth?
Favorable Government Regulations for Bio-Based Platform Chemicals; Consumer Inclination Towards the Use of Environmental Friendly and Sustainable Products; Other Drivers.
6. What are the notable trends driving market growth?
Bio-Itaconic acid (IA) Segment to Witness Strong Growth.
7. Are there any restraints impacting market growth?
High Cost of Production; Other Restraints.
8. Can you provide examples of recent developments in the market?
Product Launches: Braskem announced the launch of its bio-based polyethylene (PE) resin, which is derived from sugarcane. Evonik introduced its bio-based polyamide 12, which is produced from renewable castor oil.
9. What pricing options are available for accessing the report?
Pricing options include single-user, multi-user, and enterprise licenses priced at USD 4750, USD 5250, and USD 8750 respectively.
10. Is the market size provided in terms of value or volume?
The market size is provided in terms of value, measured in Million and volume, measured in K Tons.
11. Are there any specific market keywords associated with the report?
Yes, the market keyword associated with the report is "Bio-based Platform Chemicals Market," which aids in identifying and referencing the specific market segment covered.
12. How do I determine which pricing option suits my needs best?
The pricing options vary based on user requirements and access needs. Individual users may opt for single-user licenses, while businesses requiring broader access may choose multi-user or enterprise licenses for cost-effective access to the report.
13. Are there any additional resources or data provided in the Bio-based Platform Chemicals Market report?
While the report offers comprehensive insights, it's advisable to review the specific contents or supplementary materials provided to ascertain if additional resources or data are available.
14. How can I stay updated on further developments or reports in the Bio-based Platform Chemicals Market?
To stay informed about further developments, trends, and reports in the Bio-based Platform Chemicals Market, consider subscribing to industry newsletters, following relevant companies and organizations, or regularly checking reputable industry news sources and publications.
Methodology
Step 1 - Identification of Relevant Samples Size from Population Database


Step 2 - Approaches for Defining Global Market Size (Value, Volume* & Price*)

Note*: In applicable scenarios
Step 3 - Data Sources
Primary Research
- Web Analytics
- Survey Reports
- Research Institute
- Latest Research Reports
- Opinion Leaders
Secondary Research
- Annual Reports
- White Paper
- Latest Press Release
- Industry Association
- Paid Database
- Investor Presentations

Step 4 - Data Triangulation
Involves using different sources of information in order to increase the validity of a study
These sources are likely to be stakeholders in a program - participants, other researchers, program staff, other community members, and so on.
Then we put all data in single framework & apply various statistical tools to find out the dynamic on the market.
During the analysis stage, feedback from the stakeholder groups would be compared to determine areas of agreement as well as areas of divergence