

Key Insights
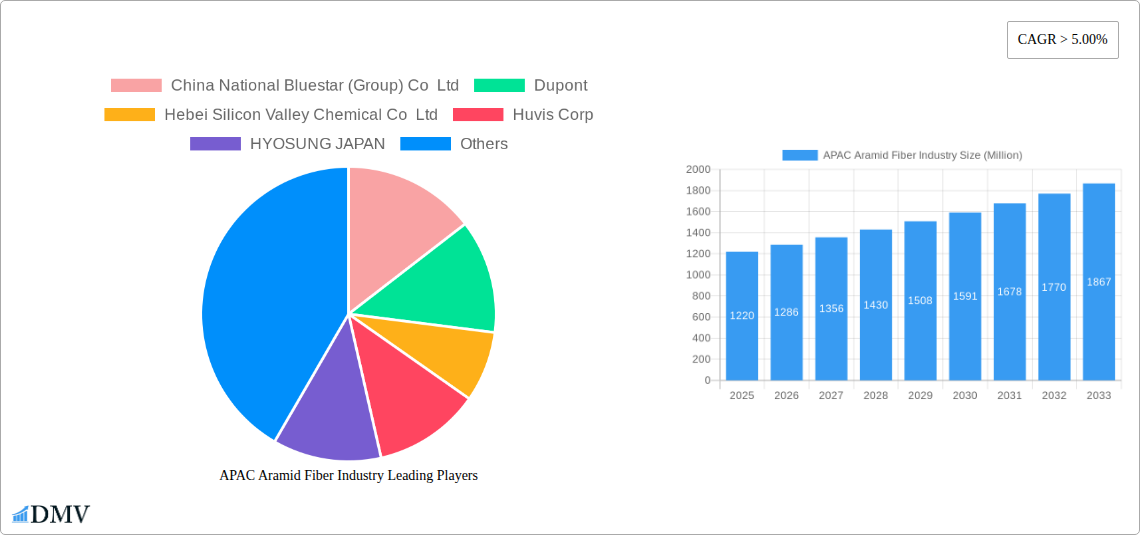
The APAC aramid fiber market, valued at $1.22 billion in 2025, is poised for robust growth, exhibiting a Compound Annual Growth Rate (CAGR) exceeding 5% from 2025 to 2033. This expansion is driven by several key factors. The burgeoning automotive industry in the region, particularly in China and India, fuels significant demand for lightweight, high-strength materials like aramid fibers in vehicles, contributing to enhanced fuel efficiency and safety. Furthermore, the increasing adoption of aramid fibers in protective apparel, particularly within the industrial and military sectors, significantly boosts market growth. The rising focus on infrastructure development across APAC, including the construction of bridges and high-speed rail lines, also presents substantial opportunities. Technological advancements leading to enhanced fiber properties, such as improved heat resistance and tensile strength, further stimulate market expansion. Competitive landscape analysis reveals key players like China National Bluestar, DuPont, and Teijin Aramid actively contributing to market growth through innovation and expansion strategies.
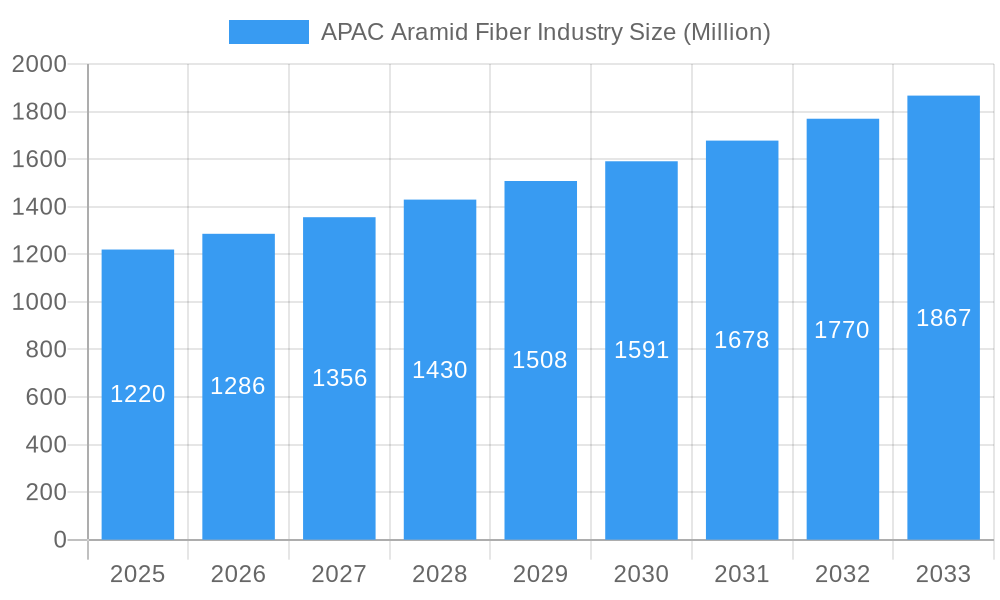
APAC Aramid Fiber Industry Market Size (In Billion)
However, certain challenges persist. Fluctuations in raw material prices, particularly para-aramid, can impact profitability and market stability. Furthermore, the relatively high cost of aramid fibers compared to alternative materials, such as nylon and polyester, might limit widespread adoption in certain applications. Despite these restraints, the long-term outlook for the APAC aramid fiber market remains optimistic, driven by sustained economic growth, industrialization, and increasing safety consciousness across the region. The market is segmented based on fiber type (para-aramid, meta-aramid), application (automotive, protective apparel, industrial), and end-use industry. A deeper dive into these segments reveals further nuances in market dynamics and growth potential within specific niches. Continued investments in research and development, along with strategic partnerships and collaborations, are expected to shape the future trajectory of this dynamic market.
APAC Aramid Fiber Industry Company Market Share
APAC Aramid Fiber Industry Market Report: 2019-2033 Forecast
This comprehensive report provides an in-depth analysis of the Asia-Pacific (APAC) aramid fiber industry, offering valuable insights for stakeholders seeking to navigate this dynamic market. Covering the period from 2019 to 2033, with a base year of 2025 and a forecast period of 2025-2033, this study reveals crucial market trends, growth drivers, and challenges. The report features an analysis of key players including China National Bluestar (Group) Co Ltd, DuPont, Hebei Silicon Valley Chemical Co Ltd, Huvis Corp, HYOSUNG JAPAN, KERMEL, Kolon Industries Inc, Shanghai J&S New Materials Co ltd, Teijin Aramid, TORAY INDUSTRIES INC, X-FIPER New Material Co Ltd, and Yantai Tayho Advanced Materials Co Ltd (list not exhaustive). Expect detailed breakdowns of market segments, revealing lucrative opportunities for investment and expansion. The total market value is predicted to reach xx Million by 2033.
APAC Aramid Fiber Industry Market Composition & Trends
This section dissects the competitive landscape of the APAC aramid fiber market, analyzing market concentration, innovation, regulatory factors, substitute materials, end-user behavior, and merger & acquisition (M&A) activities. We delve into the market share distribution among key players, revealing the dominance of specific companies and outlining strategic alliances. Furthermore, the report quantifies the value of significant M&A deals impacting the industry landscape. The analysis explores how regulatory changes influence market dynamics and the impact of substitute materials on market growth. We also provide detailed profiles of end-users and their evolving needs, shaping future market demand. The report estimates the market size to be xx Million in 2025.
- Market Concentration: Analysis of market share held by top 5 players. (e.g., Company A: 25%, Company B: 20%, etc.)
- Innovation Catalysts: Examination of R&D investments and technological advancements driving market innovation.
- Regulatory Landscape: Assessment of existing regulations and their impact on market expansion.
- Substitute Products: Analysis of competing materials and their market penetration.
- End-User Profiles: Identification of key end-use sectors and their respective growth rates.
- M&A Activity: Review of significant mergers and acquisitions, quantifying deal values in Millions.
APAC Aramid Fiber Industry Industry Evolution
This section examines the evolution of the APAC aramid fiber industry, tracing its historical trajectory (2019-2024) and projecting future growth (2025-2033). We analyze market growth trajectories, identifying periods of expansion and contraction. Technological advancements are thoroughly examined, assessing their influence on production efficiency and product quality. We explore shifting consumer preferences and their impact on market demand, incorporating specific data points such as annual growth rates and adoption metrics for new technologies. The report forecasts a Compound Annual Growth Rate (CAGR) of xx% during the forecast period (2025-2033).
Leading Regions, Countries, or Segments in APAC Aramid Fiber Industry
This section identifies the leading regions, countries, or segments within the APAC aramid fiber market, highlighting their dominant role and the underlying factors driving this dominance.
Key Drivers (Bullet Points):
- Favorable government policies and investment incentives.
- Strong presence of major manufacturers.
- High demand from key industries (e.g., aerospace, automotive).
- Abundant raw material supply.
- Robust infrastructure.
In-depth Analysis (Paragraphs): Detailed explanation of why specific regions or segments outperform others, analyzing economic factors, regulatory landscapes, and industrial clusters.
APAC Aramid Fiber Industry Product Innovations
This section details recent product innovations, exploring their applications and performance metrics. We highlight unique selling propositions (USPs) of new aramid fiber products and showcase technological advancements that enhance performance characteristics such as strength, durability, and heat resistance. The discussion includes new applications driving market expansion.
Propelling Factors for APAP Aramid Fiber Industry Growth
This section identifies and analyzes the key drivers stimulating growth in the APAC aramid fiber industry. This includes technological advancements leading to enhanced product capabilities and cost reductions, favorable economic conditions boosting investment, and supportive government regulations fostering industry expansion. Specific examples will illustrate each driver's impact.
Obstacles in the APAC Aramid Fiber Industry Market
This section examines challenges and restraints hindering market growth, including regulatory hurdles impacting production and distribution, supply chain disruptions causing production delays, and intense competitive pressures squeezing profit margins. Quantifiable impacts of these challenges are presented.
Future Opportunities in APAC Aramid Fiber Industry
This section highlights promising future opportunities, including new market segments ripe for expansion, innovative technologies promising increased efficiency, and emerging consumer trends shaping future demand.
Major Players in the APAC Aramid Fiber Industry Ecosystem
- China National Bluestar (Group) Co Ltd
- Dupont
- Hebei Silicon Valley Chemical Co Ltd
- Huvis Corp
- HYOSUNG JAPAN
- KERMEL
- Kolon Industries Inc
- Shanghai J&S New Materials Co ltd
- Teijin Aramid
- TORAY INDUSTRIES INC
- X-FIPER New Material Co Ltd
- Yantai Tayho Advanced Materials Co Ltd
Key Developments in APAC Aramid Fiber Industry Industry
- [Month, Year]: [Description of key development and its impact]
- [Month, Year]: [Description of key development and its impact]
- [Month, Year]: [Description of key development and its impact]
Strategic APAC Aramid Fiber Industry Market Forecast
This section summarizes the key growth catalysts identified in the report, focusing on future opportunities and the market's overall potential. We consolidate the findings to provide a concise overview of the expected trajectory of the APAC aramid fiber industry, emphasizing the long-term prospects for growth and investment.
APAC Aramid Fiber Industry Segmentation
-
1. Product Type
- 1.1. Para-aramid
- 1.2. Meta-aramid
-
2. End-user Industry
- 2.1. Aerospace and Defense
- 2.2. Automotive
- 2.3. Electrical and Electronics
- 2.4. Sporting Goods
- 2.5. Other En
-
3. Geography
-
3.1. Asia-Pacific
- 3.1.1. China
- 3.1.2. India
- 3.1.3. Japan
- 3.1.4. South Korea
- 3.1.5. Malaysia
- 3.1.6. Thailand
- 3.1.7. Indonesia
- 3.1.8. Vietnam
- 3.1.9. Rest of Asia-Pacific
-
3.1. Asia-Pacific
APAC Aramid Fiber Industry Segmentation By Geography
-
1. Asia Pacific
- 1.1. China
- 1.2. India
- 1.3. Japan
- 1.4. South Korea
- 1.5. Malaysia
- 1.6. Thailand
- 1.7. Indonesia
- 1.8. Vietnam
- 1.9. Rest of Asia Pacific
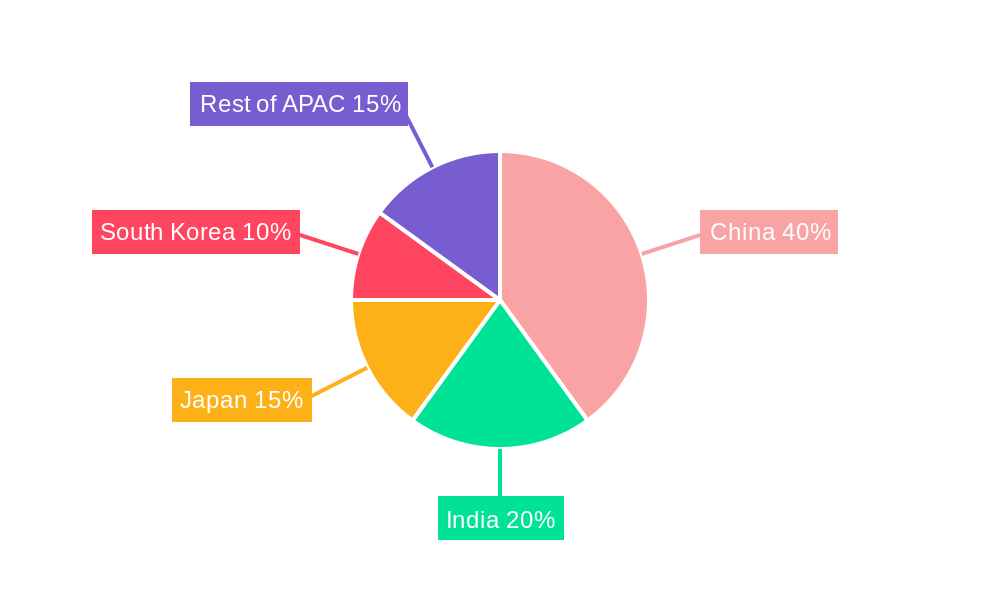
APAC Aramid Fiber Industry Regional Market Share
Geographic Coverage of APAC Aramid Fiber Industry
APAC Aramid Fiber Industry REPORT HIGHLIGHTS
| Aspects | Details |
|---|---|
| Study Period | 2020-2034 |
| Base Year | 2025 |
| Estimated Year | 2026 |
| Forecast Period | 2026-2034 |
| Historical Period | 2020-2025 |
| Growth Rate | CAGR of > 5.00% from 2020-2034 |
| Segmentation |
|
Table of Contents
- 1. Introduction
- 1.1. Research Scope
- 1.2. Market Segmentation
- 1.3. Research Objective
- 1.4. Definitions and Assumptions
- 2. Executive Summary
- 2.1. Market Snapshot
- 3. Market Dynamics
- 3.1. Market Drivers
- 3.2. Market Restrains
- 3.3. Market Trends
- 3.4. Market Opportunities
- 4. Market Factor Analysis
- 4.1. Porters Five Forces
- 4.1.1. Bargaining Power of Suppliers
- 4.1.2. Bargaining Power of Buyers
- 4.1.3. Threat of New Entrants
- 4.1.4. Threat of Substitutes
- 4.1.5. Competitive Rivalry
- 4.2. PESTEL analysis
- 4.3. BCG Analysis
- 4.3.1. Stars (High Growth, High Market Share)
- 4.3.2. Cash Cows (Low Growth, High Market Share)
- 4.3.3. Question Mark (High Growth, Low Market Share)
- 4.3.4. Dogs (Low Growth, Low Market Share)
- 4.4. Ansoff Matrix Analysis
- 4.5. Supply Chain Analysis
- 4.6. Regulatory Landscape
- 4.7. Current Market Potential and Opportunity Assessment (TAM–SAM–SOM Framework)
- 4.8. DMV Analyst Note
- 4.1. Porters Five Forces
- 5. Market Analysis, Insights and Forecast 2021-2033
- 5.1. Market Analysis, Insights and Forecast - by Product Type
- 5.1.1. Para-aramid
- 5.1.2. Meta-aramid
- 5.2. Market Analysis, Insights and Forecast - by End-user Industry
- 5.2.1. Aerospace and Defense
- 5.2.2. Automotive
- 5.2.3. Electrical and Electronics
- 5.2.4. Sporting Goods
- 5.2.5. Other En
- 5.3. Market Analysis, Insights and Forecast - by Geography
- 5.3.1. Asia-Pacific
- 5.3.1.1. China
- 5.3.1.2. India
- 5.3.1.3. Japan
- 5.3.1.4. South Korea
- 5.3.1.5. Malaysia
- 5.3.1.6. Thailand
- 5.3.1.7. Indonesia
- 5.3.1.8. Vietnam
- 5.3.1.9. Rest of Asia-Pacific
- 5.3.1. Asia-Pacific
- 5.4. Market Analysis, Insights and Forecast - by Region
- 5.4.1. Asia Pacific
- 5.1. Market Analysis, Insights and Forecast - by Product Type
- 6. Global APAC Aramid Fiber Industry Analysis, Insights and Forecast, 2021-2033
- 6.1. Market Analysis, Insights and Forecast - by Product Type
- 6.1.1. Para-aramid
- 6.1.2. Meta-aramid
- 6.2. Market Analysis, Insights and Forecast - by End-user Industry
- 6.2.1. Aerospace and Defense
- 6.2.2. Automotive
- 6.2.3. Electrical and Electronics
- 6.2.4. Sporting Goods
- 6.2.5. Other En
- 6.3. Market Analysis, Insights and Forecast - by Geography
- 6.3.1. Asia-Pacific
- 6.3.1.1. China
- 6.3.1.2. India
- 6.3.1.3. Japan
- 6.3.1.4. South Korea
- 6.3.1.5. Malaysia
- 6.3.1.6. Thailand
- 6.3.1.7. Indonesia
- 6.3.1.8. Vietnam
- 6.3.1.9. Rest of Asia-Pacific
- 6.3.1. Asia-Pacific
- 6.1. Market Analysis, Insights and Forecast - by Product Type
- 7. Competitive Analysis
- 7.1. Company Profiles
- 7.1.1 China National Bluestar (Group) Co Ltd
- 7.1.1.1. Company Overview
- 7.1.1.2. Products
- 7.1.1.3. Company Financials
- 7.1.1.4. SWOT Analysis
- 7.1.2 Dupont
- 7.1.2.1. Company Overview
- 7.1.2.2. Products
- 7.1.2.3. Company Financials
- 7.1.2.4. SWOT Analysis
- 7.1.3 Hebei Silicon Valley Chemical Co Ltd
- 7.1.3.1. Company Overview
- 7.1.3.2. Products
- 7.1.3.3. Company Financials
- 7.1.3.4. SWOT Analysis
- 7.1.4 Huvis Corp
- 7.1.4.1. Company Overview
- 7.1.4.2. Products
- 7.1.4.3. Company Financials
- 7.1.4.4. SWOT Analysis
- 7.1.5 HYOSUNG JAPAN
- 7.1.5.1. Company Overview
- 7.1.5.2. Products
- 7.1.5.3. Company Financials
- 7.1.5.4. SWOT Analysis
- 7.1.6 KERMEL
- 7.1.6.1. Company Overview
- 7.1.6.2. Products
- 7.1.6.3. Company Financials
- 7.1.6.4. SWOT Analysis
- 7.1.7 Kolon Industries Inc
- 7.1.7.1. Company Overview
- 7.1.7.2. Products
- 7.1.7.3. Company Financials
- 7.1.7.4. SWOT Analysis
- 7.1.8 Shanghai J&S New Materials Co ltd
- 7.1.8.1. Company Overview
- 7.1.8.2. Products
- 7.1.8.3. Company Financials
- 7.1.8.4. SWOT Analysis
- 7.1.9 Teijin Aramid
- 7.1.9.1. Company Overview
- 7.1.9.2. Products
- 7.1.9.3. Company Financials
- 7.1.9.4. SWOT Analysis
- 7.1.10 TORAY INDUSTRIES INC
- 7.1.10.1. Company Overview
- 7.1.10.2. Products
- 7.1.10.3. Company Financials
- 7.1.10.4. SWOT Analysis
- 7.1.11 X-FIPER New Material Co Ltd
- 7.1.11.1. Company Overview
- 7.1.11.2. Products
- 7.1.11.3. Company Financials
- 7.1.11.4. SWOT Analysis
- 7.1.12 Yantai Tayho Advanced Materials Co Ltd *List Not Exhaustive
- 7.1.12.1. Company Overview
- 7.1.12.2. Products
- 7.1.12.3. Company Financials
- 7.1.12.4. SWOT Analysis
- 7.1.1 China National Bluestar (Group) Co Ltd
- 7.2. Market Entropy
- 7.2.1 Company's Key Areas Served
- 7.2.2 Recent Developments
- 7.3. Company Market Share Analysis 2025
- 7.3.1 Top 5 Companies Market Share Analysis
- 7.3.2 Top 3 Companies Market Share Analysis
- 7.4. List of Potential Customers
- 8. Research Methodology
List of Figures
- Figure 1: Global APAC Aramid Fiber Industry Revenue Breakdown (Million, %) by Region 2025 & 2033
- Figure 2: Global APAC Aramid Fiber Industry Volume Breakdown (Billion, %) by Region 2025 & 2033
- Figure 3: Asia Pacific APAC Aramid Fiber Industry Revenue (Million), by Product Type 2025 & 2033
- Figure 4: Asia Pacific APAC Aramid Fiber Industry Volume (Billion), by Product Type 2025 & 2033
- Figure 5: Asia Pacific APAC Aramid Fiber Industry Revenue Share (%), by Product Type 2025 & 2033
- Figure 6: Asia Pacific APAC Aramid Fiber Industry Volume Share (%), by Product Type 2025 & 2033
- Figure 7: Asia Pacific APAC Aramid Fiber Industry Revenue (Million), by End-user Industry 2025 & 2033
- Figure 8: Asia Pacific APAC Aramid Fiber Industry Volume (Billion), by End-user Industry 2025 & 2033
- Figure 9: Asia Pacific APAC Aramid Fiber Industry Revenue Share (%), by End-user Industry 2025 & 2033
- Figure 10: Asia Pacific APAC Aramid Fiber Industry Volume Share (%), by End-user Industry 2025 & 2033
- Figure 11: Asia Pacific APAC Aramid Fiber Industry Revenue (Million), by Geography 2025 & 2033
- Figure 12: Asia Pacific APAC Aramid Fiber Industry Volume (Billion), by Geography 2025 & 2033
- Figure 13: Asia Pacific APAC Aramid Fiber Industry Revenue Share (%), by Geography 2025 & 2033
- Figure 14: Asia Pacific APAC Aramid Fiber Industry Volume Share (%), by Geography 2025 & 2033
- Figure 15: Asia Pacific APAC Aramid Fiber Industry Revenue (Million), by Country 2025 & 2033
- Figure 16: Asia Pacific APAC Aramid Fiber Industry Volume (Billion), by Country 2025 & 2033
- Figure 17: Asia Pacific APAC Aramid Fiber Industry Revenue Share (%), by Country 2025 & 2033
- Figure 18: Asia Pacific APAC Aramid Fiber Industry Volume Share (%), by Country 2025 & 2033
List of Tables
- Table 1: Global APAC Aramid Fiber Industry Revenue Million Forecast, by Product Type 2020 & 2033
- Table 2: Global APAC Aramid Fiber Industry Volume Billion Forecast, by Product Type 2020 & 2033
- Table 3: Global APAC Aramid Fiber Industry Revenue Million Forecast, by End-user Industry 2020 & 2033
- Table 4: Global APAC Aramid Fiber Industry Volume Billion Forecast, by End-user Industry 2020 & 2033
- Table 5: Global APAC Aramid Fiber Industry Revenue Million Forecast, by Geography 2020 & 2033
- Table 6: Global APAC Aramid Fiber Industry Volume Billion Forecast, by Geography 2020 & 2033
- Table 7: Global APAC Aramid Fiber Industry Revenue Million Forecast, by Region 2020 & 2033
- Table 8: Global APAC Aramid Fiber Industry Volume Billion Forecast, by Region 2020 & 2033
- Table 9: Global APAC Aramid Fiber Industry Revenue Million Forecast, by Product Type 2020 & 2033
- Table 10: Global APAC Aramid Fiber Industry Volume Billion Forecast, by Product Type 2020 & 2033
- Table 11: Global APAC Aramid Fiber Industry Revenue Million Forecast, by End-user Industry 2020 & 2033
- Table 12: Global APAC Aramid Fiber Industry Volume Billion Forecast, by End-user Industry 2020 & 2033
- Table 13: Global APAC Aramid Fiber Industry Revenue Million Forecast, by Geography 2020 & 2033
- Table 14: Global APAC Aramid Fiber Industry Volume Billion Forecast, by Geography 2020 & 2033
- Table 15: Global APAC Aramid Fiber Industry Revenue Million Forecast, by Country 2020 & 2033
- Table 16: Global APAC Aramid Fiber Industry Volume Billion Forecast, by Country 2020 & 2033
- Table 17: China APAC Aramid Fiber Industry Revenue (Million) Forecast, by Application 2020 & 2033
- Table 18: China APAC Aramid Fiber Industry Volume (Billion) Forecast, by Application 2020 & 2033
- Table 19: India APAC Aramid Fiber Industry Revenue (Million) Forecast, by Application 2020 & 2033
- Table 20: India APAC Aramid Fiber Industry Volume (Billion) Forecast, by Application 2020 & 2033
- Table 21: Japan APAC Aramid Fiber Industry Revenue (Million) Forecast, by Application 2020 & 2033
- Table 22: Japan APAC Aramid Fiber Industry Volume (Billion) Forecast, by Application 2020 & 2033
- Table 23: South Korea APAC Aramid Fiber Industry Revenue (Million) Forecast, by Application 2020 & 2033
- Table 24: South Korea APAC Aramid Fiber Industry Volume (Billion) Forecast, by Application 2020 & 2033
- Table 25: Malaysia APAC Aramid Fiber Industry Revenue (Million) Forecast, by Application 2020 & 2033
- Table 26: Malaysia APAC Aramid Fiber Industry Volume (Billion) Forecast, by Application 2020 & 2033
- Table 27: Thailand APAC Aramid Fiber Industry Revenue (Million) Forecast, by Application 2020 & 2033
- Table 28: Thailand APAC Aramid Fiber Industry Volume (Billion) Forecast, by Application 2020 & 2033
- Table 29: Indonesia APAC Aramid Fiber Industry Revenue (Million) Forecast, by Application 2020 & 2033
- Table 30: Indonesia APAC Aramid Fiber Industry Volume (Billion) Forecast, by Application 2020 & 2033
- Table 31: Vietnam APAC Aramid Fiber Industry Revenue (Million) Forecast, by Application 2020 & 2033
- Table 32: Vietnam APAC Aramid Fiber Industry Volume (Billion) Forecast, by Application 2020 & 2033
- Table 33: Rest of Asia Pacific APAC Aramid Fiber Industry Revenue (Million) Forecast, by Application 2020 & 2033
- Table 34: Rest of Asia Pacific APAC Aramid Fiber Industry Volume (Billion) Forecast, by Application 2020 & 2033
Frequently Asked Questions
1. What is the projected Compound Annual Growth Rate (CAGR) of the APAC Aramid Fiber Industry?
The projected CAGR is approximately > 5.00%.
2. Which companies are prominent players in the APAC Aramid Fiber Industry?
Key companies in the market include China National Bluestar (Group) Co Ltd, Dupont, Hebei Silicon Valley Chemical Co Ltd, Huvis Corp, HYOSUNG JAPAN, KERMEL, Kolon Industries Inc, Shanghai J&S New Materials Co ltd, Teijin Aramid, TORAY INDUSTRIES INC, X-FIPER New Material Co Ltd, Yantai Tayho Advanced Materials Co Ltd *List Not Exhaustive.
3. What are the main segments of the APAC Aramid Fiber Industry?
The market segments include Product Type, End-user Industry, Geography.
4. Can you provide details about the market size?
The market size is estimated to be USD 1.22 Million as of 2022.
5. What are some drivers contributing to market growth?
The Increase in Demand for Light Weight Materials in Automotive Industry; The Rising Defense Expenditure of India and China; The Increase in Usage of Aramid Fibers as a Potential Substitute for Steel Materials.
6. What are the notable trends driving market growth?
Aerospace and Defense End-User Industry to Dominated the Market.
7. Are there any restraints impacting market growth?
The Increase in Demand for Light Weight Materials in Automotive Industry; The Rising Defense Expenditure of India and China; The Increase in Usage of Aramid Fibers as a Potential Substitute for Steel Materials.
8. Can you provide examples of recent developments in the market?
The recent developments pertaining to the major players in the market are being covered in the complete study.
9. What pricing options are available for accessing the report?
Pricing options include single-user, multi-user, and enterprise licenses priced at USD 4750, USD 5250, and USD 8750 respectively.
10. Is the market size provided in terms of value or volume?
The market size is provided in terms of value, measured in Million and volume, measured in Billion.
11. Are there any specific market keywords associated with the report?
Yes, the market keyword associated with the report is "APAC Aramid Fiber Industry," which aids in identifying and referencing the specific market segment covered.
12. How do I determine which pricing option suits my needs best?
The pricing options vary based on user requirements and access needs. Individual users may opt for single-user licenses, while businesses requiring broader access may choose multi-user or enterprise licenses for cost-effective access to the report.
13. Are there any additional resources or data provided in the APAC Aramid Fiber Industry report?
While the report offers comprehensive insights, it's advisable to review the specific contents or supplementary materials provided to ascertain if additional resources or data are available.
14. How can I stay updated on further developments or reports in the APAC Aramid Fiber Industry?
To stay informed about further developments, trends, and reports in the APAC Aramid Fiber Industry, consider subscribing to industry newsletters, following relevant companies and organizations, or regularly checking reputable industry news sources and publications.
Methodology
Step 1 - Identification of Relevant Samples Size from Population Database


Step 2 - Approaches for Defining Global Market Size (Value, Volume* & Price*)

Note*: In applicable scenarios
Step 3 - Data Sources
Primary Research
- Web Analytics
- Survey Reports
- Research Institute
- Latest Research Reports
- Opinion Leaders
Secondary Research
- Annual Reports
- White Paper
- Latest Press Release
- Industry Association
- Paid Database
- Investor Presentations

Step 4 - Data Triangulation
Involves using different sources of information in order to increase the validity of a study
These sources are likely to be stakeholders in a program - participants, other researchers, program staff, other community members, and so on.
Then we put all data in single framework & apply various statistical tools to find out the dynamic on the market.
During the analysis stage, feedback from the stakeholder groups would be compared to determine areas of agreement as well as areas of divergence