

Key Insights
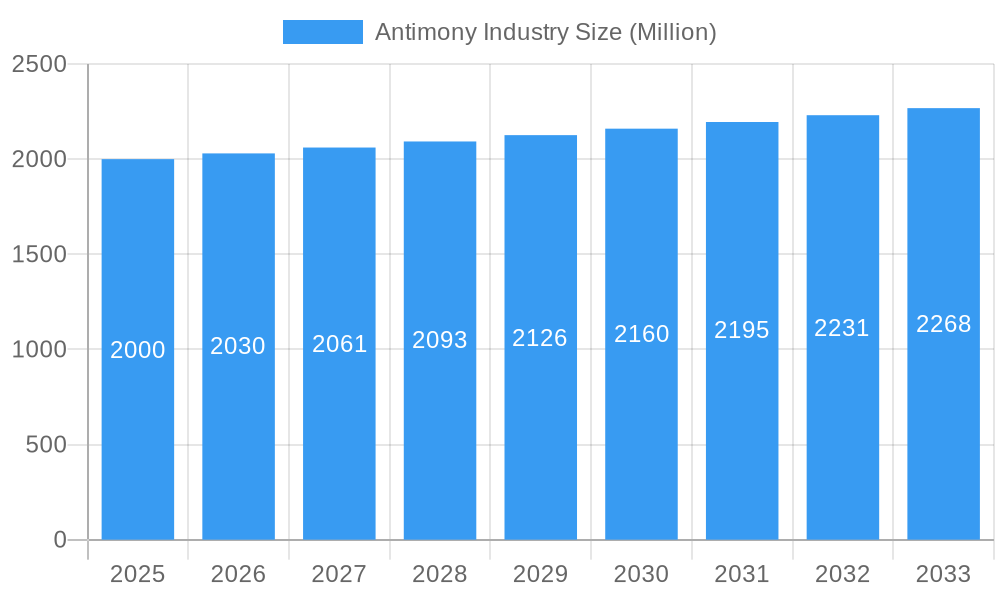
The global antimony market, valued at approximately $2.5 billion in 2025, is poised for robust expansion with a projected Compound Annual Growth Rate (CAGR) of 6% through 2033. This growth is propelled by escalating demand across critical sectors, including flame retardants for electronics and textiles, lead-acid batteries, and specialized alloys. While the shift towards eco-friendly flame retardants presents a dynamic challenge, the indispensable properties of antimony in niche applications are expected to sustain its market relevance. Moreover, innovations in extraction and refining, alongside emerging applications in renewable energy, are anticipated to fuel further market acceleration.
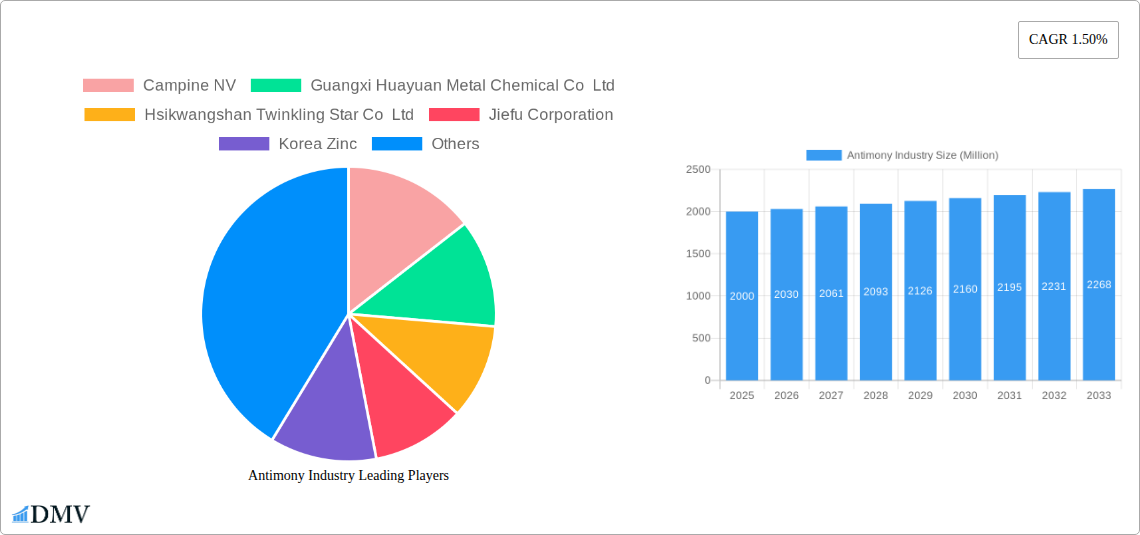
Antimony Industry Market Size (In Billion)
Key market constraints include price volatility driven by supply chain disruptions and geopolitical influences, alongside stringent environmental regulations governing antimony mining and processing. Heightened awareness of antimony's toxicity also necessitates careful management and sustainable practices. Competition from alternative materials requires strategic innovation and diversification by industry leaders. The competitive landscape features a blend of global enterprises and regional specialists, each contributing to market dynamics. Sustainable growth hinges on effectively mitigating these challenges, embracing responsible operations, and adapting to evolving industry needs.
Antimony Industry Company Market Share
Antimony Industry Market Report: 2019-2033 Forecast
This comprehensive report provides an in-depth analysis of the global antimony industry, offering invaluable insights for stakeholders seeking to navigate this dynamic market. The study covers the period 2019-2033, with a focus on the 2025-2033 forecast period, utilizing 2025 as the base and estimated year. Expect detailed market sizing in Millions, covering market composition, technological advancements, competitive landscapes, and future growth trajectories.
Antimony Industry Market Composition & Trends
This section evaluates the concentration of the antimony market, pinpointing key players and their respective market shares. We analyze the impact of innovation, regulatory changes, the presence of substitute materials, end-user demands, and mergers & acquisitions (M&A) activity. The report meticulously examines the landscape of the antimony market, providing a detailed picture of market share distribution among major players. For instance, while precise market share figures for each company are proprietary data within the full report, we can infer a highly fragmented market with no single dominant player. M&A activity in the historical period (2019-2024) totaled approximately $xx Million, indicating moderate consolidation.
- Market Concentration: Highly fragmented, with no single company holding a dominant share.
- Innovation Catalysts: Focus on sustainable mining practices and the development of high-purity antimony products.
- Regulatory Landscape: Varying regulations across regions impacting mining and processing.
- Substitute Products: Limited viable substitutes exist for antimony in key applications.
- End-User Profiles: Dominated by the battery, flame retardant, and metal alloy sectors.
- M&A Activity: Moderate activity observed in the historical period (2019-2024), with a total estimated value of $xx Million.
Antimony Industry Evolution
This section delves into the historical and projected evolution of the antimony market, examining growth trajectories, technological innovations, and the shifting preferences of consumers. The market experienced a Compound Annual Growth Rate (CAGR) of xx% during the historical period (2019-2024), driven by increased demand from the electronics and renewable energy sectors. We forecast a CAGR of xx% from 2025 to 2033, fueled by ongoing technological advancements and expanding applications. The adoption rate of new antimony-based technologies is projected to increase by xx% annually during the forecast period. Specific data points supporting these projections are included in the full report.
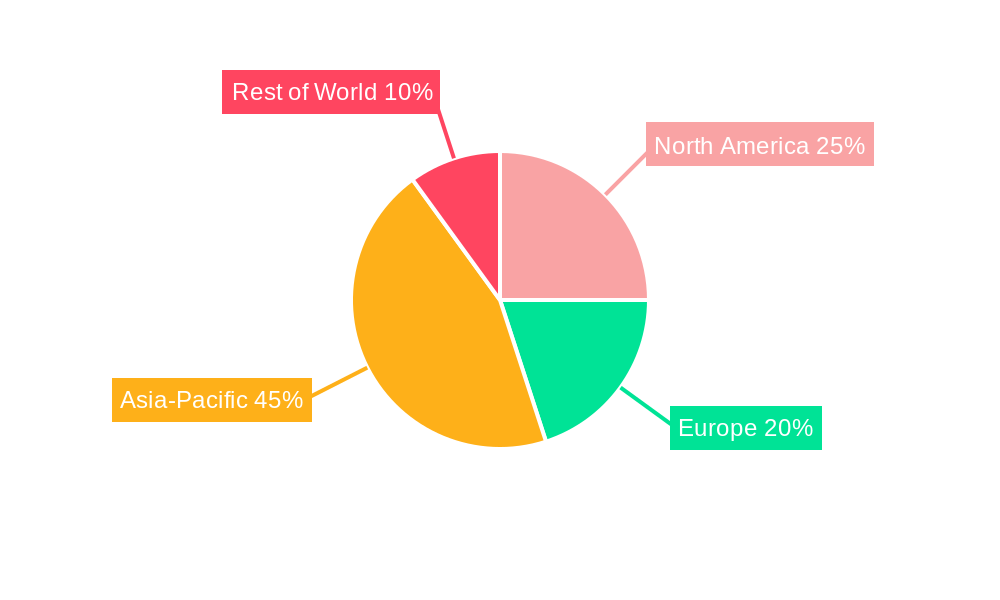
Leading Regions, Countries, or Segments in Antimony Industry
This section identifies the leading regions and countries driving antimony market growth, along with the dominant segments within the industry. China is currently the dominant player, commanding a significant share of global antimony production and consumption.
- Key Drivers in China:
- Substantial investments in mining and refining infrastructure.
- Supportive government policies promoting domestic antimony production.
- Large and growing domestic demand from various sectors.
- Other Key Regions/Countries: Significant production and consumption also occurs in other regions, with growth opportunities emerging in developing economies. Detailed analysis and regional breakdowns are provided in the full report. These include but are not limited to specific countries in Central Asia and South America.
Antimony Industry Product Innovations
The antimony industry is witnessing continuous product innovation, focusing on enhancing performance characteristics and expanding applications. Recent advancements include the development of high-purity antimony compounds for specialized applications in electronics and renewable energy technologies, with improved thermal conductivity and oxidation resistance. These innovations offer unique selling propositions and improve the overall performance metrics of various products utilizing antimony.
Propelling Factors for Antimony Industry Growth
Several factors are driving growth in the antimony market. Increased demand from the electric vehicle (EV) battery sector, coupled with rising investments in renewable energy infrastructure, is a major catalyst. Furthermore, the growing demand for flame-retardant materials in various industries is also contributing to the market's expansion. Stringent environmental regulations are also pushing the industry towards more sustainable mining and processing techniques.
Obstacles in the Antimony Industry Market
Despite the positive outlook, the antimony market faces several challenges. Price volatility due to supply chain disruptions and geopolitical factors poses a significant risk. Environmental concerns related to antimony mining and processing operations necessitate the adoption of sustainable practices, adding to operational costs. Intense competition among producers also exerts downward pressure on prices.
Future Opportunities in Antimony Industry
The future holds significant opportunities for the antimony industry. Expanding applications in emerging technologies, such as advanced batteries and next-generation electronics, present lucrative avenues for growth. Increased focus on sustainable antimony sourcing and recycling will also drive market expansion. Exploration and development of new antimony deposits could also ease supply chain constraints.
Major Players in the Antimony Industry Ecosystem
- Campine NV
- Guangxi Huayuan Metal Chemical Co Ltd
- Hsikwangshan Twinkling Star Co Ltd
- Jiefu Corporation
- Korea Zinc
- Lambert Metals International Limited
- Mandalay Resources
- Nihon Seiko Co Ltd
- Suzuhiro Chemical Co Ltd
- United States Antimony Corporation
- Yiyang City Huachang Antimony Industry Co Ltd
- Yunnan Muli Antimony Industry Co Ltd *List Not Exhaustive
Key Developments in Antimony Industry Industry
- 2022 Q4: Company X announced a significant expansion of its antimony refining capacity.
- 2023 Q1: A major merger between two antimony producers resulted in a more consolidated market structure. (Further details provided within the complete report.)
- 2023 Q3: Introduction of a new, high-purity antimony compound for use in next-generation batteries.
Strategic Antimony Industry Market Forecast
The antimony market is poised for robust growth in the coming years, driven by the factors mentioned above. Sustained demand from key sectors, coupled with technological advancements and strategic investments, will further propel market expansion. The strategic forecast outlined in this report provides a roadmap for stakeholders to capitalize on the emerging opportunities in this dynamic market. The market is expected to reach $xx Million by 2033.
Antimony Industry Segmentation
-
1. Type
- 1.1. Metal Ingot
- 1.2. Antimony Trioxide
- 1.3. Antimony Pentoxide
- 1.4. Alloys
- 1.5. Other Types
-
2. Application
- 2.1. Flame Retardants
- 2.2. Batteries
- 2.3. Ceramics and Glass
- 2.4. Catalyst
- 2.5. Other Applications
Antimony Industry Segmentation By Geography
- 1. Other Countries
- 2. China
- 3. India
- 4. Japan
- 5. South Korea
-
6. Rest of Asia Pacific
- 6.1. North America
- 7. United States
- 8. Canada
-
9. Mexico
- 9.1. Europe
- 10. Germany
- 11. United Kingdom
- 12. Italy
- 13. France
-
14. Rest of Europe
- 14.1. South America
- 15. Brazil
- 16. Argentina
-
17. Rest of South America
- 17.1. Middle East and Africa
- 18. Saudi Arabia
- 19. South Africa
- 20. Rest of Middle East and Africa
Antimony Industry Regional Market Share
Geographic Coverage of Antimony Industry
Antimony Industry REPORT HIGHLIGHTS
| Aspects | Details |
|---|---|
| Study Period | 2020-2034 |
| Base Year | 2025 |
| Estimated Year | 2026 |
| Forecast Period | 2026-2034 |
| Historical Period | 2020-2025 |
| Growth Rate | CAGR of 6% from 2020-2034 |
| Segmentation |
|
Table of Contents
- 1. Introduction
- 1.1. Research Scope
- 1.2. Market Segmentation
- 1.3. Research Objective
- 1.4. Definitions and Assumptions
- 2. Executive Summary
- 2.1. Market Snapshot
- 3. Market Dynamics
- 3.1. Market Drivers
- 3.2. Market Restrains
- 3.3. Market Trends
- 3.4. Market Opportunities
- 4. Market Factor Analysis
- 4.1. Porters Five Forces
- 4.1.1. Bargaining Power of Suppliers
- 4.1.2. Bargaining Power of Buyers
- 4.1.3. Threat of New Entrants
- 4.1.4. Threat of Substitutes
- 4.1.5. Competitive Rivalry
- 4.2. PESTEL analysis
- 4.3. BCG Analysis
- 4.3.1. Stars (High Growth, High Market Share)
- 4.3.2. Cash Cows (Low Growth, High Market Share)
- 4.3.3. Question Mark (High Growth, Low Market Share)
- 4.3.4. Dogs (Low Growth, Low Market Share)
- 4.4. Ansoff Matrix Analysis
- 4.5. Supply Chain Analysis
- 4.6. Regulatory Landscape
- 4.7. Current Market Potential and Opportunity Assessment (TAM–SAM–SOM Framework)
- 4.8. DMV Analyst Note
- 4.1. Porters Five Forces
- 5. Market Analysis, Insights and Forecast 2021-2033
- 5.1. Market Analysis, Insights and Forecast - by Type
- 5.1.1. Metal Ingot
- 5.1.2. Antimony Trioxide
- 5.1.3. Antimony Pentoxide
- 5.1.4. Alloys
- 5.1.5. Other Types
- 5.2. Market Analysis, Insights and Forecast - by Application
- 5.2.1. Flame Retardants
- 5.2.2. Batteries
- 5.2.3. Ceramics and Glass
- 5.2.4. Catalyst
- 5.2.5. Other Applications
- 5.3. Market Analysis, Insights and Forecast - by Region
- 5.3.1. Other Countries
- 5.3.2. China
- 5.3.3. India
- 5.3.4. Japan
- 5.3.5. South Korea
- 5.3.6. Rest of Asia Pacific
- 5.3.7. United States
- 5.3.8. Canada
- 5.3.9. Mexico
- 5.3.10. Germany
- 5.3.11. United Kingdom
- 5.3.12. Italy
- 5.3.13. France
- 5.3.14. Rest of Europe
- 5.3.15. Brazil
- 5.3.16. Argentina
- 5.3.17. Rest of South America
- 5.3.18. Saudi Arabia
- 5.3.19. South Africa
- 5.3.20. Rest of Middle East and Africa
- 5.1. Market Analysis, Insights and Forecast - by Type
- 6. Global Antimony Industry Analysis, Insights and Forecast, 2021-2033
- 6.1. Market Analysis, Insights and Forecast - by Type
- 6.1.1. Metal Ingot
- 6.1.2. Antimony Trioxide
- 6.1.3. Antimony Pentoxide
- 6.1.4. Alloys
- 6.1.5. Other Types
- 6.2. Market Analysis, Insights and Forecast - by Application
- 6.2.1. Flame Retardants
- 6.2.2. Batteries
- 6.2.3. Ceramics and Glass
- 6.2.4. Catalyst
- 6.2.5. Other Applications
- 6.1. Market Analysis, Insights and Forecast - by Type
- 7. Other Countries Antimony Industry Analysis, Insights and Forecast, 2020-2032
- 7.1. Market Analysis, Insights and Forecast - by Type
- 7.1.1. Metal Ingot
- 7.1.2. Antimony Trioxide
- 7.1.3. Antimony Pentoxide
- 7.1.4. Alloys
- 7.1.5. Other Types
- 7.2. Market Analysis, Insights and Forecast - by Application
- 7.2.1. Flame Retardants
- 7.2.2. Batteries
- 7.2.3. Ceramics and Glass
- 7.2.4. Catalyst
- 7.2.5. Other Applications
- 7.1. Market Analysis, Insights and Forecast - by Type
- 8. China Antimony Industry Analysis, Insights and Forecast, 2020-2032
- 8.1. Market Analysis, Insights and Forecast - by Type
- 8.1.1. Metal Ingot
- 8.1.2. Antimony Trioxide
- 8.1.3. Antimony Pentoxide
- 8.1.4. Alloys
- 8.1.5. Other Types
- 8.2. Market Analysis, Insights and Forecast - by Application
- 8.2.1. Flame Retardants
- 8.2.2. Batteries
- 8.2.3. Ceramics and Glass
- 8.2.4. Catalyst
- 8.2.5. Other Applications
- 8.1. Market Analysis, Insights and Forecast - by Type
- 9. India Antimony Industry Analysis, Insights and Forecast, 2020-2032
- 9.1. Market Analysis, Insights and Forecast - by Type
- 9.1.1. Metal Ingot
- 9.1.2. Antimony Trioxide
- 9.1.3. Antimony Pentoxide
- 9.1.4. Alloys
- 9.1.5. Other Types
- 9.2. Market Analysis, Insights and Forecast - by Application
- 9.2.1. Flame Retardants
- 9.2.2. Batteries
- 9.2.3. Ceramics and Glass
- 9.2.4. Catalyst
- 9.2.5. Other Applications
- 9.1. Market Analysis, Insights and Forecast - by Type
- 10. Japan Antimony Industry Analysis, Insights and Forecast, 2020-2032
- 10.1. Market Analysis, Insights and Forecast - by Type
- 10.1.1. Metal Ingot
- 10.1.2. Antimony Trioxide
- 10.1.3. Antimony Pentoxide
- 10.1.4. Alloys
- 10.1.5. Other Types
- 10.2. Market Analysis, Insights and Forecast - by Application
- 10.2.1. Flame Retardants
- 10.2.2. Batteries
- 10.2.3. Ceramics and Glass
- 10.2.4. Catalyst
- 10.2.5. Other Applications
- 10.1. Market Analysis, Insights and Forecast - by Type
- 11. South Korea Antimony Industry Analysis, Insights and Forecast, 2020-2032
- 11.1. Market Analysis, Insights and Forecast - by Type
- 11.1.1. Metal Ingot
- 11.1.2. Antimony Trioxide
- 11.1.3. Antimony Pentoxide
- 11.1.4. Alloys
- 11.1.5. Other Types
- 11.2. Market Analysis, Insights and Forecast - by Application
- 11.2.1. Flame Retardants
- 11.2.2. Batteries
- 11.2.3. Ceramics and Glass
- 11.2.4. Catalyst
- 11.2.5. Other Applications
- 11.1. Market Analysis, Insights and Forecast - by Type
- 12. Rest of Asia Pacific Antimony Industry Analysis, Insights and Forecast, 2020-2032
- 12.1. Market Analysis, Insights and Forecast - by Type
- 12.1.1. Metal Ingot
- 12.1.2. Antimony Trioxide
- 12.1.3. Antimony Pentoxide
- 12.1.4. Alloys
- 12.1.5. Other Types
- 12.2. Market Analysis, Insights and Forecast - by Application
- 12.2.1. Flame Retardants
- 12.2.2. Batteries
- 12.2.3. Ceramics and Glass
- 12.2.4. Catalyst
- 12.2.5. Other Applications
- 12.1. Market Analysis, Insights and Forecast - by Type
- 13. United States Antimony Industry Analysis, Insights and Forecast, 2020-2032
- 13.1. Market Analysis, Insights and Forecast - by Type
- 13.1.1. Metal Ingot
- 13.1.2. Antimony Trioxide
- 13.1.3. Antimony Pentoxide
- 13.1.4. Alloys
- 13.1.5. Other Types
- 13.2. Market Analysis, Insights and Forecast - by Application
- 13.2.1. Flame Retardants
- 13.2.2. Batteries
- 13.2.3. Ceramics and Glass
- 13.2.4. Catalyst
- 13.2.5. Other Applications
- 13.1. Market Analysis, Insights and Forecast - by Type
- 14. Canada Antimony Industry Analysis, Insights and Forecast, 2020-2032
- 14.1. Market Analysis, Insights and Forecast - by Type
- 14.1.1. Metal Ingot
- 14.1.2. Antimony Trioxide
- 14.1.3. Antimony Pentoxide
- 14.1.4. Alloys
- 14.1.5. Other Types
- 14.2. Market Analysis, Insights and Forecast - by Application
- 14.2.1. Flame Retardants
- 14.2.2. Batteries
- 14.2.3. Ceramics and Glass
- 14.2.4. Catalyst
- 14.2.5. Other Applications
- 14.1. Market Analysis, Insights and Forecast - by Type
- 15. Mexico Antimony Industry Analysis, Insights and Forecast, 2020-2032
- 15.1. Market Analysis, Insights and Forecast - by Type
- 15.1.1. Metal Ingot
- 15.1.2. Antimony Trioxide
- 15.1.3. Antimony Pentoxide
- 15.1.4. Alloys
- 15.1.5. Other Types
- 15.2. Market Analysis, Insights and Forecast - by Application
- 15.2.1. Flame Retardants
- 15.2.2. Batteries
- 15.2.3. Ceramics and Glass
- 15.2.4. Catalyst
- 15.2.5. Other Applications
- 15.1. Market Analysis, Insights and Forecast - by Type
- 16. Germany Antimony Industry Analysis, Insights and Forecast, 2020-2032
- 16.1. Market Analysis, Insights and Forecast - by Type
- 16.1.1. Metal Ingot
- 16.1.2. Antimony Trioxide
- 16.1.3. Antimony Pentoxide
- 16.1.4. Alloys
- 16.1.5. Other Types
- 16.2. Market Analysis, Insights and Forecast - by Application
- 16.2.1. Flame Retardants
- 16.2.2. Batteries
- 16.2.3. Ceramics and Glass
- 16.2.4. Catalyst
- 16.2.5. Other Applications
- 16.1. Market Analysis, Insights and Forecast - by Type
- 17. United Kingdom Antimony Industry Analysis, Insights and Forecast, 2020-2032
- 17.1. Market Analysis, Insights and Forecast - by Type
- 17.1.1. Metal Ingot
- 17.1.2. Antimony Trioxide
- 17.1.3. Antimony Pentoxide
- 17.1.4. Alloys
- 17.1.5. Other Types
- 17.2. Market Analysis, Insights and Forecast - by Application
- 17.2.1. Flame Retardants
- 17.2.2. Batteries
- 17.2.3. Ceramics and Glass
- 17.2.4. Catalyst
- 17.2.5. Other Applications
- 17.1. Market Analysis, Insights and Forecast - by Type
- 18. Italy Antimony Industry Analysis, Insights and Forecast, 2020-2032
- 18.1. Market Analysis, Insights and Forecast - by Type
- 18.1.1. Metal Ingot
- 18.1.2. Antimony Trioxide
- 18.1.3. Antimony Pentoxide
- 18.1.4. Alloys
- 18.1.5. Other Types
- 18.2. Market Analysis, Insights and Forecast - by Application
- 18.2.1. Flame Retardants
- 18.2.2. Batteries
- 18.2.3. Ceramics and Glass
- 18.2.4. Catalyst
- 18.2.5. Other Applications
- 18.1. Market Analysis, Insights and Forecast - by Type
- 19. France Antimony Industry Analysis, Insights and Forecast, 2020-2032
- 19.1. Market Analysis, Insights and Forecast - by Type
- 19.1.1. Metal Ingot
- 19.1.2. Antimony Trioxide
- 19.1.3. Antimony Pentoxide
- 19.1.4. Alloys
- 19.1.5. Other Types
- 19.2. Market Analysis, Insights and Forecast - by Application
- 19.2.1. Flame Retardants
- 19.2.2. Batteries
- 19.2.3. Ceramics and Glass
- 19.2.4. Catalyst
- 19.2.5. Other Applications
- 19.1. Market Analysis, Insights and Forecast - by Type
- 20. Rest of Europe Antimony Industry Analysis, Insights and Forecast, 2020-2032
- 20.1. Market Analysis, Insights and Forecast - by Type
- 20.1.1. Metal Ingot
- 20.1.2. Antimony Trioxide
- 20.1.3. Antimony Pentoxide
- 20.1.4. Alloys
- 20.1.5. Other Types
- 20.2. Market Analysis, Insights and Forecast - by Application
- 20.2.1. Flame Retardants
- 20.2.2. Batteries
- 20.2.3. Ceramics and Glass
- 20.2.4. Catalyst
- 20.2.5. Other Applications
- 20.1. Market Analysis, Insights and Forecast - by Type
- 21. Brazil Antimony Industry Analysis, Insights and Forecast, 2020-2032
- 21.1. Market Analysis, Insights and Forecast - by Type
- 21.1.1. Metal Ingot
- 21.1.2. Antimony Trioxide
- 21.1.3. Antimony Pentoxide
- 21.1.4. Alloys
- 21.1.5. Other Types
- 21.2. Market Analysis, Insights and Forecast - by Application
- 21.2.1. Flame Retardants
- 21.2.2. Batteries
- 21.2.3. Ceramics and Glass
- 21.2.4. Catalyst
- 21.2.5. Other Applications
- 21.1. Market Analysis, Insights and Forecast - by Type
- 22. Argentina Antimony Industry Analysis, Insights and Forecast, 2020-2032
- 22.1. Market Analysis, Insights and Forecast - by Type
- 22.1.1. Metal Ingot
- 22.1.2. Antimony Trioxide
- 22.1.3. Antimony Pentoxide
- 22.1.4. Alloys
- 22.1.5. Other Types
- 22.2. Market Analysis, Insights and Forecast - by Application
- 22.2.1. Flame Retardants
- 22.2.2. Batteries
- 22.2.3. Ceramics and Glass
- 22.2.4. Catalyst
- 22.2.5. Other Applications
- 22.1. Market Analysis, Insights and Forecast - by Type
- 23. Rest of South America Antimony Industry Analysis, Insights and Forecast, 2020-2032
- 23.1. Market Analysis, Insights and Forecast - by Type
- 23.1.1. Metal Ingot
- 23.1.2. Antimony Trioxide
- 23.1.3. Antimony Pentoxide
- 23.1.4. Alloys
- 23.1.5. Other Types
- 23.2. Market Analysis, Insights and Forecast - by Application
- 23.2.1. Flame Retardants
- 23.2.2. Batteries
- 23.2.3. Ceramics and Glass
- 23.2.4. Catalyst
- 23.2.5. Other Applications
- 23.1. Market Analysis, Insights and Forecast - by Type
- 24. Saudi Arabia Antimony Industry Analysis, Insights and Forecast, 2020-2032
- 24.1. Market Analysis, Insights and Forecast - by Type
- 24.1.1. Metal Ingot
- 24.1.2. Antimony Trioxide
- 24.1.3. Antimony Pentoxide
- 24.1.4. Alloys
- 24.1.5. Other Types
- 24.2. Market Analysis, Insights and Forecast - by Application
- 24.2.1. Flame Retardants
- 24.2.2. Batteries
- 24.2.3. Ceramics and Glass
- 24.2.4. Catalyst
- 24.2.5. Other Applications
- 24.1. Market Analysis, Insights and Forecast - by Type
- 25. South Africa Antimony Industry Analysis, Insights and Forecast, 2020-2032
- 25.1. Market Analysis, Insights and Forecast - by Type
- 25.1.1. Metal Ingot
- 25.1.2. Antimony Trioxide
- 25.1.3. Antimony Pentoxide
- 25.1.4. Alloys
- 25.1.5. Other Types
- 25.2. Market Analysis, Insights and Forecast - by Application
- 25.2.1. Flame Retardants
- 25.2.2. Batteries
- 25.2.3. Ceramics and Glass
- 25.2.4. Catalyst
- 25.2.5. Other Applications
- 25.1. Market Analysis, Insights and Forecast - by Type
- 26. Rest of Middle East and Africa Antimony Industry Analysis, Insights and Forecast, 2020-2032
- 26.1. Market Analysis, Insights and Forecast - by Type
- 26.1.1. Metal Ingot
- 26.1.2. Antimony Trioxide
- 26.1.3. Antimony Pentoxide
- 26.1.4. Alloys
- 26.1.5. Other Types
- 26.2. Market Analysis, Insights and Forecast - by Application
- 26.2.1. Flame Retardants
- 26.2.2. Batteries
- 26.2.3. Ceramics and Glass
- 26.2.4. Catalyst
- 26.2.5. Other Applications
- 26.1. Market Analysis, Insights and Forecast - by Type
- 27. Competitive Analysis
- 27.1. Company Profiles
- 27.1.1 Campine NV
- 27.1.1.1. Company Overview
- 27.1.1.2. Products
- 27.1.1.3. Company Financials
- 27.1.1.4. SWOT Analysis
- 27.1.2 Guangxi Huayuan Metal Chemical Co Ltd
- 27.1.2.1. Company Overview
- 27.1.2.2. Products
- 27.1.2.3. Company Financials
- 27.1.2.4. SWOT Analysis
- 27.1.3 Hsikwangshan Twinkling Star Co Ltd
- 27.1.3.1. Company Overview
- 27.1.3.2. Products
- 27.1.3.3. Company Financials
- 27.1.3.4. SWOT Analysis
- 27.1.4 Jiefu Corporation
- 27.1.4.1. Company Overview
- 27.1.4.2. Products
- 27.1.4.3. Company Financials
- 27.1.4.4. SWOT Analysis
- 27.1.5 Korea Zinc
- 27.1.5.1. Company Overview
- 27.1.5.2. Products
- 27.1.5.3. Company Financials
- 27.1.5.4. SWOT Analysis
- 27.1.6 Lambert Metals International Limited
- 27.1.6.1. Company Overview
- 27.1.6.2. Products
- 27.1.6.3. Company Financials
- 27.1.6.4. SWOT Analysis
- 27.1.7 Mandalay Resources
- 27.1.7.1. Company Overview
- 27.1.7.2. Products
- 27.1.7.3. Company Financials
- 27.1.7.4. SWOT Analysis
- 27.1.8 Nihon Seiko Co Ltd
- 27.1.8.1. Company Overview
- 27.1.8.2. Products
- 27.1.8.3. Company Financials
- 27.1.8.4. SWOT Analysis
- 27.1.9 Suzuhiro Chemical Co Ltd
- 27.1.9.1. Company Overview
- 27.1.9.2. Products
- 27.1.9.3. Company Financials
- 27.1.9.4. SWOT Analysis
- 27.1.10 United States Antimony Corporation
- 27.1.10.1. Company Overview
- 27.1.10.2. Products
- 27.1.10.3. Company Financials
- 27.1.10.4. SWOT Analysis
- 27.1.11 Yiyang City Huachang Antimony Industry Co Ltd
- 27.1.11.1. Company Overview
- 27.1.11.2. Products
- 27.1.11.3. Company Financials
- 27.1.11.4. SWOT Analysis
- 27.1.12 Yunnan Muli Antimony Industry Co Ltd*List Not Exhaustive
- 27.1.12.1. Company Overview
- 27.1.12.2. Products
- 27.1.12.3. Company Financials
- 27.1.12.4. SWOT Analysis
- 27.1.1 Campine NV
- 27.2. Market Entropy
- 27.2.1 Company's Key Areas Served
- 27.2.2 Recent Developments
- 27.3. Company Market Share Analysis 2025
- 27.3.1 Top 5 Companies Market Share Analysis
- 27.3.2 Top 3 Companies Market Share Analysis
- 27.4. List of Potential Customers
- 28. Research Methodology
List of Figures
- Figure 1: Global Antimony Industry Revenue Breakdown (billion, %) by Region 2025 & 2033
- Figure 2: Other Countries Antimony Industry Revenue (billion), by Type 2025 & 2033
- Figure 3: Other Countries Antimony Industry Revenue Share (%), by Type 2025 & 2033
- Figure 4: Other Countries Antimony Industry Revenue (billion), by Application 2025 & 2033
- Figure 5: Other Countries Antimony Industry Revenue Share (%), by Application 2025 & 2033
- Figure 6: Other Countries Antimony Industry Revenue (billion), by Country 2025 & 2033
- Figure 7: Other Countries Antimony Industry Revenue Share (%), by Country 2025 & 2033
- Figure 8: China Antimony Industry Revenue (billion), by Type 2025 & 2033
- Figure 9: China Antimony Industry Revenue Share (%), by Type 2025 & 2033
- Figure 10: China Antimony Industry Revenue (billion), by Application 2025 & 2033
- Figure 11: China Antimony Industry Revenue Share (%), by Application 2025 & 2033
- Figure 12: China Antimony Industry Revenue (billion), by Country 2025 & 2033
- Figure 13: China Antimony Industry Revenue Share (%), by Country 2025 & 2033
- Figure 14: India Antimony Industry Revenue (billion), by Type 2025 & 2033
- Figure 15: India Antimony Industry Revenue Share (%), by Type 2025 & 2033
- Figure 16: India Antimony Industry Revenue (billion), by Application 2025 & 2033
- Figure 17: India Antimony Industry Revenue Share (%), by Application 2025 & 2033
- Figure 18: India Antimony Industry Revenue (billion), by Country 2025 & 2033
- Figure 19: India Antimony Industry Revenue Share (%), by Country 2025 & 2033
- Figure 20: Japan Antimony Industry Revenue (billion), by Type 2025 & 2033
- Figure 21: Japan Antimony Industry Revenue Share (%), by Type 2025 & 2033
- Figure 22: Japan Antimony Industry Revenue (billion), by Application 2025 & 2033
- Figure 23: Japan Antimony Industry Revenue Share (%), by Application 2025 & 2033
- Figure 24: Japan Antimony Industry Revenue (billion), by Country 2025 & 2033
- Figure 25: Japan Antimony Industry Revenue Share (%), by Country 2025 & 2033
- Figure 26: South Korea Antimony Industry Revenue (billion), by Type 2025 & 2033
- Figure 27: South Korea Antimony Industry Revenue Share (%), by Type 2025 & 2033
- Figure 28: South Korea Antimony Industry Revenue (billion), by Application 2025 & 2033
- Figure 29: South Korea Antimony Industry Revenue Share (%), by Application 2025 & 2033
- Figure 30: South Korea Antimony Industry Revenue (billion), by Country 2025 & 2033
- Figure 31: South Korea Antimony Industry Revenue Share (%), by Country 2025 & 2033
- Figure 32: Rest of Asia Pacific Antimony Industry Revenue (billion), by Type 2025 & 2033
- Figure 33: Rest of Asia Pacific Antimony Industry Revenue Share (%), by Type 2025 & 2033
- Figure 34: Rest of Asia Pacific Antimony Industry Revenue (billion), by Application 2025 & 2033
- Figure 35: Rest of Asia Pacific Antimony Industry Revenue Share (%), by Application 2025 & 2033
- Figure 36: Rest of Asia Pacific Antimony Industry Revenue (billion), by Country 2025 & 2033
- Figure 37: Rest of Asia Pacific Antimony Industry Revenue Share (%), by Country 2025 & 2033
- Figure 38: United States Antimony Industry Revenue (billion), by Type 2025 & 2033
- Figure 39: United States Antimony Industry Revenue Share (%), by Type 2025 & 2033
- Figure 40: United States Antimony Industry Revenue (billion), by Application 2025 & 2033
- Figure 41: United States Antimony Industry Revenue Share (%), by Application 2025 & 2033
- Figure 42: United States Antimony Industry Revenue (billion), by Country 2025 & 2033
- Figure 43: United States Antimony Industry Revenue Share (%), by Country 2025 & 2033
- Figure 44: Canada Antimony Industry Revenue (billion), by Type 2025 & 2033
- Figure 45: Canada Antimony Industry Revenue Share (%), by Type 2025 & 2033
- Figure 46: Canada Antimony Industry Revenue (billion), by Application 2025 & 2033
- Figure 47: Canada Antimony Industry Revenue Share (%), by Application 2025 & 2033
- Figure 48: Canada Antimony Industry Revenue (billion), by Country 2025 & 2033
- Figure 49: Canada Antimony Industry Revenue Share (%), by Country 2025 & 2033
- Figure 50: Mexico Antimony Industry Revenue (billion), by Type 2025 & 2033
- Figure 51: Mexico Antimony Industry Revenue Share (%), by Type 2025 & 2033
- Figure 52: Mexico Antimony Industry Revenue (billion), by Application 2025 & 2033
- Figure 53: Mexico Antimony Industry Revenue Share (%), by Application 2025 & 2033
- Figure 54: Mexico Antimony Industry Revenue (billion), by Country 2025 & 2033
- Figure 55: Mexico Antimony Industry Revenue Share (%), by Country 2025 & 2033
- Figure 56: Germany Antimony Industry Revenue (billion), by Type 2025 & 2033
- Figure 57: Germany Antimony Industry Revenue Share (%), by Type 2025 & 2033
- Figure 58: Germany Antimony Industry Revenue (billion), by Application 2025 & 2033
- Figure 59: Germany Antimony Industry Revenue Share (%), by Application 2025 & 2033
- Figure 60: Germany Antimony Industry Revenue (billion), by Country 2025 & 2033
- Figure 61: Germany Antimony Industry Revenue Share (%), by Country 2025 & 2033
- Figure 62: United Kingdom Antimony Industry Revenue (billion), by Type 2025 & 2033
- Figure 63: United Kingdom Antimony Industry Revenue Share (%), by Type 2025 & 2033
- Figure 64: United Kingdom Antimony Industry Revenue (billion), by Application 2025 & 2033
- Figure 65: United Kingdom Antimony Industry Revenue Share (%), by Application 2025 & 2033
- Figure 66: United Kingdom Antimony Industry Revenue (billion), by Country 2025 & 2033
- Figure 67: United Kingdom Antimony Industry Revenue Share (%), by Country 2025 & 2033
- Figure 68: Italy Antimony Industry Revenue (billion), by Type 2025 & 2033
- Figure 69: Italy Antimony Industry Revenue Share (%), by Type 2025 & 2033
- Figure 70: Italy Antimony Industry Revenue (billion), by Application 2025 & 2033
- Figure 71: Italy Antimony Industry Revenue Share (%), by Application 2025 & 2033
- Figure 72: Italy Antimony Industry Revenue (billion), by Country 2025 & 2033
- Figure 73: Italy Antimony Industry Revenue Share (%), by Country 2025 & 2033
- Figure 74: France Antimony Industry Revenue (billion), by Type 2025 & 2033
- Figure 75: France Antimony Industry Revenue Share (%), by Type 2025 & 2033
- Figure 76: France Antimony Industry Revenue (billion), by Application 2025 & 2033
- Figure 77: France Antimony Industry Revenue Share (%), by Application 2025 & 2033
- Figure 78: France Antimony Industry Revenue (billion), by Country 2025 & 2033
- Figure 79: France Antimony Industry Revenue Share (%), by Country 2025 & 2033
- Figure 80: Rest of Europe Antimony Industry Revenue (billion), by Type 2025 & 2033
- Figure 81: Rest of Europe Antimony Industry Revenue Share (%), by Type 2025 & 2033
- Figure 82: Rest of Europe Antimony Industry Revenue (billion), by Application 2025 & 2033
- Figure 83: Rest of Europe Antimony Industry Revenue Share (%), by Application 2025 & 2033
- Figure 84: Rest of Europe Antimony Industry Revenue (billion), by Country 2025 & 2033
- Figure 85: Rest of Europe Antimony Industry Revenue Share (%), by Country 2025 & 2033
- Figure 86: Brazil Antimony Industry Revenue (billion), by Type 2025 & 2033
- Figure 87: Brazil Antimony Industry Revenue Share (%), by Type 2025 & 2033
- Figure 88: Brazil Antimony Industry Revenue (billion), by Application 2025 & 2033
- Figure 89: Brazil Antimony Industry Revenue Share (%), by Application 2025 & 2033
- Figure 90: Brazil Antimony Industry Revenue (billion), by Country 2025 & 2033
- Figure 91: Brazil Antimony Industry Revenue Share (%), by Country 2025 & 2033
- Figure 92: Argentina Antimony Industry Revenue (billion), by Type 2025 & 2033
- Figure 93: Argentina Antimony Industry Revenue Share (%), by Type 2025 & 2033
- Figure 94: Argentina Antimony Industry Revenue (billion), by Application 2025 & 2033
- Figure 95: Argentina Antimony Industry Revenue Share (%), by Application 2025 & 2033
- Figure 96: Argentina Antimony Industry Revenue (billion), by Country 2025 & 2033
- Figure 97: Argentina Antimony Industry Revenue Share (%), by Country 2025 & 2033
- Figure 98: Rest of South America Antimony Industry Revenue (billion), by Type 2025 & 2033
- Figure 99: Rest of South America Antimony Industry Revenue Share (%), by Type 2025 & 2033
- Figure 100: Rest of South America Antimony Industry Revenue (billion), by Application 2025 & 2033
- Figure 101: Rest of South America Antimony Industry Revenue Share (%), by Application 2025 & 2033
- Figure 102: Rest of South America Antimony Industry Revenue (billion), by Country 2025 & 2033
- Figure 103: Rest of South America Antimony Industry Revenue Share (%), by Country 2025 & 2033
- Figure 104: Saudi Arabia Antimony Industry Revenue (billion), by Type 2025 & 2033
- Figure 105: Saudi Arabia Antimony Industry Revenue Share (%), by Type 2025 & 2033
- Figure 106: Saudi Arabia Antimony Industry Revenue (billion), by Application 2025 & 2033
- Figure 107: Saudi Arabia Antimony Industry Revenue Share (%), by Application 2025 & 2033
- Figure 108: Saudi Arabia Antimony Industry Revenue (billion), by Country 2025 & 2033
- Figure 109: Saudi Arabia Antimony Industry Revenue Share (%), by Country 2025 & 2033
- Figure 110: South Africa Antimony Industry Revenue (billion), by Type 2025 & 2033
- Figure 111: South Africa Antimony Industry Revenue Share (%), by Type 2025 & 2033
- Figure 112: South Africa Antimony Industry Revenue (billion), by Application 2025 & 2033
- Figure 113: South Africa Antimony Industry Revenue Share (%), by Application 2025 & 2033
- Figure 114: South Africa Antimony Industry Revenue (billion), by Country 2025 & 2033
- Figure 115: South Africa Antimony Industry Revenue Share (%), by Country 2025 & 2033
- Figure 116: Rest of Middle East and Africa Antimony Industry Revenue (billion), by Type 2025 & 2033
- Figure 117: Rest of Middle East and Africa Antimony Industry Revenue Share (%), by Type 2025 & 2033
- Figure 118: Rest of Middle East and Africa Antimony Industry Revenue (billion), by Application 2025 & 2033
- Figure 119: Rest of Middle East and Africa Antimony Industry Revenue Share (%), by Application 2025 & 2033
- Figure 120: Rest of Middle East and Africa Antimony Industry Revenue (billion), by Country 2025 & 2033
- Figure 121: Rest of Middle East and Africa Antimony Industry Revenue Share (%), by Country 2025 & 2033
List of Tables
- Table 1: Global Antimony Industry Revenue billion Forecast, by Type 2020 & 2033
- Table 2: Global Antimony Industry Revenue billion Forecast, by Application 2020 & 2033
- Table 3: Global Antimony Industry Revenue billion Forecast, by Region 2020 & 2033
- Table 4: Global Antimony Industry Revenue billion Forecast, by Type 2020 & 2033
- Table 5: Global Antimony Industry Revenue billion Forecast, by Application 2020 & 2033
- Table 6: Global Antimony Industry Revenue billion Forecast, by Country 2020 & 2033
- Table 7: Global Antimony Industry Revenue billion Forecast, by Type 2020 & 2033
- Table 8: Global Antimony Industry Revenue billion Forecast, by Application 2020 & 2033
- Table 9: Global Antimony Industry Revenue billion Forecast, by Country 2020 & 2033
- Table 10: Global Antimony Industry Revenue billion Forecast, by Type 2020 & 2033
- Table 11: Global Antimony Industry Revenue billion Forecast, by Application 2020 & 2033
- Table 12: Global Antimony Industry Revenue billion Forecast, by Country 2020 & 2033
- Table 13: Global Antimony Industry Revenue billion Forecast, by Type 2020 & 2033
- Table 14: Global Antimony Industry Revenue billion Forecast, by Application 2020 & 2033
- Table 15: Global Antimony Industry Revenue billion Forecast, by Country 2020 & 2033
- Table 16: Global Antimony Industry Revenue billion Forecast, by Type 2020 & 2033
- Table 17: Global Antimony Industry Revenue billion Forecast, by Application 2020 & 2033
- Table 18: Global Antimony Industry Revenue billion Forecast, by Country 2020 & 2033
- Table 19: Global Antimony Industry Revenue billion Forecast, by Type 2020 & 2033
- Table 20: Global Antimony Industry Revenue billion Forecast, by Application 2020 & 2033
- Table 21: Global Antimony Industry Revenue billion Forecast, by Country 2020 & 2033
- Table 22: North America Antimony Industry Revenue (billion) Forecast, by Application 2020 & 2033
- Table 23: Global Antimony Industry Revenue billion Forecast, by Type 2020 & 2033
- Table 24: Global Antimony Industry Revenue billion Forecast, by Application 2020 & 2033
- Table 25: Global Antimony Industry Revenue billion Forecast, by Country 2020 & 2033
- Table 26: Global Antimony Industry Revenue billion Forecast, by Type 2020 & 2033
- Table 27: Global Antimony Industry Revenue billion Forecast, by Application 2020 & 2033
- Table 28: Global Antimony Industry Revenue billion Forecast, by Country 2020 & 2033
- Table 29: Global Antimony Industry Revenue billion Forecast, by Type 2020 & 2033
- Table 30: Global Antimony Industry Revenue billion Forecast, by Application 2020 & 2033
- Table 31: Global Antimony Industry Revenue billion Forecast, by Country 2020 & 2033
- Table 32: Europe Antimony Industry Revenue (billion) Forecast, by Application 2020 & 2033
- Table 33: Global Antimony Industry Revenue billion Forecast, by Type 2020 & 2033
- Table 34: Global Antimony Industry Revenue billion Forecast, by Application 2020 & 2033
- Table 35: Global Antimony Industry Revenue billion Forecast, by Country 2020 & 2033
- Table 36: Global Antimony Industry Revenue billion Forecast, by Type 2020 & 2033
- Table 37: Global Antimony Industry Revenue billion Forecast, by Application 2020 & 2033
- Table 38: Global Antimony Industry Revenue billion Forecast, by Country 2020 & 2033
- Table 39: Global Antimony Industry Revenue billion Forecast, by Type 2020 & 2033
- Table 40: Global Antimony Industry Revenue billion Forecast, by Application 2020 & 2033
- Table 41: Global Antimony Industry Revenue billion Forecast, by Country 2020 & 2033
- Table 42: Global Antimony Industry Revenue billion Forecast, by Type 2020 & 2033
- Table 43: Global Antimony Industry Revenue billion Forecast, by Application 2020 & 2033
- Table 44: Global Antimony Industry Revenue billion Forecast, by Country 2020 & 2033
- Table 45: Global Antimony Industry Revenue billion Forecast, by Type 2020 & 2033
- Table 46: Global Antimony Industry Revenue billion Forecast, by Application 2020 & 2033
- Table 47: Global Antimony Industry Revenue billion Forecast, by Country 2020 & 2033
- Table 48: South America Antimony Industry Revenue (billion) Forecast, by Application 2020 & 2033
- Table 49: Global Antimony Industry Revenue billion Forecast, by Type 2020 & 2033
- Table 50: Global Antimony Industry Revenue billion Forecast, by Application 2020 & 2033
- Table 51: Global Antimony Industry Revenue billion Forecast, by Country 2020 & 2033
- Table 52: Global Antimony Industry Revenue billion Forecast, by Type 2020 & 2033
- Table 53: Global Antimony Industry Revenue billion Forecast, by Application 2020 & 2033
- Table 54: Global Antimony Industry Revenue billion Forecast, by Country 2020 & 2033
- Table 55: Global Antimony Industry Revenue billion Forecast, by Type 2020 & 2033
- Table 56: Global Antimony Industry Revenue billion Forecast, by Application 2020 & 2033
- Table 57: Global Antimony Industry Revenue billion Forecast, by Country 2020 & 2033
- Table 58: Middle East and Africa Antimony Industry Revenue (billion) Forecast, by Application 2020 & 2033
- Table 59: Global Antimony Industry Revenue billion Forecast, by Type 2020 & 2033
- Table 60: Global Antimony Industry Revenue billion Forecast, by Application 2020 & 2033
- Table 61: Global Antimony Industry Revenue billion Forecast, by Country 2020 & 2033
- Table 62: Global Antimony Industry Revenue billion Forecast, by Type 2020 & 2033
- Table 63: Global Antimony Industry Revenue billion Forecast, by Application 2020 & 2033
- Table 64: Global Antimony Industry Revenue billion Forecast, by Country 2020 & 2033
- Table 65: Global Antimony Industry Revenue billion Forecast, by Type 2020 & 2033
- Table 66: Global Antimony Industry Revenue billion Forecast, by Application 2020 & 2033
- Table 67: Global Antimony Industry Revenue billion Forecast, by Country 2020 & 2033
Frequently Asked Questions
1. What is the projected Compound Annual Growth Rate (CAGR) of the Antimony Industry?
The projected CAGR is approximately 6%.
2. Which companies are prominent players in the Antimony Industry?
Key companies in the market include Campine NV, Guangxi Huayuan Metal Chemical Co Ltd, Hsikwangshan Twinkling Star Co Ltd, Jiefu Corporation, Korea Zinc, Lambert Metals International Limited, Mandalay Resources, Nihon Seiko Co Ltd, Suzuhiro Chemical Co Ltd, United States Antimony Corporation, Yiyang City Huachang Antimony Industry Co Ltd, Yunnan Muli Antimony Industry Co Ltd*List Not Exhaustive.
3. What are the main segments of the Antimony Industry?
The market segments include Type, Application.
4. Can you provide details about the market size?
The market size is estimated to be USD 2.5 billion as of 2022.
5. What are some drivers contributing to market growth?
Rising Demand from PET Manufacturers; Growing Demand from the Plastic Industry.
6. What are the notable trends driving market growth?
The Flame Retardants Segment is Expected to Dominate the Market.
7. Are there any restraints impacting market growth?
Rising Demand from PET Manufacturers; Growing Demand from the Plastic Industry.
8. Can you provide examples of recent developments in the market?
The recent developments in the major players in the market are covered in the complete study.
9. What pricing options are available for accessing the report?
Pricing options include single-user, multi-user, and enterprise licenses priced at USD 4750, USD 5250, and USD 8750 respectively.
10. Is the market size provided in terms of value or volume?
The market size is provided in terms of value, measured in billion.
11. Are there any specific market keywords associated with the report?
Yes, the market keyword associated with the report is "Antimony Industry," which aids in identifying and referencing the specific market segment covered.
12. How do I determine which pricing option suits my needs best?
The pricing options vary based on user requirements and access needs. Individual users may opt for single-user licenses, while businesses requiring broader access may choose multi-user or enterprise licenses for cost-effective access to the report.
13. Are there any additional resources or data provided in the Antimony Industry report?
While the report offers comprehensive insights, it's advisable to review the specific contents or supplementary materials provided to ascertain if additional resources or data are available.
14. How can I stay updated on further developments or reports in the Antimony Industry?
To stay informed about further developments, trends, and reports in the Antimony Industry, consider subscribing to industry newsletters, following relevant companies and organizations, or regularly checking reputable industry news sources and publications.
Methodology
Step 1 - Identification of Relevant Samples Size from Population Database


Step 2 - Approaches for Defining Global Market Size (Value, Volume* & Price*)

Note*: In applicable scenarios
Step 3 - Data Sources
Primary Research
- Web Analytics
- Survey Reports
- Research Institute
- Latest Research Reports
- Opinion Leaders
Secondary Research
- Annual Reports
- White Paper
- Latest Press Release
- Industry Association
- Paid Database
- Investor Presentations

Step 4 - Data Triangulation
Involves using different sources of information in order to increase the validity of a study
These sources are likely to be stakeholders in a program - participants, other researchers, program staff, other community members, and so on.
Then we put all data in single framework & apply various statistical tools to find out the dynamic on the market.
During the analysis stage, feedback from the stakeholder groups would be compared to determine areas of agreement as well as areas of divergence