

Key Insights
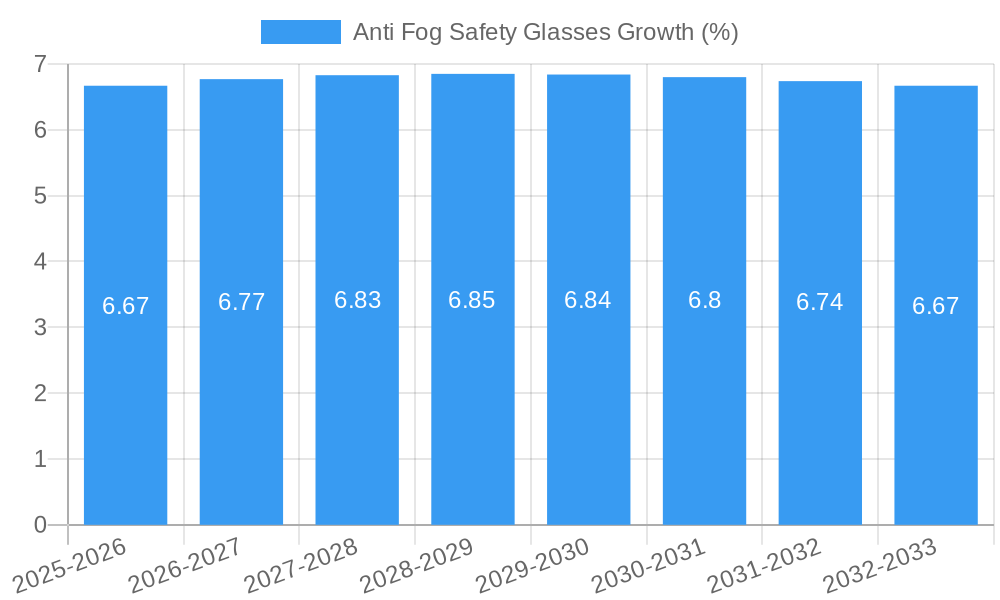
The global Anti-Fog Safety Glasses market is poised for substantial growth, projected to reach approximately USD 2.5 billion by 2033, with a Compound Annual Growth Rate (CAGR) of around 6.5% during the forecast period of 2025-2033. This robust expansion is driven by a confluence of factors, primarily the increasing emphasis on workplace safety regulations across diverse industries and a growing awareness among employers and employees about the critical role of clear vision in preventing accidents. Industries such as manufacturing, construction, and oil and gas, with their inherent risks and demanding environments, are significant contributors to this demand, requiring specialized eyewear that ensures unimpeded vision for intricate tasks. The transportation sector, including automotive and aerospace, also presents a considerable market as advanced safety features become paramount. Furthermore, the expanding healthcare sector, with its sterile environments and need for precise procedures, is increasingly adopting anti-fog solutions, further fueling market penetration. The ongoing technological advancements in lens coatings and materials, offering superior anti-fog performance and enhanced durability, are also key drivers, making these safety glasses more effective and appealing to end-users.
The market is characterized by a clear segmentation based on application and type. General safety glasses, while a foundational segment, are seeing increasing integration of anti-fog features. However, the "Special Safety Glasses" segment, which includes specialized designs for specific industrial needs like chemical splash protection or high-impact resistance with anti-fog capabilities, is expected to witness faster growth. Geographically, the Asia Pacific region, led by China and India, is emerging as a powerhouse due to rapid industrialization, a burgeoning manufacturing base, and a growing focus on occupational health and safety. North America and Europe, with their established safety standards and high disposable incomes, continue to be significant markets. Restraints, such as the initial cost of high-performance anti-fog lenses compared to standard ones and the potential for counterfeiting, are present but are being mitigated by increasing economies of scale and the strong demand for reliable safety solutions. Key players like Honeywell, 3M, and Draeger are at the forefront, investing in research and development to innovate and capture market share.
Anti Fog Safety Glasses Market Composition & Trends
The global anti-fog safety glasses market is a dynamic and evolving landscape, characterized by a growing emphasis on worker safety and enhanced visibility across diverse industrial sectors. Market concentration remains moderate, with key players like Honeywell, 3M, and Draeger establishing significant footprints. Innovation catalysts are primarily driven by the demand for improved lens coatings, lightweight materials, and ergonomic designs that minimize wearer fatigue. The regulatory landscape, driven by occupational health and safety standards worldwide, continues to mandate the use of high-performance eye protection, directly fueling market expansion. Substitute products, such as standard safety glasses or specialized face shields, exist but often lack the critical anti-fog functionality that prevents vision impairment in humid or temperature-fluctuating environments. End-user profiles are broad, encompassing individuals in manufacturing, construction, oil and gas, transportation, chemicals, catering, and medical fields, all seeking reliable protection against splashes, impacts, and debris without compromised visibility. Mergers and acquisitions (M&A) activity has been observed, though significant consolidation is yet to fully define the market. Estimated M&A deal values are projected to be in the tens of millions annually, reflecting strategic acquisitions aimed at expanding product portfolios and market reach.
- Market Share Distribution: Leading companies are estimated to hold a combined market share of XXX million.
- M&A Activity: Anticipated M&A deal values are expected to reach XXX million over the forecast period.
Anti Fog Safety Glasses Industry Evolution
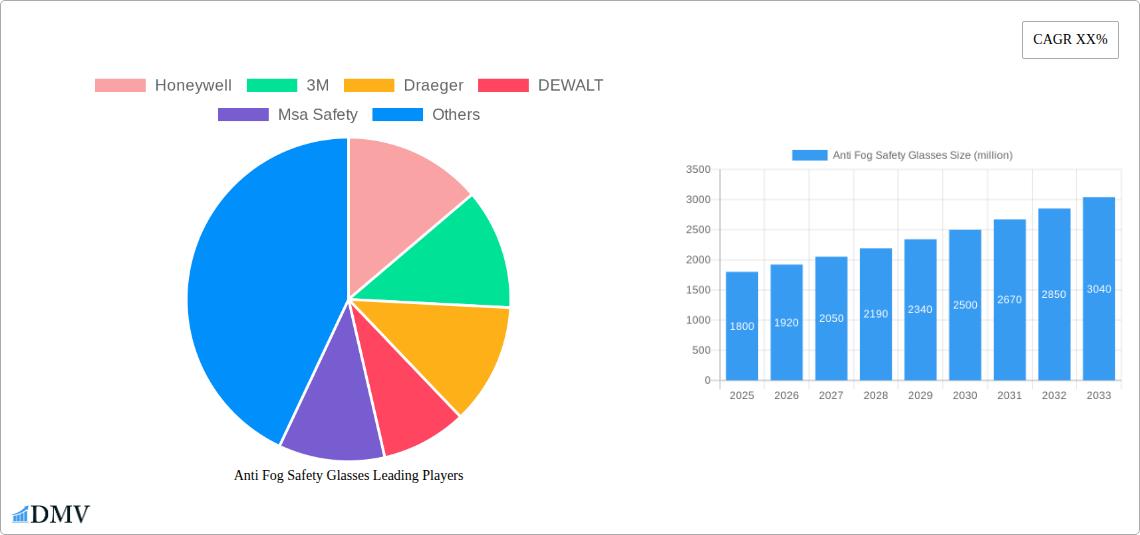
The anti-fog safety glasses industry has witnessed a robust evolution, driven by an unwavering commitment to enhancing workplace safety and operational efficiency. From 2019 to 2024, the historical period, the market demonstrated steady growth, fueled by increasing awareness of eye hazards in industrial settings and the inherent limitations of conventional eyewear. The base year, 2025, marks a pivotal point, with projected market value anticipated to reach XXX million, reflecting sustained demand. Technological advancements have been a cornerstone of this evolution. Early iterations of anti-fog technology focused on basic coatings, but modern innovations have introduced sophisticated, long-lasting treatments that actively resist condensation. These include hydrophobic and oleophobic coatings that repel water molecules and prevent fogging, significantly improving visual clarity in challenging conditions. Market growth trajectories have been consistently upward, with an estimated Compound Annual Growth Rate (CAGR) of XX% projected from 2025 to 2033. This growth is underpinned by stricter safety regulations and a proactive approach by industries to minimize accidents and lost productivity. Consumer demand has shifted towards premium, high-performance solutions, with workers prioritizing comfort, durability, and superior optical clarity. Adoption metrics for advanced anti-fog solutions are on the rise, as businesses recognize the direct correlation between clear vision and reduced incident rates. The industry has moved beyond basic protective eyewear to become an integral component of a comprehensive safety management system. This continuous innovation and responsiveness to end-user needs have propelled the anti-fog safety glasses market into a significant segment of the personal protective equipment (PPE) industry, with a total market size projected to surpass XXX million by 2033.
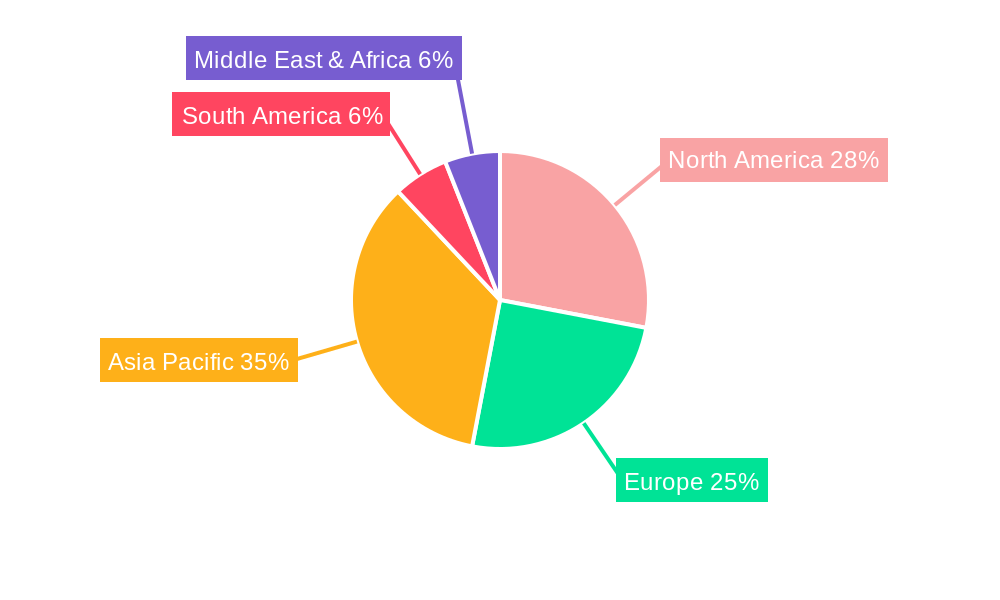
Leading Regions, Countries, or Segments in Anti Fog Safety Glasses
The anti-fog safety glasses market exhibits distinct leadership across various geographical regions and industrial segments. Dominance is clearly evident in North America and Europe, driven by stringent occupational health and safety regulations and a mature industrial base across Manufacturing and Construction. These regions have consistently invested in advanced PPE solutions, making them prime markets for high-performance anti-fog eyewear.
North America: This region is a powerhouse in the anti-fog safety glasses market. Key drivers include:
- Regulatory Support: OSHA (Occupational Safety and Health Administration) mandates rigorous safety standards, encouraging widespread adoption of advanced eye protection.
- Industry Investment: Significant capital expenditure in the Construction and Oil and Gas sectors translates into higher demand for durable and fog-resistant safety glasses.
- Technological Adoption: A readily available workforce accustomed to and demanding technologically advanced PPE.
- Market Size: Expected market share for North America is estimated at XXX million.
Europe: Similar to North America, Europe demonstrates strong market penetration due to:
- EU Directives: Directives like the Personal Protective Equipment (PPE) Regulation ensure consistent safety standards across member states.
- Industrial Diversification: Robust Chemicals, Transportation, and Manufacturing industries contribute significantly to demand.
- End-User Preference: A strong emphasis on worker well-being and productivity fuels the preference for anti-fog solutions.
- Market Size: Projected market share for Europe is estimated at XXX million.
Within the Application segments, Manufacturing and Construction consistently lead the demand for anti-fog safety glasses. The inherent nature of these industries involves exposure to dust, debris, chemicals, and varying environmental conditions that can lead to lens fogging. Workers in these sectors require uninterrupted vision for precision tasks and to prevent workplace accidents.
Manufacturing:
- High-Risk Environments: Exposure to fumes, heat, and constant movement of machinery necessitates clear vision.
- Productivity Focus: Reduced downtime due to fogged lenses directly impacts output.
Construction:
- Outdoor and Indoor Work: Variability in temperature and humidity creates ideal conditions for fogging.
- Impact Protection: Combines the need for anti-fog with robust impact resistance.
In terms of Types, General Safety Glasses with integrated anti-fog coatings are experiencing widespread adoption due to their versatility and cost-effectiveness. However, Special Safety Glasses, designed for niche applications like welding or chemical handling, are also seeing significant growth as industries require tailored solutions.
General Safety Glasses:
- Broad Applicability: Suitable for a wide range of common industrial tasks.
- Cost-Effectiveness: Offers a strong balance of protection and affordability.
Special Safety Glasses:
- Niche Performance: Addresses specific hazards like chemical splashes or extreme temperatures.
- Growing Demand: As specialized industries expand, so does the need for specialized PPE.
Anti Fog Safety Glasses Product Innovations
Product innovations in anti-fog safety glasses are revolutionizing workplace safety by addressing the critical issue of obscured vision. Leading companies are investing heavily in advanced lens technologies, such as multi-layer anti-fog coatings that offer superior, long-lasting performance compared to older treatments. These innovations include hydrophobic and oleophobic properties that actively repel moisture and prevent condensation from forming on the lens surface, ensuring crystal-clear visibility even in humid or temperature-fluctuating environments. Furthermore, the integration of ergonomic designs and lightweight materials enhances wearer comfort, encouraging consistent use throughout the workday. Unique selling propositions now include extended anti-fog lifespan, scratch resistance, UV protection, and lightweight comfort, transforming safety glasses from a basic necessity into a high-performance tool.
Propelling Factors for Anti Fog Safety Glasses Growth
The growth of the anti-fog safety glasses market is propelled by a confluence of technological advancements, economic imperatives, and evolving regulatory frameworks. Stricter occupational safety regulations globally, emphasizing the prevention of workplace accidents and injuries, are a primary driver. For instance, increasing compliance requirements from bodies like OSHA and EU directives mandate higher standards for personal protective equipment (PPE), including effective eye protection that doesn't compromise visibility. Economically, industries are increasingly recognizing the direct correlation between clear vision, reduced accidents, and enhanced productivity, leading to a greater willingness to invest in premium anti-fog solutions. Technologically, continuous innovation in lens coatings and frame materials, offering superior anti-fog performance, comfort, and durability, is further stimulating demand.
Obstacles in the Anti Fog Safety Glasses Market
Despite robust growth, the anti-fog safety glasses market faces several obstacles. Regulatory challenges, though often drivers of growth, can also present complexities, particularly in harmonizing international standards and ensuring consistent enforcement across diverse jurisdictions. Supply chain disruptions, as evidenced by recent global events, can impact the availability and cost of raw materials, affecting production and pricing. Competitive pressures from numerous market players, both established and emerging, can lead to price wars and reduced profit margins for some manufacturers. Furthermore, the initial higher cost of advanced anti-fog safety glasses compared to standard alternatives can be a barrier for some smaller businesses or industries with tighter budget constraints, despite the long-term cost savings from accident prevention.
Future Opportunities in Anti Fog Safety Glasses
Emerging opportunities in the anti-fog safety glasses market are abundant, driven by technological evolution and expanding industrial applications. The development of self-cleaning and anti-microbial coatings on anti-fog lenses presents a significant avenue for innovation, particularly in medical and catering environments. The growing demand for smart safety glasses, integrating features like augmented reality displays or communication capabilities alongside anti-fog technology, opens new market segments. Expansion into developing economies, where safety awareness and regulatory enforcement are increasing, offers substantial growth potential. Furthermore, the increasing adoption of anti-fog solutions in non-traditional sectors, such as sports and recreational activities where fogging can impair performance and safety, represents an untapped market.
Major Players in the Anti Fog Safety Glasses Ecosystem
- Honeywell
- 3M
- Draeger
- DEWALT
- Msa Safety
- Ansell
- Kimberly-Clark
- Delta Plus
- Protective Industrial Products
- COFRA
- Cordova Safety Products
- Lakeland Industries
- Bullard
- Elvex Corporation
- Yamamoto Kogaku
- Pyramex Safety
- Woshine Group
Key Developments in Anti Fog Safety Glasses Industry
- 2023 (Q4): Honeywell launches a new line of advanced anti-fog safety glasses featuring a proprietary coating technology with enhanced durability and clarity, impacting the premium segment.
- 2023 (Q3): 3M announces a strategic partnership with a leading chemical manufacturer to develop next-generation anti-fog solutions, aiming to expand their market share in specialized chemical applications.
- 2024 (Q1): Draeger introduces an innovative lightweight frame design for their anti-fog safety glasses, focusing on improved ergonomics and extended wear comfort for demanding industrial environments.
- 2024 (Q2): DEWALT expands its safety eyewear portfolio with new anti-fog models targeted at the construction industry, emphasizing impact resistance and anti-glare properties.
- 2024 (Q3): Msa Safety acquires a smaller specialized PPE manufacturer known for its innovative anti-fog lens treatments, signaling consolidation and expansion within the market.
Strategic Anti Fog Safety Glasses Market Forecast
The strategic anti-fog safety glasses market forecast indicates sustained and robust growth, fueled by escalating safety mandates and continuous technological innovation. The increasing global awareness of occupational health hazards, coupled with stringent regulatory enforcement, will continue to drive demand across key industrial sectors such as manufacturing, construction, and oil & gas. Innovations in lens coatings, offering superior anti-fog performance, scratch resistance, and enhanced optical clarity, will be crucial growth catalysts. The expanding applications in emerging markets and the development of specialized, high-performance eyewear will further unlock market potential. The projected market value of XXX million by 2033 underscores the critical importance of clear and safe vision in modern industrial operations.
Anti Fog Safety Glasses Segmentation
-
1. Application
- 1.1. Manufacturing
- 1.2. Construction
- 1.3. Oil and Gas
- 1.4. Transportation
- 1.5. Chemicals
- 1.6. Catering
- 1.7. Medical
- 1.8. Other
-
2. Types
- 2.1. General Safety Glasses
- 2.2. Special Safety Glasses
Anti Fog Safety Glasses Segmentation By Geography
-
1. North America
- 1.1. United States
- 1.2. Canada
- 1.3. Mexico
-
2. South America
- 2.1. Brazil
- 2.2. Argentina
- 2.3. Rest of South America
-
3. Europe
- 3.1. United Kingdom
- 3.2. Germany
- 3.3. France
- 3.4. Italy
- 3.5. Spain
- 3.6. Russia
- 3.7. Benelux
- 3.8. Nordics
- 3.9. Rest of Europe
-
4. Middle East & Africa
- 4.1. Turkey
- 4.2. Israel
- 4.3. GCC
- 4.4. North Africa
- 4.5. South Africa
- 4.6. Rest of Middle East & Africa
-
5. Asia Pacific
- 5.1. China
- 5.2. India
- 5.3. Japan
- 5.4. South Korea
- 5.5. ASEAN
- 5.6. Oceania
- 5.7. Rest of Asia Pacific
Anti Fog Safety Glasses REPORT HIGHLIGHTS
| Aspects | Details |
|---|---|
| Study Period | 2019-2033 |
| Base Year | 2024 |
| Estimated Year | 2025 |
| Forecast Period | 2025-2033 |
| Historical Period | 2019-2024 |
| Growth Rate | CAGR of XX% from 2019-2033 |
| Segmentation |
|
Table of Contents
- 1. Introduction
- 1.1. Research Scope
- 1.2. Market Segmentation
- 1.3. Research Methodology
- 1.4. Definitions and Assumptions
- 2. Executive Summary
- 2.1. Introduction
- 3. Market Dynamics
- 3.1. Introduction
- 3.2. Market Drivers
- 3.3. Market Restrains
- 3.4. Market Trends
- 4. Market Factor Analysis
- 4.1. Porters Five Forces
- 4.2. Supply/Value Chain
- 4.3. PESTEL analysis
- 4.4. Market Entropy
- 4.5. Patent/Trademark Analysis
- 5. Global Anti Fog Safety Glasses Analysis, Insights and Forecast, 2019-2031
- 5.1. Market Analysis, Insights and Forecast - by Application
- 5.1.1. Manufacturing
- 5.1.2. Construction
- 5.1.3. Oil and Gas
- 5.1.4. Transportation
- 5.1.5. Chemicals
- 5.1.6. Catering
- 5.1.7. Medical
- 5.1.8. Other
- 5.2. Market Analysis, Insights and Forecast - by Types
- 5.2.1. General Safety Glasses
- 5.2.2. Special Safety Glasses
- 5.3. Market Analysis, Insights and Forecast - by Region
- 5.3.1. North America
- 5.3.2. South America
- 5.3.3. Europe
- 5.3.4. Middle East & Africa
- 5.3.5. Asia Pacific
- 5.1. Market Analysis, Insights and Forecast - by Application
- 6. North America Anti Fog Safety Glasses Analysis, Insights and Forecast, 2019-2031
- 6.1. Market Analysis, Insights and Forecast - by Application
- 6.1.1. Manufacturing
- 6.1.2. Construction
- 6.1.3. Oil and Gas
- 6.1.4. Transportation
- 6.1.5. Chemicals
- 6.1.6. Catering
- 6.1.7. Medical
- 6.1.8. Other
- 6.2. Market Analysis, Insights and Forecast - by Types
- 6.2.1. General Safety Glasses
- 6.2.2. Special Safety Glasses
- 6.1. Market Analysis, Insights and Forecast - by Application
- 7. South America Anti Fog Safety Glasses Analysis, Insights and Forecast, 2019-2031
- 7.1. Market Analysis, Insights and Forecast - by Application
- 7.1.1. Manufacturing
- 7.1.2. Construction
- 7.1.3. Oil and Gas
- 7.1.4. Transportation
- 7.1.5. Chemicals
- 7.1.6. Catering
- 7.1.7. Medical
- 7.1.8. Other
- 7.2. Market Analysis, Insights and Forecast - by Types
- 7.2.1. General Safety Glasses
- 7.2.2. Special Safety Glasses
- 7.1. Market Analysis, Insights and Forecast - by Application
- 8. Europe Anti Fog Safety Glasses Analysis, Insights and Forecast, 2019-2031
- 8.1. Market Analysis, Insights and Forecast - by Application
- 8.1.1. Manufacturing
- 8.1.2. Construction
- 8.1.3. Oil and Gas
- 8.1.4. Transportation
- 8.1.5. Chemicals
- 8.1.6. Catering
- 8.1.7. Medical
- 8.1.8. Other
- 8.2. Market Analysis, Insights and Forecast - by Types
- 8.2.1. General Safety Glasses
- 8.2.2. Special Safety Glasses
- 8.1. Market Analysis, Insights and Forecast - by Application
- 9. Middle East & Africa Anti Fog Safety Glasses Analysis, Insights and Forecast, 2019-2031
- 9.1. Market Analysis, Insights and Forecast - by Application
- 9.1.1. Manufacturing
- 9.1.2. Construction
- 9.1.3. Oil and Gas
- 9.1.4. Transportation
- 9.1.5. Chemicals
- 9.1.6. Catering
- 9.1.7. Medical
- 9.1.8. Other
- 9.2. Market Analysis, Insights and Forecast - by Types
- 9.2.1. General Safety Glasses
- 9.2.2. Special Safety Glasses
- 9.1. Market Analysis, Insights and Forecast - by Application
- 10. Asia Pacific Anti Fog Safety Glasses Analysis, Insights and Forecast, 2019-2031
- 10.1. Market Analysis, Insights and Forecast - by Application
- 10.1.1. Manufacturing
- 10.1.2. Construction
- 10.1.3. Oil and Gas
- 10.1.4. Transportation
- 10.1.5. Chemicals
- 10.1.6. Catering
- 10.1.7. Medical
- 10.1.8. Other
- 10.2. Market Analysis, Insights and Forecast - by Types
- 10.2.1. General Safety Glasses
- 10.2.2. Special Safety Glasses
- 10.1. Market Analysis, Insights and Forecast - by Application
- 11. Competitive Analysis
- 11.1. Global Market Share Analysis 2024
- 11.2. Company Profiles
- 11.2.1 Honeywell
- 11.2.1.1. Overview
- 11.2.1.2. Products
- 11.2.1.3. SWOT Analysis
- 11.2.1.4. Recent Developments
- 11.2.1.5. Financials (Based on Availability)
- 11.2.2 3M
- 11.2.2.1. Overview
- 11.2.2.2. Products
- 11.2.2.3. SWOT Analysis
- 11.2.2.4. Recent Developments
- 11.2.2.5. Financials (Based on Availability)
- 11.2.3 Draeger
- 11.2.3.1. Overview
- 11.2.3.2. Products
- 11.2.3.3. SWOT Analysis
- 11.2.3.4. Recent Developments
- 11.2.3.5. Financials (Based on Availability)
- 11.2.4 DEWALT
- 11.2.4.1. Overview
- 11.2.4.2. Products
- 11.2.4.3. SWOT Analysis
- 11.2.4.4. Recent Developments
- 11.2.4.5. Financials (Based on Availability)
- 11.2.5 Msa Safety
- 11.2.5.1. Overview
- 11.2.5.2. Products
- 11.2.5.3. SWOT Analysis
- 11.2.5.4. Recent Developments
- 11.2.5.5. Financials (Based on Availability)
- 11.2.6 Ansell
- 11.2.6.1. Overview
- 11.2.6.2. Products
- 11.2.6.3. SWOT Analysis
- 11.2.6.4. Recent Developments
- 11.2.6.5. Financials (Based on Availability)
- 11.2.7 Kimberly-Clark
- 11.2.7.1. Overview
- 11.2.7.2. Products
- 11.2.7.3. SWOT Analysis
- 11.2.7.4. Recent Developments
- 11.2.7.5. Financials (Based on Availability)
- 11.2.8 Delta Plus
- 11.2.8.1. Overview
- 11.2.8.2. Products
- 11.2.8.3. SWOT Analysis
- 11.2.8.4. Recent Developments
- 11.2.8.5. Financials (Based on Availability)
- 11.2.9 Protective Industrial Products
- 11.2.9.1. Overview
- 11.2.9.2. Products
- 11.2.9.3. SWOT Analysis
- 11.2.9.4. Recent Developments
- 11.2.9.5. Financials (Based on Availability)
- 11.2.10 COFRA
- 11.2.10.1. Overview
- 11.2.10.2. Products
- 11.2.10.3. SWOT Analysis
- 11.2.10.4. Recent Developments
- 11.2.10.5. Financials (Based on Availability)
- 11.2.11 Cordova Safety Products
- 11.2.11.1. Overview
- 11.2.11.2. Products
- 11.2.11.3. SWOT Analysis
- 11.2.11.4. Recent Developments
- 11.2.11.5. Financials (Based on Availability)
- 11.2.12 Lakeland Industries
- 11.2.12.1. Overview
- 11.2.12.2. Products
- 11.2.12.3. SWOT Analysis
- 11.2.12.4. Recent Developments
- 11.2.12.5. Financials (Based on Availability)
- 11.2.13 Bullard
- 11.2.13.1. Overview
- 11.2.13.2. Products
- 11.2.13.3. SWOT Analysis
- 11.2.13.4. Recent Developments
- 11.2.13.5. Financials (Based on Availability)
- 11.2.14 Elvex Corporation
- 11.2.14.1. Overview
- 11.2.14.2. Products
- 11.2.14.3. SWOT Analysis
- 11.2.14.4. Recent Developments
- 11.2.14.5. Financials (Based on Availability)
- 11.2.15 Yamamoto Kogaku
- 11.2.15.1. Overview
- 11.2.15.2. Products
- 11.2.15.3. SWOT Analysis
- 11.2.15.4. Recent Developments
- 11.2.15.5. Financials (Based on Availability)
- 11.2.16 Pyramex Safety
- 11.2.16.1. Overview
- 11.2.16.2. Products
- 11.2.16.3. SWOT Analysis
- 11.2.16.4. Recent Developments
- 11.2.16.5. Financials (Based on Availability)
- 11.2.17 Woshine Group
- 11.2.17.1. Overview
- 11.2.17.2. Products
- 11.2.17.3. SWOT Analysis
- 11.2.17.4. Recent Developments
- 11.2.17.5. Financials (Based on Availability)
- 11.2.1 Honeywell
List of Figures
- Figure 1: Global Anti Fog Safety Glasses Revenue Breakdown (million, %) by Region 2024 & 2032
- Figure 2: Global Anti Fog Safety Glasses Volume Breakdown (K, %) by Region 2024 & 2032
- Figure 3: North America Anti Fog Safety Glasses Revenue (million), by Application 2024 & 2032
- Figure 4: North America Anti Fog Safety Glasses Volume (K), by Application 2024 & 2032
- Figure 5: North America Anti Fog Safety Glasses Revenue Share (%), by Application 2024 & 2032
- Figure 6: North America Anti Fog Safety Glasses Volume Share (%), by Application 2024 & 2032
- Figure 7: North America Anti Fog Safety Glasses Revenue (million), by Types 2024 & 2032
- Figure 8: North America Anti Fog Safety Glasses Volume (K), by Types 2024 & 2032
- Figure 9: North America Anti Fog Safety Glasses Revenue Share (%), by Types 2024 & 2032
- Figure 10: North America Anti Fog Safety Glasses Volume Share (%), by Types 2024 & 2032
- Figure 11: North America Anti Fog Safety Glasses Revenue (million), by Country 2024 & 2032
- Figure 12: North America Anti Fog Safety Glasses Volume (K), by Country 2024 & 2032
- Figure 13: North America Anti Fog Safety Glasses Revenue Share (%), by Country 2024 & 2032
- Figure 14: North America Anti Fog Safety Glasses Volume Share (%), by Country 2024 & 2032
- Figure 15: South America Anti Fog Safety Glasses Revenue (million), by Application 2024 & 2032
- Figure 16: South America Anti Fog Safety Glasses Volume (K), by Application 2024 & 2032
- Figure 17: South America Anti Fog Safety Glasses Revenue Share (%), by Application 2024 & 2032
- Figure 18: South America Anti Fog Safety Glasses Volume Share (%), by Application 2024 & 2032
- Figure 19: South America Anti Fog Safety Glasses Revenue (million), by Types 2024 & 2032
- Figure 20: South America Anti Fog Safety Glasses Volume (K), by Types 2024 & 2032
- Figure 21: South America Anti Fog Safety Glasses Revenue Share (%), by Types 2024 & 2032
- Figure 22: South America Anti Fog Safety Glasses Volume Share (%), by Types 2024 & 2032
- Figure 23: South America Anti Fog Safety Glasses Revenue (million), by Country 2024 & 2032
- Figure 24: South America Anti Fog Safety Glasses Volume (K), by Country 2024 & 2032
- Figure 25: South America Anti Fog Safety Glasses Revenue Share (%), by Country 2024 & 2032
- Figure 26: South America Anti Fog Safety Glasses Volume Share (%), by Country 2024 & 2032
- Figure 27: Europe Anti Fog Safety Glasses Revenue (million), by Application 2024 & 2032
- Figure 28: Europe Anti Fog Safety Glasses Volume (K), by Application 2024 & 2032
- Figure 29: Europe Anti Fog Safety Glasses Revenue Share (%), by Application 2024 & 2032
- Figure 30: Europe Anti Fog Safety Glasses Volume Share (%), by Application 2024 & 2032
- Figure 31: Europe Anti Fog Safety Glasses Revenue (million), by Types 2024 & 2032
- Figure 32: Europe Anti Fog Safety Glasses Volume (K), by Types 2024 & 2032
- Figure 33: Europe Anti Fog Safety Glasses Revenue Share (%), by Types 2024 & 2032
- Figure 34: Europe Anti Fog Safety Glasses Volume Share (%), by Types 2024 & 2032
- Figure 35: Europe Anti Fog Safety Glasses Revenue (million), by Country 2024 & 2032
- Figure 36: Europe Anti Fog Safety Glasses Volume (K), by Country 2024 & 2032
- Figure 37: Europe Anti Fog Safety Glasses Revenue Share (%), by Country 2024 & 2032
- Figure 38: Europe Anti Fog Safety Glasses Volume Share (%), by Country 2024 & 2032
- Figure 39: Middle East & Africa Anti Fog Safety Glasses Revenue (million), by Application 2024 & 2032
- Figure 40: Middle East & Africa Anti Fog Safety Glasses Volume (K), by Application 2024 & 2032
- Figure 41: Middle East & Africa Anti Fog Safety Glasses Revenue Share (%), by Application 2024 & 2032
- Figure 42: Middle East & Africa Anti Fog Safety Glasses Volume Share (%), by Application 2024 & 2032
- Figure 43: Middle East & Africa Anti Fog Safety Glasses Revenue (million), by Types 2024 & 2032
- Figure 44: Middle East & Africa Anti Fog Safety Glasses Volume (K), by Types 2024 & 2032
- Figure 45: Middle East & Africa Anti Fog Safety Glasses Revenue Share (%), by Types 2024 & 2032
- Figure 46: Middle East & Africa Anti Fog Safety Glasses Volume Share (%), by Types 2024 & 2032
- Figure 47: Middle East & Africa Anti Fog Safety Glasses Revenue (million), by Country 2024 & 2032
- Figure 48: Middle East & Africa Anti Fog Safety Glasses Volume (K), by Country 2024 & 2032
- Figure 49: Middle East & Africa Anti Fog Safety Glasses Revenue Share (%), by Country 2024 & 2032
- Figure 50: Middle East & Africa Anti Fog Safety Glasses Volume Share (%), by Country 2024 & 2032
- Figure 51: Asia Pacific Anti Fog Safety Glasses Revenue (million), by Application 2024 & 2032
- Figure 52: Asia Pacific Anti Fog Safety Glasses Volume (K), by Application 2024 & 2032
- Figure 53: Asia Pacific Anti Fog Safety Glasses Revenue Share (%), by Application 2024 & 2032
- Figure 54: Asia Pacific Anti Fog Safety Glasses Volume Share (%), by Application 2024 & 2032
- Figure 55: Asia Pacific Anti Fog Safety Glasses Revenue (million), by Types 2024 & 2032
- Figure 56: Asia Pacific Anti Fog Safety Glasses Volume (K), by Types 2024 & 2032
- Figure 57: Asia Pacific Anti Fog Safety Glasses Revenue Share (%), by Types 2024 & 2032
- Figure 58: Asia Pacific Anti Fog Safety Glasses Volume Share (%), by Types 2024 & 2032
- Figure 59: Asia Pacific Anti Fog Safety Glasses Revenue (million), by Country 2024 & 2032
- Figure 60: Asia Pacific Anti Fog Safety Glasses Volume (K), by Country 2024 & 2032
- Figure 61: Asia Pacific Anti Fog Safety Glasses Revenue Share (%), by Country 2024 & 2032
- Figure 62: Asia Pacific Anti Fog Safety Glasses Volume Share (%), by Country 2024 & 2032
List of Tables
- Table 1: Global Anti Fog Safety Glasses Revenue million Forecast, by Region 2019 & 2032
- Table 2: Global Anti Fog Safety Glasses Volume K Forecast, by Region 2019 & 2032
- Table 3: Global Anti Fog Safety Glasses Revenue million Forecast, by Application 2019 & 2032
- Table 4: Global Anti Fog Safety Glasses Volume K Forecast, by Application 2019 & 2032
- Table 5: Global Anti Fog Safety Glasses Revenue million Forecast, by Types 2019 & 2032
- Table 6: Global Anti Fog Safety Glasses Volume K Forecast, by Types 2019 & 2032
- Table 7: Global Anti Fog Safety Glasses Revenue million Forecast, by Region 2019 & 2032
- Table 8: Global Anti Fog Safety Glasses Volume K Forecast, by Region 2019 & 2032
- Table 9: Global Anti Fog Safety Glasses Revenue million Forecast, by Application 2019 & 2032
- Table 10: Global Anti Fog Safety Glasses Volume K Forecast, by Application 2019 & 2032
- Table 11: Global Anti Fog Safety Glasses Revenue million Forecast, by Types 2019 & 2032
- Table 12: Global Anti Fog Safety Glasses Volume K Forecast, by Types 2019 & 2032
- Table 13: Global Anti Fog Safety Glasses Revenue million Forecast, by Country 2019 & 2032
- Table 14: Global Anti Fog Safety Glasses Volume K Forecast, by Country 2019 & 2032
- Table 15: United States Anti Fog Safety Glasses Revenue (million) Forecast, by Application 2019 & 2032
- Table 16: United States Anti Fog Safety Glasses Volume (K) Forecast, by Application 2019 & 2032
- Table 17: Canada Anti Fog Safety Glasses Revenue (million) Forecast, by Application 2019 & 2032
- Table 18: Canada Anti Fog Safety Glasses Volume (K) Forecast, by Application 2019 & 2032
- Table 19: Mexico Anti Fog Safety Glasses Revenue (million) Forecast, by Application 2019 & 2032
- Table 20: Mexico Anti Fog Safety Glasses Volume (K) Forecast, by Application 2019 & 2032
- Table 21: Global Anti Fog Safety Glasses Revenue million Forecast, by Application 2019 & 2032
- Table 22: Global Anti Fog Safety Glasses Volume K Forecast, by Application 2019 & 2032
- Table 23: Global Anti Fog Safety Glasses Revenue million Forecast, by Types 2019 & 2032
- Table 24: Global Anti Fog Safety Glasses Volume K Forecast, by Types 2019 & 2032
- Table 25: Global Anti Fog Safety Glasses Revenue million Forecast, by Country 2019 & 2032
- Table 26: Global Anti Fog Safety Glasses Volume K Forecast, by Country 2019 & 2032
- Table 27: Brazil Anti Fog Safety Glasses Revenue (million) Forecast, by Application 2019 & 2032
- Table 28: Brazil Anti Fog Safety Glasses Volume (K) Forecast, by Application 2019 & 2032
- Table 29: Argentina Anti Fog Safety Glasses Revenue (million) Forecast, by Application 2019 & 2032
- Table 30: Argentina Anti Fog Safety Glasses Volume (K) Forecast, by Application 2019 & 2032
- Table 31: Rest of South America Anti Fog Safety Glasses Revenue (million) Forecast, by Application 2019 & 2032
- Table 32: Rest of South America Anti Fog Safety Glasses Volume (K) Forecast, by Application 2019 & 2032
- Table 33: Global Anti Fog Safety Glasses Revenue million Forecast, by Application 2019 & 2032
- Table 34: Global Anti Fog Safety Glasses Volume K Forecast, by Application 2019 & 2032
- Table 35: Global Anti Fog Safety Glasses Revenue million Forecast, by Types 2019 & 2032
- Table 36: Global Anti Fog Safety Glasses Volume K Forecast, by Types 2019 & 2032
- Table 37: Global Anti Fog Safety Glasses Revenue million Forecast, by Country 2019 & 2032
- Table 38: Global Anti Fog Safety Glasses Volume K Forecast, by Country 2019 & 2032
- Table 39: United Kingdom Anti Fog Safety Glasses Revenue (million) Forecast, by Application 2019 & 2032
- Table 40: United Kingdom Anti Fog Safety Glasses Volume (K) Forecast, by Application 2019 & 2032
- Table 41: Germany Anti Fog Safety Glasses Revenue (million) Forecast, by Application 2019 & 2032
- Table 42: Germany Anti Fog Safety Glasses Volume (K) Forecast, by Application 2019 & 2032
- Table 43: France Anti Fog Safety Glasses Revenue (million) Forecast, by Application 2019 & 2032
- Table 44: France Anti Fog Safety Glasses Volume (K) Forecast, by Application 2019 & 2032
- Table 45: Italy Anti Fog Safety Glasses Revenue (million) Forecast, by Application 2019 & 2032
- Table 46: Italy Anti Fog Safety Glasses Volume (K) Forecast, by Application 2019 & 2032
- Table 47: Spain Anti Fog Safety Glasses Revenue (million) Forecast, by Application 2019 & 2032
- Table 48: Spain Anti Fog Safety Glasses Volume (K) Forecast, by Application 2019 & 2032
- Table 49: Russia Anti Fog Safety Glasses Revenue (million) Forecast, by Application 2019 & 2032
- Table 50: Russia Anti Fog Safety Glasses Volume (K) Forecast, by Application 2019 & 2032
- Table 51: Benelux Anti Fog Safety Glasses Revenue (million) Forecast, by Application 2019 & 2032
- Table 52: Benelux Anti Fog Safety Glasses Volume (K) Forecast, by Application 2019 & 2032
- Table 53: Nordics Anti Fog Safety Glasses Revenue (million) Forecast, by Application 2019 & 2032
- Table 54: Nordics Anti Fog Safety Glasses Volume (K) Forecast, by Application 2019 & 2032
- Table 55: Rest of Europe Anti Fog Safety Glasses Revenue (million) Forecast, by Application 2019 & 2032
- Table 56: Rest of Europe Anti Fog Safety Glasses Volume (K) Forecast, by Application 2019 & 2032
- Table 57: Global Anti Fog Safety Glasses Revenue million Forecast, by Application 2019 & 2032
- Table 58: Global Anti Fog Safety Glasses Volume K Forecast, by Application 2019 & 2032
- Table 59: Global Anti Fog Safety Glasses Revenue million Forecast, by Types 2019 & 2032
- Table 60: Global Anti Fog Safety Glasses Volume K Forecast, by Types 2019 & 2032
- Table 61: Global Anti Fog Safety Glasses Revenue million Forecast, by Country 2019 & 2032
- Table 62: Global Anti Fog Safety Glasses Volume K Forecast, by Country 2019 & 2032
- Table 63: Turkey Anti Fog Safety Glasses Revenue (million) Forecast, by Application 2019 & 2032
- Table 64: Turkey Anti Fog Safety Glasses Volume (K) Forecast, by Application 2019 & 2032
- Table 65: Israel Anti Fog Safety Glasses Revenue (million) Forecast, by Application 2019 & 2032
- Table 66: Israel Anti Fog Safety Glasses Volume (K) Forecast, by Application 2019 & 2032
- Table 67: GCC Anti Fog Safety Glasses Revenue (million) Forecast, by Application 2019 & 2032
- Table 68: GCC Anti Fog Safety Glasses Volume (K) Forecast, by Application 2019 & 2032
- Table 69: North Africa Anti Fog Safety Glasses Revenue (million) Forecast, by Application 2019 & 2032
- Table 70: North Africa Anti Fog Safety Glasses Volume (K) Forecast, by Application 2019 & 2032
- Table 71: South Africa Anti Fog Safety Glasses Revenue (million) Forecast, by Application 2019 & 2032
- Table 72: South Africa Anti Fog Safety Glasses Volume (K) Forecast, by Application 2019 & 2032
- Table 73: Rest of Middle East & Africa Anti Fog Safety Glasses Revenue (million) Forecast, by Application 2019 & 2032
- Table 74: Rest of Middle East & Africa Anti Fog Safety Glasses Volume (K) Forecast, by Application 2019 & 2032
- Table 75: Global Anti Fog Safety Glasses Revenue million Forecast, by Application 2019 & 2032
- Table 76: Global Anti Fog Safety Glasses Volume K Forecast, by Application 2019 & 2032
- Table 77: Global Anti Fog Safety Glasses Revenue million Forecast, by Types 2019 & 2032
- Table 78: Global Anti Fog Safety Glasses Volume K Forecast, by Types 2019 & 2032
- Table 79: Global Anti Fog Safety Glasses Revenue million Forecast, by Country 2019 & 2032
- Table 80: Global Anti Fog Safety Glasses Volume K Forecast, by Country 2019 & 2032
- Table 81: China Anti Fog Safety Glasses Revenue (million) Forecast, by Application 2019 & 2032
- Table 82: China Anti Fog Safety Glasses Volume (K) Forecast, by Application 2019 & 2032
- Table 83: India Anti Fog Safety Glasses Revenue (million) Forecast, by Application 2019 & 2032
- Table 84: India Anti Fog Safety Glasses Volume (K) Forecast, by Application 2019 & 2032
- Table 85: Japan Anti Fog Safety Glasses Revenue (million) Forecast, by Application 2019 & 2032
- Table 86: Japan Anti Fog Safety Glasses Volume (K) Forecast, by Application 2019 & 2032
- Table 87: South Korea Anti Fog Safety Glasses Revenue (million) Forecast, by Application 2019 & 2032
- Table 88: South Korea Anti Fog Safety Glasses Volume (K) Forecast, by Application 2019 & 2032
- Table 89: ASEAN Anti Fog Safety Glasses Revenue (million) Forecast, by Application 2019 & 2032
- Table 90: ASEAN Anti Fog Safety Glasses Volume (K) Forecast, by Application 2019 & 2032
- Table 91: Oceania Anti Fog Safety Glasses Revenue (million) Forecast, by Application 2019 & 2032
- Table 92: Oceania Anti Fog Safety Glasses Volume (K) Forecast, by Application 2019 & 2032
- Table 93: Rest of Asia Pacific Anti Fog Safety Glasses Revenue (million) Forecast, by Application 2019 & 2032
- Table 94: Rest of Asia Pacific Anti Fog Safety Glasses Volume (K) Forecast, by Application 2019 & 2032
Frequently Asked Questions
1. What is the projected Compound Annual Growth Rate (CAGR) of the Anti Fog Safety Glasses?
The projected CAGR is approximately XX%.
2. Which companies are prominent players in the Anti Fog Safety Glasses?
Key companies in the market include Honeywell, 3M, Draeger, DEWALT, Msa Safety, Ansell, Kimberly-Clark, Delta Plus, Protective Industrial Products, COFRA, Cordova Safety Products, Lakeland Industries, Bullard, Elvex Corporation, Yamamoto Kogaku, Pyramex Safety, Woshine Group.
3. What are the main segments of the Anti Fog Safety Glasses?
The market segments include Application, Types.
4. Can you provide details about the market size?
The market size is estimated to be USD XXX million as of 2022.
5. What are some drivers contributing to market growth?
N/A
6. What are the notable trends driving market growth?
N/A
7. Are there any restraints impacting market growth?
N/A
8. Can you provide examples of recent developments in the market?
N/A
9. What pricing options are available for accessing the report?
Pricing options include single-user, multi-user, and enterprise licenses priced at USD 3950.00, USD 5925.00, and USD 7900.00 respectively.
10. Is the market size provided in terms of value or volume?
The market size is provided in terms of value, measured in million and volume, measured in K.
11. Are there any specific market keywords associated with the report?
Yes, the market keyword associated with the report is "Anti Fog Safety Glasses," which aids in identifying and referencing the specific market segment covered.
12. How do I determine which pricing option suits my needs best?
The pricing options vary based on user requirements and access needs. Individual users may opt for single-user licenses, while businesses requiring broader access may choose multi-user or enterprise licenses for cost-effective access to the report.
13. Are there any additional resources or data provided in the Anti Fog Safety Glasses report?
While the report offers comprehensive insights, it's advisable to review the specific contents or supplementary materials provided to ascertain if additional resources or data are available.
14. How can I stay updated on further developments or reports in the Anti Fog Safety Glasses?
To stay informed about further developments, trends, and reports in the Anti Fog Safety Glasses, consider subscribing to industry newsletters, following relevant companies and organizations, or regularly checking reputable industry news sources and publications.
Methodology
Step 1 - Identification of Relevant Samples Size from Population Database


Step 2 - Approaches for Defining Global Market Size (Value, Volume* & Price*)

Note*: In applicable scenarios
Step 3 - Data Sources
Primary Research
- Web Analytics
- Survey Reports
- Research Institute
- Latest Research Reports
- Opinion Leaders
Secondary Research
- Annual Reports
- White Paper
- Latest Press Release
- Industry Association
- Paid Database
- Investor Presentations

Step 4 - Data Triangulation
Involves using different sources of information in order to increase the validity of a study
These sources are likely to be stakeholders in a program - participants, other researchers, program staff, other community members, and so on.
Then we put all data in single framework & apply various statistical tools to find out the dynamic on the market.
During the analysis stage, feedback from the stakeholder groups would be compared to determine areas of agreement as well as areas of divergence
