

Key Insights
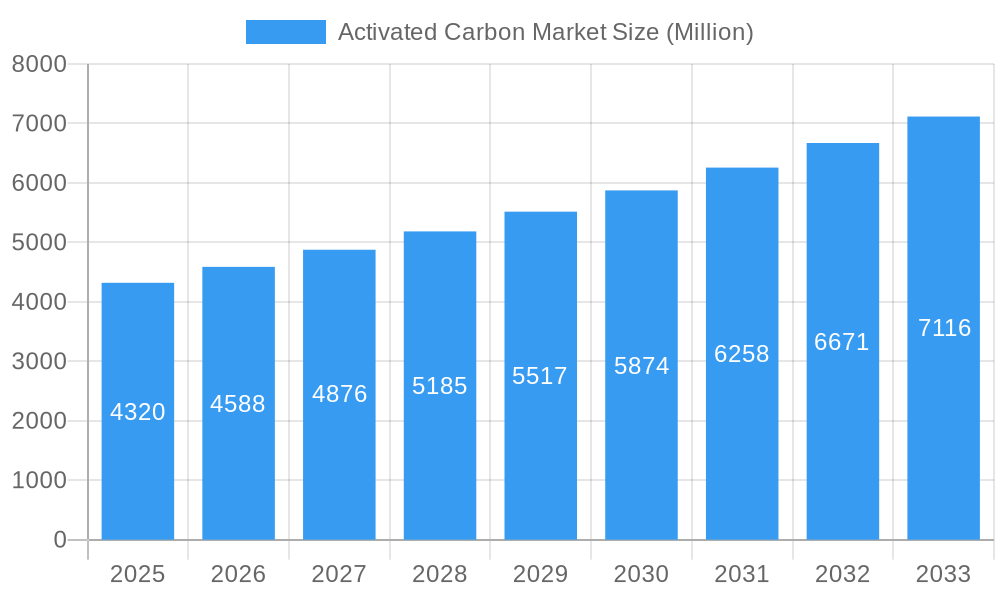
The global activated carbon market, valued at $4.32 billion in 2025, is projected to experience robust growth, driven by increasing demand across diverse applications. A Compound Annual Growth Rate (CAGR) of 5.95% from 2025 to 2033 indicates a significant expansion, primarily fueled by the burgeoning water and wastewater treatment sectors. Stringent environmental regulations globally are pushing industries to adopt advanced purification technologies, boosting the demand for activated carbon in gas purification and industrial processing. The rise in pollution levels and the consequent need for cleaner air and water are key drivers. Furthermore, growth within the food and beverage industry, particularly in areas requiring enhanced filtration and purification, contributes significantly to market expansion. Powdered Activated Carbons (PAC) currently hold a major market share due to their cost-effectiveness and widespread applications, but the demand for higher-performance, specialized carbons like extruded and pelletized varieties is expected to grow steadily. The Asia-Pacific region, particularly China and India, is expected to dominate the market due to rapid industrialization and expanding infrastructure projects. However, challenges such as fluctuating raw material prices and the potential for alternative technologies to emerge present some restraints.
Activated Carbon Market Market Size (In Billion)
The market segmentation reveals a dynamic landscape. While the water treatment sector remains the largest end-user, significant growth opportunities exist in the healthcare and automotive industries, driven by applications in pharmaceutical production and emission control systems respectively. The competitive landscape is characterized by a mix of large multinational corporations and specialized regional players. Companies are focusing on innovation, strategic partnerships, and geographical expansion to maintain a competitive edge. The forecast period of 2025-2033 suggests continued expansion, with potential for accelerated growth driven by technological advancements leading to enhanced product performance and new applications in emerging sectors. The market is anticipated to witness increased consolidation and strategic collaborations among key players as they strive to capitalize on the increasing demand for sustainable and efficient purification solutions.
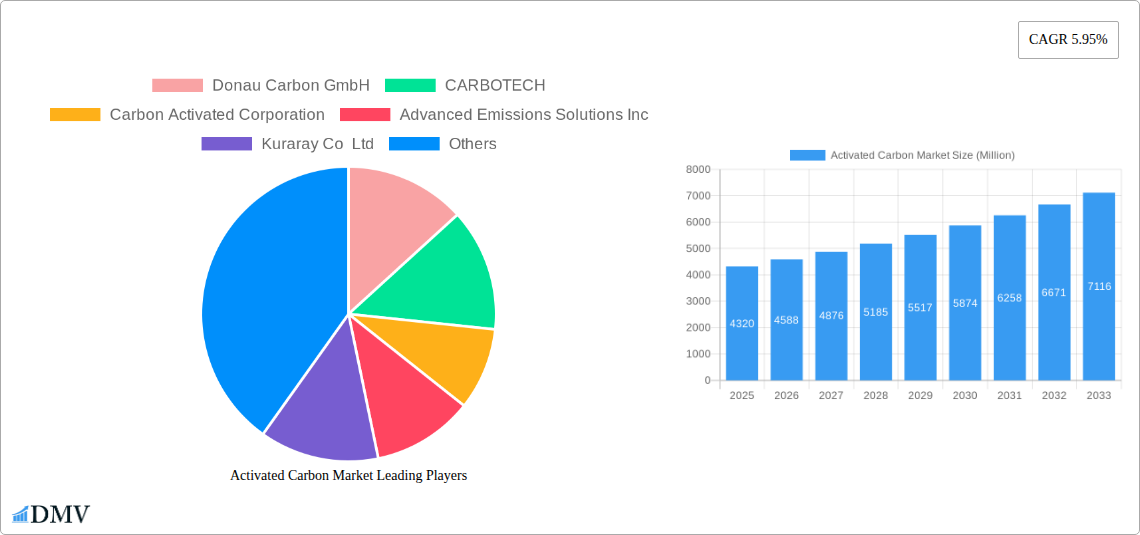
Activated Carbon Market Company Market Share
Activated Carbon Market: A Comprehensive Report (2019-2033)
This insightful report provides a comprehensive analysis of the global Activated Carbon Market, offering a detailed examination of market dynamics, key players, and future growth prospects. The study period spans from 2019 to 2033, with 2025 serving as the base and estimated year. The report utilizes a robust methodology to forecast market trends from 2025 to 2033, providing stakeholders with actionable insights to navigate this dynamic industry. The market size is projected to reach xx Million by 2033.
Activated Carbon Market Composition & Trends
This section delves into the competitive landscape of the Activated Carbon Market, analyzing market concentration, innovation drivers, regulatory factors, substitute products, end-user profiles, and mergers and acquisitions (M&A) activity. The market is characterized by a moderately concentrated structure, with several key players holding significant market share. The global market is estimated at xx Million in 2025.
Market Share Distribution: The top five players command approximately xx% of the market share, while smaller players account for the remaining xx%. This share is expected to shift slightly by 2033 due to M&A activity and technological advancements.
Innovation Catalysts: Stringent environmental regulations and growing demand for water and air purification are driving innovation in activated carbon production techniques, leading to higher-performance materials with enhanced adsorption capabilities.
Regulatory Landscape: Varying environmental regulations across different regions influence the demand and production of activated carbon, creating both opportunities and challenges for market participants.
Substitute Products: While activated carbon possesses unique properties, alternative technologies such as membrane filtration and other adsorption materials pose some competitive pressure, albeit limited due to activated carbon's versatility.
End-User Profiles: Key end-user industries include water treatment, food and beverage, healthcare, automotive, and industrial processing. These sectors' specific needs and preferences shape product development and market segmentation.
M&A Activity: Significant M&A activity has been observed, exemplified by Cabot Corporation’s divestment of its activated carbon unit, Norit, in March 2022. Such transactions can lead to market consolidation and reshape the competitive dynamics, impacting future market valuations at an estimated value of xx Million in 2025 for these deals. Further consolidations are anticipated in the coming years.
Activated Carbon Market Industry Evolution
This section analyzes the historical (2019-2024) and projected (2025-2033) growth trajectories of the Activated Carbon Market, factoring in technological advancements and evolving consumer demands. The market experienced a Compound Annual Growth Rate (CAGR) of xx% during the historical period, driven by increasing environmental concerns and stricter emission norms globally. The market is projected to maintain a CAGR of xx% during the forecast period (2025-2033), fueled by emerging applications in various sectors. The overall market size is expected to reach xx Million by 2033, reflecting robust growth. The adoption rate of advanced activated carbon technologies, such as those employing novel materials and improved manufacturing processes, has shown a steady increase of xx% annually, with expectations for a similar increase in the coming years.
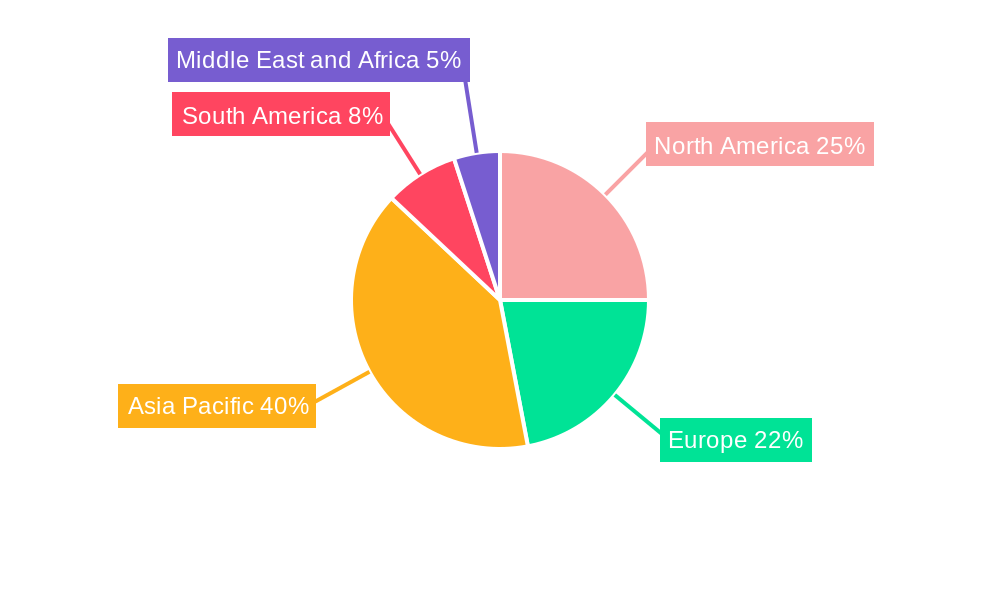
Leading Regions, Countries, or Segments in Activated Carbon Market
This section identifies the leading regions, countries, and segments within the Activated Carbon Market.
By Product Type: Granular Activated Carbons (GAC) currently hold the largest market share due to their extensive applications in water and gas purification. However, Powdered Activated Carbons (PAC) are anticipated to witness significant growth due to their cost-effectiveness in certain applications. Extruded or pelletized activated carbon also holds a significant share, with growth expected in niche applications.
By Application: Water purification dominates the market, driven by the rising global demand for clean water. Gas purification is another major application area, with increasing environmental regulations driving growth. Metal extraction and medical applications contribute substantially.
By End-user Industry: The water treatment industry is the largest end-user, followed by the food and beverage industry. Healthcare and industrial processing sectors also contribute considerably to the market's growth.
Key Drivers:
- Stringent Environmental Regulations: Governments worldwide are implementing stricter environmental regulations, driving the adoption of activated carbon for pollution control.
- Rising Demand for Clean Water: The growing global population and increasing industrialization are escalating the demand for clean water, fueling the growth of the water purification segment.
- Technological Advancements: Continuous innovations in activated carbon production are enhancing its performance and expanding its applications.
The dominance of specific regions and countries is largely influenced by industrial development, environmental regulations, and government initiatives supporting water and air purification projects.
Activated Carbon Market Product Innovations
Recent innovations focus on enhancing activated carbon's adsorption capacity, improving its durability, and expanding its applications. New materials and manufacturing techniques are being explored to create more efficient and cost-effective activated carbon products. These innovations, such as the development of activated carbons with improved selectivity for specific pollutants, contribute to the market's overall growth. The integration of nanotechnology and advanced surface modification techniques enhance the efficiency and performance metrics of the product.
Propelling Factors for Activated Carbon Market Growth
The Activated Carbon Market is fueled by several key factors. Firstly, stringent environmental regulations worldwide mandate the use of effective pollution control technologies, driving demand. Secondly, the growing demand for clean water and air, particularly in developing economies, significantly boosts market growth. Technological advancements continually improve activated carbon's efficiency and broaden its application range. Furthermore, the rising adoption of activated carbon in various industries, like food and beverage processing and pharmaceutical manufacturing, further contributes to market expansion.
Obstacles in the Activated Carbon Market
The Activated Carbon Market faces challenges including fluctuating raw material prices, impacting production costs. Supply chain disruptions and dependence on specific raw materials can restrict supply and increase price volatility. Intense competition among existing players necessitates constant innovation and cost optimization. Furthermore, the stringent regulatory landscape in certain regions and environmental concerns related to carbon disposal pose potential obstacles.
Future Opportunities in Activated Carbon Market
The Activated Carbon Market holds immense potential for growth. Emerging applications in new sectors, such as energy storage and advanced filtration systems, offer significant opportunities. Technological advancements, particularly in nanotechnology and material science, can further enhance activated carbon's performance and expand its usage. Moreover, exploring sustainable production methods and responsible disposal practices will address environmental concerns and secure future market expansion.
Major Players in the Activated Carbon Market Ecosystem
- Donau Carbon GmbH
- CARBOTECH
- Carbon Activated Corporation
- Advanced Emissions Solutions Inc
- Kuraray Co Ltd
- CPL Activated Carbons
- Evoqua Water Technologies LLC
- Cabot Corporation
- Kureha Corporation
- Ingevity
- Silcarbon Aktivkohle GmbH
- Haycarb (Pvt ) Ltd
- Puragen Activated Carbons
- Jacobi Carbons Group
- Albemarle Corporation
- Veolia (Veolia Water Technologies)
- List Not Exhaustive
Key Developments in Activated Carbon Market Industry
- March 2022: Cabot Corporation sold its activated carbon unit, Norit Activated Carbon, to One Equity Partners, creating an independent player with a significant global footprint and potentially influencing market competition.
Strategic Activated Carbon Market Forecast
The Activated Carbon Market is poised for robust growth, driven by increasing environmental awareness, technological advancements, and expanding applications across diverse industries. Future market potential is substantial, particularly in emerging economies and with the development of innovative activated carbon materials tailored to specific applications. Sustained growth is expected, with a significant expansion in market size, reinforcing its importance in addressing global environmental challenges and enhancing various industrial processes.
Activated Carbon Market Segmentation
-
1. Product Type
- 1.1. Powdered Activated Carbons (PAC)
- 1.2. Granular Activated Carbons (GAC)
- 1.3. Extruded or Pelletized Activated Carbon
-
2. Application
- 2.1. Gas Purification
- 2.2. Water Purification
- 2.3. Metal Extraction
- 2.4. Medicine
- 2.5. Other Applications
-
3. End-user Industry
- 3.1. Water Treatment
- 3.2. Food and Beverage
- 3.3. Healthcare
- 3.4. Automotive
- 3.5. Industrial Processing
- 3.6. Other End-user Industries
Activated Carbon Market Segmentation By Geography
-
1. Asia Pacific
- 1.1. China
- 1.2. India
- 1.3. Japan
- 1.4. South Korea
- 1.5. Rest of Asia Pacific
-
2. North America
- 2.1. United States
- 2.2. Canada
- 2.3. Mexico
-
3. Europe
- 3.1. Germany
- 3.2. United Kingdom
- 3.3. France
- 3.4. Italy
- 3.5. Spain
- 3.6. Rest of Europe
-
4. South America
- 4.1. Brazil
- 4.2. Argentina
- 4.3. Rest of South America
-
5. Middle East and Africa
- 5.1. Saudi Arabia
- 5.2. South Africa
- 5.3. Rest of Middle East and Africa
Activated Carbon Market Regional Market Share
Geographic Coverage of Activated Carbon Market
Activated Carbon Market REPORT HIGHLIGHTS
| Aspects | Details |
|---|---|
| Study Period | 2020-2034 |
| Base Year | 2025 |
| Estimated Year | 2026 |
| Forecast Period | 2026-2034 |
| Historical Period | 2020-2025 |
| Growth Rate | CAGR of 5.95% from 2020-2034 |
| Segmentation |
|
Table of Contents
- 1. Introduction
- 1.1. Research Scope
- 1.2. Market Segmentation
- 1.3. Research Objective
- 1.4. Definitions and Assumptions
- 2. Executive Summary
- 2.1. Market Snapshot
- 3. Market Dynamics
- 3.1. Market Drivers
- 3.2. Market Restrains
- 3.3. Market Trends
- 3.4. Market Opportunities
- 4. Market Factor Analysis
- 4.1. Porters Five Forces
- 4.1.1. Bargaining Power of Suppliers
- 4.1.2. Bargaining Power of Buyers
- 4.1.3. Threat of New Entrants
- 4.1.4. Threat of Substitutes
- 4.1.5. Competitive Rivalry
- 4.2. PESTEL analysis
- 4.3. BCG Analysis
- 4.3.1. Stars (High Growth, High Market Share)
- 4.3.2. Cash Cows (Low Growth, High Market Share)
- 4.3.3. Question Mark (High Growth, Low Market Share)
- 4.3.4. Dogs (Low Growth, Low Market Share)
- 4.4. Ansoff Matrix Analysis
- 4.5. Supply Chain Analysis
- 4.6. Regulatory Landscape
- 4.7. Current Market Potential and Opportunity Assessment (TAM–SAM–SOM Framework)
- 4.8. DMV Analyst Note
- 4.1. Porters Five Forces
- 5. Market Analysis, Insights and Forecast 2021-2033
- 5.1. Market Analysis, Insights and Forecast - by Product Type
- 5.1.1. Powdered Activated Carbons (PAC)
- 5.1.2. Granular Activated Carbons (GAC)
- 5.1.3. Extruded or Pelletized Activated Carbon
- 5.2. Market Analysis, Insights and Forecast - by Application
- 5.2.1. Gas Purification
- 5.2.2. Water Purification
- 5.2.3. Metal Extraction
- 5.2.4. Medicine
- 5.2.5. Other Applications
- 5.3. Market Analysis, Insights and Forecast - by End-user Industry
- 5.3.1. Water Treatment
- 5.3.2. Food and Beverage
- 5.3.3. Healthcare
- 5.3.4. Automotive
- 5.3.5. Industrial Processing
- 5.3.6. Other End-user Industries
- 5.4. Market Analysis, Insights and Forecast - by Region
- 5.4.1. Asia Pacific
- 5.4.2. North America
- 5.4.3. Europe
- 5.4.4. South America
- 5.4.5. Middle East and Africa
- 5.1. Market Analysis, Insights and Forecast - by Product Type
- 6. Global Activated Carbon Market Analysis, Insights and Forecast, 2021-2033
- 6.1. Market Analysis, Insights and Forecast - by Product Type
- 6.1.1. Powdered Activated Carbons (PAC)
- 6.1.2. Granular Activated Carbons (GAC)
- 6.1.3. Extruded or Pelletized Activated Carbon
- 6.2. Market Analysis, Insights and Forecast - by Application
- 6.2.1. Gas Purification
- 6.2.2. Water Purification
- 6.2.3. Metal Extraction
- 6.2.4. Medicine
- 6.2.5. Other Applications
- 6.3. Market Analysis, Insights and Forecast - by End-user Industry
- 6.3.1. Water Treatment
- 6.3.2. Food and Beverage
- 6.3.3. Healthcare
- 6.3.4. Automotive
- 6.3.5. Industrial Processing
- 6.3.6. Other End-user Industries
- 6.1. Market Analysis, Insights and Forecast - by Product Type
- 7. Asia Pacific Activated Carbon Market Analysis, Insights and Forecast, 2020-2032
- 7.1. Market Analysis, Insights and Forecast - by Product Type
- 7.1.1. Powdered Activated Carbons (PAC)
- 7.1.2. Granular Activated Carbons (GAC)
- 7.1.3. Extruded or Pelletized Activated Carbon
- 7.2. Market Analysis, Insights and Forecast - by Application
- 7.2.1. Gas Purification
- 7.2.2. Water Purification
- 7.2.3. Metal Extraction
- 7.2.4. Medicine
- 7.2.5. Other Applications
- 7.3. Market Analysis, Insights and Forecast - by End-user Industry
- 7.3.1. Water Treatment
- 7.3.2. Food and Beverage
- 7.3.3. Healthcare
- 7.3.4. Automotive
- 7.3.5. Industrial Processing
- 7.3.6. Other End-user Industries
- 7.1. Market Analysis, Insights and Forecast - by Product Type
- 8. North America Activated Carbon Market Analysis, Insights and Forecast, 2020-2032
- 8.1. Market Analysis, Insights and Forecast - by Product Type
- 8.1.1. Powdered Activated Carbons (PAC)
- 8.1.2. Granular Activated Carbons (GAC)
- 8.1.3. Extruded or Pelletized Activated Carbon
- 8.2. Market Analysis, Insights and Forecast - by Application
- 8.2.1. Gas Purification
- 8.2.2. Water Purification
- 8.2.3. Metal Extraction
- 8.2.4. Medicine
- 8.2.5. Other Applications
- 8.3. Market Analysis, Insights and Forecast - by End-user Industry
- 8.3.1. Water Treatment
- 8.3.2. Food and Beverage
- 8.3.3. Healthcare
- 8.3.4. Automotive
- 8.3.5. Industrial Processing
- 8.3.6. Other End-user Industries
- 8.1. Market Analysis, Insights and Forecast - by Product Type
- 9. Europe Activated Carbon Market Analysis, Insights and Forecast, 2020-2032
- 9.1. Market Analysis, Insights and Forecast - by Product Type
- 9.1.1. Powdered Activated Carbons (PAC)
- 9.1.2. Granular Activated Carbons (GAC)
- 9.1.3. Extruded or Pelletized Activated Carbon
- 9.2. Market Analysis, Insights and Forecast - by Application
- 9.2.1. Gas Purification
- 9.2.2. Water Purification
- 9.2.3. Metal Extraction
- 9.2.4. Medicine
- 9.2.5. Other Applications
- 9.3. Market Analysis, Insights and Forecast - by End-user Industry
- 9.3.1. Water Treatment
- 9.3.2. Food and Beverage
- 9.3.3. Healthcare
- 9.3.4. Automotive
- 9.3.5. Industrial Processing
- 9.3.6. Other End-user Industries
- 9.1. Market Analysis, Insights and Forecast - by Product Type
- 10. South America Activated Carbon Market Analysis, Insights and Forecast, 2020-2032
- 10.1. Market Analysis, Insights and Forecast - by Product Type
- 10.1.1. Powdered Activated Carbons (PAC)
- 10.1.2. Granular Activated Carbons (GAC)
- 10.1.3. Extruded or Pelletized Activated Carbon
- 10.2. Market Analysis, Insights and Forecast - by Application
- 10.2.1. Gas Purification
- 10.2.2. Water Purification
- 10.2.3. Metal Extraction
- 10.2.4. Medicine
- 10.2.5. Other Applications
- 10.3. Market Analysis, Insights and Forecast - by End-user Industry
- 10.3.1. Water Treatment
- 10.3.2. Food and Beverage
- 10.3.3. Healthcare
- 10.3.4. Automotive
- 10.3.5. Industrial Processing
- 10.3.6. Other End-user Industries
- 10.1. Market Analysis, Insights and Forecast - by Product Type
- 11. Middle East and Africa Activated Carbon Market Analysis, Insights and Forecast, 2020-2032
- 11.1. Market Analysis, Insights and Forecast - by Product Type
- 11.1.1. Powdered Activated Carbons (PAC)
- 11.1.2. Granular Activated Carbons (GAC)
- 11.1.3. Extruded or Pelletized Activated Carbon
- 11.2. Market Analysis, Insights and Forecast - by Application
- 11.2.1. Gas Purification
- 11.2.2. Water Purification
- 11.2.3. Metal Extraction
- 11.2.4. Medicine
- 11.2.5. Other Applications
- 11.3. Market Analysis, Insights and Forecast - by End-user Industry
- 11.3.1. Water Treatment
- 11.3.2. Food and Beverage
- 11.3.3. Healthcare
- 11.3.4. Automotive
- 11.3.5. Industrial Processing
- 11.3.6. Other End-user Industries
- 11.1. Market Analysis, Insights and Forecast - by Product Type
- 12. Competitive Analysis
- 12.1. Company Profiles
- 12.1.1 Donau Carbon GmbH
- 12.1.1.1. Company Overview
- 12.1.1.2. Products
- 12.1.1.3. Company Financials
- 12.1.1.4. SWOT Analysis
- 12.1.2 CARBOTECH
- 12.1.2.1. Company Overview
- 12.1.2.2. Products
- 12.1.2.3. Company Financials
- 12.1.2.4. SWOT Analysis
- 12.1.3 Carbon Activated Corporation
- 12.1.3.1. Company Overview
- 12.1.3.2. Products
- 12.1.3.3. Company Financials
- 12.1.3.4. SWOT Analysis
- 12.1.4 Advanced Emissions Solutions Inc
- 12.1.4.1. Company Overview
- 12.1.4.2. Products
- 12.1.4.3. Company Financials
- 12.1.4.4. SWOT Analysis
- 12.1.5 Kuraray Co Ltd
- 12.1.5.1. Company Overview
- 12.1.5.2. Products
- 12.1.5.3. Company Financials
- 12.1.5.4. SWOT Analysis
- 12.1.6 CPL Activated Carbons
- 12.1.6.1. Company Overview
- 12.1.6.2. Products
- 12.1.6.3. Company Financials
- 12.1.6.4. SWOT Analysis
- 12.1.7 Evoqua Water Technologies LLC
- 12.1.7.1. Company Overview
- 12.1.7.2. Products
- 12.1.7.3. Company Financials
- 12.1.7.4. SWOT Analysis
- 12.1.8 Cabot Corporation
- 12.1.8.1. Company Overview
- 12.1.8.2. Products
- 12.1.8.3. Company Financials
- 12.1.8.4. SWOT Analysis
- 12.1.9 Kureha Corporation
- 12.1.9.1. Company Overview
- 12.1.9.2. Products
- 12.1.9.3. Company Financials
- 12.1.9.4. SWOT Analysis
- 12.1.10 Ingevity
- 12.1.10.1. Company Overview
- 12.1.10.2. Products
- 12.1.10.3. Company Financials
- 12.1.10.4. SWOT Analysis
- 12.1.11 Silcarbon Aktivkohle GmbH
- 12.1.11.1. Company Overview
- 12.1.11.2. Products
- 12.1.11.3. Company Financials
- 12.1.11.4. SWOT Analysis
- 12.1.12 Haycarb (Pvt ) Ltd
- 12.1.12.1. Company Overview
- 12.1.12.2. Products
- 12.1.12.3. Company Financials
- 12.1.12.4. SWOT Analysis
- 12.1.13 Puragen Activated Carbons
- 12.1.13.1. Company Overview
- 12.1.13.2. Products
- 12.1.13.3. Company Financials
- 12.1.13.4. SWOT Analysis
- 12.1.14 Jacobi Carbons Group
- 12.1.14.1. Company Overview
- 12.1.14.2. Products
- 12.1.14.3. Company Financials
- 12.1.14.4. SWOT Analysis
- 12.1.15 Albemarle Corporation
- 12.1.15.1. Company Overview
- 12.1.15.2. Products
- 12.1.15.3. Company Financials
- 12.1.15.4. SWOT Analysis
- 12.1.16 Veolia (Veolia Water Technologies)*List Not Exhaustive
- 12.1.16.1. Company Overview
- 12.1.16.2. Products
- 12.1.16.3. Company Financials
- 12.1.16.4. SWOT Analysis
- 12.1.1 Donau Carbon GmbH
- 12.2. Market Entropy
- 12.2.1 Company's Key Areas Served
- 12.2.2 Recent Developments
- 12.3. Company Market Share Analysis 2025
- 12.3.1 Top 5 Companies Market Share Analysis
- 12.3.2 Top 3 Companies Market Share Analysis
- 12.4. List of Potential Customers
- 13. Research Methodology
List of Figures
- Figure 1: Global Activated Carbon Market Revenue Breakdown (Million, %) by Region 2025 & 2033
- Figure 2: Asia Pacific Activated Carbon Market Revenue (Million), by Product Type 2025 & 2033
- Figure 3: Asia Pacific Activated Carbon Market Revenue Share (%), by Product Type 2025 & 2033
- Figure 4: Asia Pacific Activated Carbon Market Revenue (Million), by Application 2025 & 2033
- Figure 5: Asia Pacific Activated Carbon Market Revenue Share (%), by Application 2025 & 2033
- Figure 6: Asia Pacific Activated Carbon Market Revenue (Million), by End-user Industry 2025 & 2033
- Figure 7: Asia Pacific Activated Carbon Market Revenue Share (%), by End-user Industry 2025 & 2033
- Figure 8: Asia Pacific Activated Carbon Market Revenue (Million), by Country 2025 & 2033
- Figure 9: Asia Pacific Activated Carbon Market Revenue Share (%), by Country 2025 & 2033
- Figure 10: North America Activated Carbon Market Revenue (Million), by Product Type 2025 & 2033
- Figure 11: North America Activated Carbon Market Revenue Share (%), by Product Type 2025 & 2033
- Figure 12: North America Activated Carbon Market Revenue (Million), by Application 2025 & 2033
- Figure 13: North America Activated Carbon Market Revenue Share (%), by Application 2025 & 2033
- Figure 14: North America Activated Carbon Market Revenue (Million), by End-user Industry 2025 & 2033
- Figure 15: North America Activated Carbon Market Revenue Share (%), by End-user Industry 2025 & 2033
- Figure 16: North America Activated Carbon Market Revenue (Million), by Country 2025 & 2033
- Figure 17: North America Activated Carbon Market Revenue Share (%), by Country 2025 & 2033
- Figure 18: Europe Activated Carbon Market Revenue (Million), by Product Type 2025 & 2033
- Figure 19: Europe Activated Carbon Market Revenue Share (%), by Product Type 2025 & 2033
- Figure 20: Europe Activated Carbon Market Revenue (Million), by Application 2025 & 2033
- Figure 21: Europe Activated Carbon Market Revenue Share (%), by Application 2025 & 2033
- Figure 22: Europe Activated Carbon Market Revenue (Million), by End-user Industry 2025 & 2033
- Figure 23: Europe Activated Carbon Market Revenue Share (%), by End-user Industry 2025 & 2033
- Figure 24: Europe Activated Carbon Market Revenue (Million), by Country 2025 & 2033
- Figure 25: Europe Activated Carbon Market Revenue Share (%), by Country 2025 & 2033
- Figure 26: South America Activated Carbon Market Revenue (Million), by Product Type 2025 & 2033
- Figure 27: South America Activated Carbon Market Revenue Share (%), by Product Type 2025 & 2033
- Figure 28: South America Activated Carbon Market Revenue (Million), by Application 2025 & 2033
- Figure 29: South America Activated Carbon Market Revenue Share (%), by Application 2025 & 2033
- Figure 30: South America Activated Carbon Market Revenue (Million), by End-user Industry 2025 & 2033
- Figure 31: South America Activated Carbon Market Revenue Share (%), by End-user Industry 2025 & 2033
- Figure 32: South America Activated Carbon Market Revenue (Million), by Country 2025 & 2033
- Figure 33: South America Activated Carbon Market Revenue Share (%), by Country 2025 & 2033
- Figure 34: Middle East and Africa Activated Carbon Market Revenue (Million), by Product Type 2025 & 2033
- Figure 35: Middle East and Africa Activated Carbon Market Revenue Share (%), by Product Type 2025 & 2033
- Figure 36: Middle East and Africa Activated Carbon Market Revenue (Million), by Application 2025 & 2033
- Figure 37: Middle East and Africa Activated Carbon Market Revenue Share (%), by Application 2025 & 2033
- Figure 38: Middle East and Africa Activated Carbon Market Revenue (Million), by End-user Industry 2025 & 2033
- Figure 39: Middle East and Africa Activated Carbon Market Revenue Share (%), by End-user Industry 2025 & 2033
- Figure 40: Middle East and Africa Activated Carbon Market Revenue (Million), by Country 2025 & 2033
- Figure 41: Middle East and Africa Activated Carbon Market Revenue Share (%), by Country 2025 & 2033
List of Tables
- Table 1: Global Activated Carbon Market Revenue Million Forecast, by Product Type 2020 & 2033
- Table 2: Global Activated Carbon Market Revenue Million Forecast, by Application 2020 & 2033
- Table 3: Global Activated Carbon Market Revenue Million Forecast, by End-user Industry 2020 & 2033
- Table 4: Global Activated Carbon Market Revenue Million Forecast, by Region 2020 & 2033
- Table 5: Global Activated Carbon Market Revenue Million Forecast, by Product Type 2020 & 2033
- Table 6: Global Activated Carbon Market Revenue Million Forecast, by Application 2020 & 2033
- Table 7: Global Activated Carbon Market Revenue Million Forecast, by End-user Industry 2020 & 2033
- Table 8: Global Activated Carbon Market Revenue Million Forecast, by Country 2020 & 2033
- Table 9: China Activated Carbon Market Revenue (Million) Forecast, by Application 2020 & 2033
- Table 10: India Activated Carbon Market Revenue (Million) Forecast, by Application 2020 & 2033
- Table 11: Japan Activated Carbon Market Revenue (Million) Forecast, by Application 2020 & 2033
- Table 12: South Korea Activated Carbon Market Revenue (Million) Forecast, by Application 2020 & 2033
- Table 13: Rest of Asia Pacific Activated Carbon Market Revenue (Million) Forecast, by Application 2020 & 2033
- Table 14: Global Activated Carbon Market Revenue Million Forecast, by Product Type 2020 & 2033
- Table 15: Global Activated Carbon Market Revenue Million Forecast, by Application 2020 & 2033
- Table 16: Global Activated Carbon Market Revenue Million Forecast, by End-user Industry 2020 & 2033
- Table 17: Global Activated Carbon Market Revenue Million Forecast, by Country 2020 & 2033
- Table 18: United States Activated Carbon Market Revenue (Million) Forecast, by Application 2020 & 2033
- Table 19: Canada Activated Carbon Market Revenue (Million) Forecast, by Application 2020 & 2033
- Table 20: Mexico Activated Carbon Market Revenue (Million) Forecast, by Application 2020 & 2033
- Table 21: Global Activated Carbon Market Revenue Million Forecast, by Product Type 2020 & 2033
- Table 22: Global Activated Carbon Market Revenue Million Forecast, by Application 2020 & 2033
- Table 23: Global Activated Carbon Market Revenue Million Forecast, by End-user Industry 2020 & 2033
- Table 24: Global Activated Carbon Market Revenue Million Forecast, by Country 2020 & 2033
- Table 25: Germany Activated Carbon Market Revenue (Million) Forecast, by Application 2020 & 2033
- Table 26: United Kingdom Activated Carbon Market Revenue (Million) Forecast, by Application 2020 & 2033
- Table 27: France Activated Carbon Market Revenue (Million) Forecast, by Application 2020 & 2033
- Table 28: Italy Activated Carbon Market Revenue (Million) Forecast, by Application 2020 & 2033
- Table 29: Spain Activated Carbon Market Revenue (Million) Forecast, by Application 2020 & 2033
- Table 30: Rest of Europe Activated Carbon Market Revenue (Million) Forecast, by Application 2020 & 2033
- Table 31: Global Activated Carbon Market Revenue Million Forecast, by Product Type 2020 & 2033
- Table 32: Global Activated Carbon Market Revenue Million Forecast, by Application 2020 & 2033
- Table 33: Global Activated Carbon Market Revenue Million Forecast, by End-user Industry 2020 & 2033
- Table 34: Global Activated Carbon Market Revenue Million Forecast, by Country 2020 & 2033
- Table 35: Brazil Activated Carbon Market Revenue (Million) Forecast, by Application 2020 & 2033
- Table 36: Argentina Activated Carbon Market Revenue (Million) Forecast, by Application 2020 & 2033
- Table 37: Rest of South America Activated Carbon Market Revenue (Million) Forecast, by Application 2020 & 2033
- Table 38: Global Activated Carbon Market Revenue Million Forecast, by Product Type 2020 & 2033
- Table 39: Global Activated Carbon Market Revenue Million Forecast, by Application 2020 & 2033
- Table 40: Global Activated Carbon Market Revenue Million Forecast, by End-user Industry 2020 & 2033
- Table 41: Global Activated Carbon Market Revenue Million Forecast, by Country 2020 & 2033
- Table 42: Saudi Arabia Activated Carbon Market Revenue (Million) Forecast, by Application 2020 & 2033
- Table 43: South Africa Activated Carbon Market Revenue (Million) Forecast, by Application 2020 & 2033
- Table 44: Rest of Middle East and Africa Activated Carbon Market Revenue (Million) Forecast, by Application 2020 & 2033
Frequently Asked Questions
1. What is the projected Compound Annual Growth Rate (CAGR) of the Activated Carbon Market?
The projected CAGR is approximately 5.95%.
2. Which companies are prominent players in the Activated Carbon Market?
Key companies in the market include Donau Carbon GmbH, CARBOTECH, Carbon Activated Corporation, Advanced Emissions Solutions Inc, Kuraray Co Ltd, CPL Activated Carbons, Evoqua Water Technologies LLC, Cabot Corporation, Kureha Corporation, Ingevity, Silcarbon Aktivkohle GmbH, Haycarb (Pvt ) Ltd, Puragen Activated Carbons, Jacobi Carbons Group, Albemarle Corporation, Veolia (Veolia Water Technologies)*List Not Exhaustive.
3. What are the main segments of the Activated Carbon Market?
The market segments include Product Type, Application, End-user Industry.
4. Can you provide details about the market size?
The market size is estimated to be USD 4.32 Million as of 2022.
5. What are some drivers contributing to market growth?
Conformance to Stringent Environmental Regulations in Water Treatment Applications in the United States; Augmenting Prominence for Air Pollution Control (Especially Mercury Removal).
6. What are the notable trends driving market growth?
Water Treatment Industry to Dominate the Market.
7. Are there any restraints impacting market growth?
Narrower Markets Due to Increased Costs of Some Grades of Activated Carbon; Threat of Substitutes Like Silica Gel and Development of Better Alternatives.
8. Can you provide examples of recent developments in the market?
March 2022: Cabot Corporation sold off its activated carbon unit, Norit Activated Carbon, to One Equity Partners. Following the divestiture, Norit Activated Carbon became an independent company serving its customers with a broad portfolio of activated carbon solutions through its ten production facilities in seven countries.
9. What pricing options are available for accessing the report?
Pricing options include single-user, multi-user, and enterprise licenses priced at USD 4750, USD 5250, and USD 8750 respectively.
10. Is the market size provided in terms of value or volume?
The market size is provided in terms of value, measured in Million.
11. Are there any specific market keywords associated with the report?
Yes, the market keyword associated with the report is "Activated Carbon Market," which aids in identifying and referencing the specific market segment covered.
12. How do I determine which pricing option suits my needs best?
The pricing options vary based on user requirements and access needs. Individual users may opt for single-user licenses, while businesses requiring broader access may choose multi-user or enterprise licenses for cost-effective access to the report.
13. Are there any additional resources or data provided in the Activated Carbon Market report?
While the report offers comprehensive insights, it's advisable to review the specific contents or supplementary materials provided to ascertain if additional resources or data are available.
14. How can I stay updated on further developments or reports in the Activated Carbon Market?
To stay informed about further developments, trends, and reports in the Activated Carbon Market, consider subscribing to industry newsletters, following relevant companies and organizations, or regularly checking reputable industry news sources and publications.
Methodology
Step 1 - Identification of Relevant Samples Size from Population Database


Step 2 - Approaches for Defining Global Market Size (Value, Volume* & Price*)

Note*: In applicable scenarios
Step 3 - Data Sources
Primary Research
- Web Analytics
- Survey Reports
- Research Institute
- Latest Research Reports
- Opinion Leaders
Secondary Research
- Annual Reports
- White Paper
- Latest Press Release
- Industry Association
- Paid Database
- Investor Presentations

Step 4 - Data Triangulation
Involves using different sources of information in order to increase the validity of a study
These sources are likely to be stakeholders in a program - participants, other researchers, program staff, other community members, and so on.
Then we put all data in single framework & apply various statistical tools to find out the dynamic on the market.
During the analysis stage, feedback from the stakeholder groups would be compared to determine areas of agreement as well as areas of divergence