

Key Insights
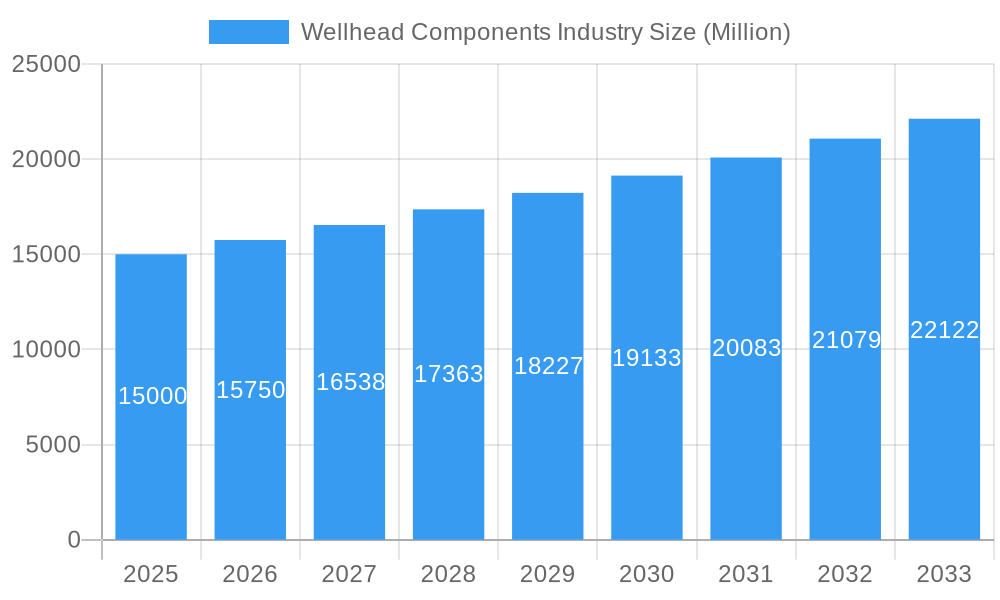
The global wellhead components market is poised for significant expansion, propelled by escalating oil and gas exploration and production worldwide. The market, valued at $6.69 billion in 2025, is projected to achieve a Compound Annual Growth Rate (CAGR) of 4.89% from 2025 to 2033. Key growth drivers include increasing energy demand, particularly in emerging economies, the development of new hydrocarbon reserves, and the wider adoption of enhanced oil recovery (EOR) techniques. The offshore sector is expected to be a primary growth engine due to the exploration of deeper and more complex reserves. Technological innovations in wellhead component design and materials further contribute to market growth. However, the market navigates challenges such as volatile oil and gas prices, stringent environmental regulations, and geopolitical uncertainties impacting investment decisions.
Wellhead Components Industry Market Size (In Billion)
The wellhead components market demonstrates resilience, with strong demand across casing heads, tubing heads, and related equipment. North America and the Asia-Pacific region are anticipated to lead market growth, fueled by upstream activities in the US shale basins and rising energy consumption in China and India. The competitive landscape features major global players and specialized regional manufacturers. These companies are prioritizing innovation, strategic alliances, and mergers and acquisitions to enhance market presence and capitalize on emerging opportunities. The market's future outlook is positive, influenced by global energy dynamics, ongoing upstream investments, and technological advancements.
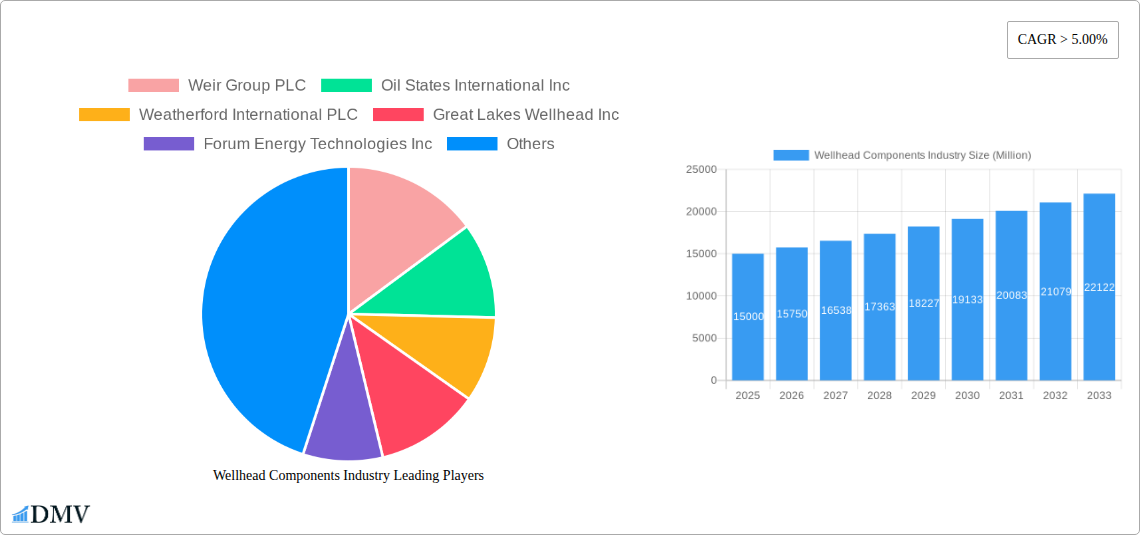
Wellhead Components Industry Company Market Share
Global Wellhead Components Market Analysis: Trends, Growth & Forecast (2025-2033)
This comprehensive report offers an in-depth analysis of the wellhead components market, detailing industry trends, technological advancements, and future growth projections. Covering the period from 2025 to 2033, with 2025 as the base year, this report serves as a crucial resource for stakeholders seeking to understand and leverage opportunities in this dynamic sector. The global market is forecast to reach significant valuation by 2033.
Wellhead Components Industry Market Composition & Trends
The Wellhead Components market, valued at xx Million in 2024, is characterized by a moderately concentrated landscape, with key players including Weir Group PLC, Oil States International Inc, Weatherford International PLC, Great Lakes Wellhead Inc, Forum Energy Technologies Inc, Baker Hughes Company, Cactus Wellhead LLC, Schlumberger Limited, NOV Inc, and TechnipFMC PLC. However, the presence of numerous smaller players contributes to a competitive environment. Market share distribution varies significantly across segments and regions, with larger players often dominating specific niches. Innovation is driven by the need for enhanced performance, reliability, and cost-effectiveness in harsh operating environments. Stringent safety regulations and environmental concerns significantly shape the industry landscape. Substitute products are limited, primarily focusing on alternative materials and designs within the wellhead component category itself. End users primarily include upstream oil and gas operators across onshore and offshore locations. Mergers and acquisitions (M&A) activity has been moderate in recent years, with deal values ranging from xx Million to xx Million depending on the target company and its technology portfolio.
- Market Concentration: Moderately concentrated, with key players holding significant shares in specific segments.
- Innovation Catalysts: Demand for improved performance, reliability, and cost reduction in extreme environments.
- Regulatory Landscape: Stringent safety and environmental regulations drive innovation and compliance costs.
- Substitute Products: Limited substitutes exist, mainly variations in materials and designs within the wellhead component category.
- End-User Profiles: Primarily upstream oil & gas operators (onshore and offshore).
- M&A Activity: Moderate activity observed, with deal values varying depending on the asset size and technological strength.
Wellhead Components Industry Industry Evolution
The Wellhead Components market has experienced fluctuating growth throughout the historical period (2019-2024), largely influenced by oil and gas price volatility and global energy demand. The industry's evolution is defined by continuous technological advancements, primarily focused on improving wellhead system efficiency, safety, and lifespan. This includes the adoption of advanced materials, improved designs for high-pressure/high-temperature applications, and increased automation in manufacturing and maintenance. Consumer demands are shifting towards more sustainable and environmentally friendly solutions, pushing manufacturers to develop components with reduced environmental impact. The forecast period (2025-2033) is projected to witness moderate growth, driven by increasing investments in oil and gas exploration and production, particularly in deepwater and unconventional resources. Growth rates are expected to average approximately xx% annually, with potential acceleration based on macroeconomic factors. Adoption of new technologies, like digital twins and advanced sensors for predictive maintenance, will continue to drive efficiency and reduce operational costs. The market is also witnessing a gradual shift toward standardization of components and systems to reduce complexity and improve compatibility.
Leading Regions, Countries, or Segments in Wellhead Components Industry
The North American market consistently holds a dominant position, driven by robust oil and gas activity and technological advancements. Other key regions include Europe, the Middle East, and Asia-Pacific, each with distinct growth trajectories. Within segments, Casing Heads and Tubing Heads represent substantial portions of the market due to their crucial roles in well integrity. Offshore applications typically command higher prices owing to increased complexity and safety requirements.
- Key Drivers:
- North America: Strong oil and gas production, technological innovation, significant investment in deepwater projects.
- Europe: Focus on mature fields optimization and aging infrastructure upgrades.
- Middle East: Large-scale oil and gas reserves, ongoing investment in infrastructure development.
- Asia-Pacific: Rapid economic growth, rising energy demand, growing offshore exploration and production.
- Dominance Factors:
- Casing Heads & Tubing Heads: Essential components for well integrity, ensuring safety and efficient operations.
- Offshore Applications: Higher price points due to complexities associated with deepwater operations.
Wellhead Components Industry Product Innovations
Recent innovations focus on enhancing wellhead system performance, reliability, and safety. This includes the development of lightweight, high-strength materials, improved sealing technologies for extreme conditions, and integrated smart sensors for real-time monitoring and predictive maintenance. Unique selling propositions include improved corrosion resistance, reduced lifecycle costs, and enhanced safety features. The incorporation of digital technologies, such as data analytics and remote monitoring capabilities, is significantly improving operational efficiency and reducing downtime. These advancements are not only improving production efficiency but are also contributing to better environmental management practices through reduced leaks and emissions.
Propelling Factors for Wellhead Components Industry Growth
The Wellhead Components industry's growth is driven by several key factors:
- Technological Advancements: Development of advanced materials, improved designs for high-pressure/high-temperature applications, and increased automation.
- Economic Growth: Rising global energy demand and increasing investments in oil and gas exploration and production projects, particularly in deepwater and unconventional resources.
- Regulatory Influences: Stringent safety regulations and environmental concerns drive demand for improved performance and sustainable solutions.
Obstacles in the Wellhead Components Industry Market
Several factors hinder market growth:
- Regulatory Challenges: Stringent safety and environmental standards necessitate substantial compliance costs and can slow down project approvals.
- Supply Chain Disruptions: Global events can impact the supply of raw materials and components, leading to production delays and cost increases.
- Competitive Pressures: Intense competition among numerous players necessitates continuous innovation and cost-optimization strategies to maintain market share.
Future Opportunities in Wellhead Components Industry
Future opportunities lie in:
- New Market Expansion: Focus on developing markets with untapped potential, particularly in regions with significant oil and gas reserves.
- Technological Advancements: Development of smart wellheads with integrated sensors and predictive maintenance capabilities.
- Sustainable Solutions: Production of eco-friendly components with reduced environmental impact, adhering to stringent environmental regulations.
Major Players in the Wellhead Components Industry Ecosystem
- Weir Group PLC
- Oil States International Inc
- Weatherford International PLC
- Great Lakes Wellhead Inc
- Forum Energy Technologies Inc
- Baker Hughes Company
- Cactus Wellhead LLC
- Schlumberger Limited
- NOV Inc
- TechnipFMC PLC
Key Developments in Wellhead Components Industry Industry
- February 2021: TechnipFMC secures a significant contract from PETRONAS for the Limbayong deepwater development project in Malaysia.
- March 2021: Dril-Quip wins a USD 80 Million contract from BP for subsea wellhead systems in the Gulf of Mexico.
- December 2021: Plexus Holdings receives a purchase order for its 'POS-GRIP' wellhead system.
Strategic Wellhead Components Industry Market Forecast
The Wellhead Components market is poised for continued growth, driven by ongoing investments in oil and gas exploration and production, technological advancements in wellhead system designs and materials, and the increasing demand for sustainable solutions. This upward trajectory is expected to remain robust throughout the forecast period, presenting significant opportunities for industry players to innovate and capture market share. The integration of digital technologies and the adoption of advanced manufacturing processes will further contribute to market expansion.
Wellhead Components Industry Segmentation
-
1. Wellhead Component
- 1.1. Casing Heads
- 1.2. Casing Spools
- 1.3. Tubing Heads
- 1.4. Casing Hangers
- 1.5. Secondary Seals
- 1.6. Tubing Hangers
- 1.7. Other Wellhead Components
-
2. Location
- 2.1. Onshore
- 2.2. Offshore
Wellhead Components Industry Segmentation By Geography
- 1. North America
- 2. Europe
- 3. Asia Pacific
- 4. South America
- 5. Middle East and Africa
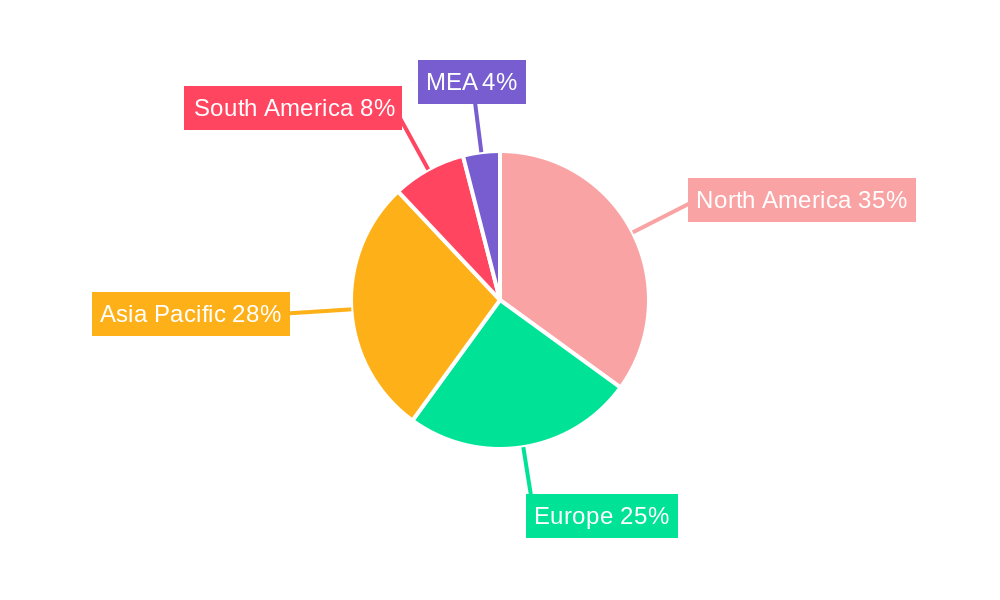
Wellhead Components Industry Regional Market Share
Geographic Coverage of Wellhead Components Industry
Wellhead Components Industry REPORT HIGHLIGHTS
| Aspects | Details |
|---|---|
| Study Period | 2020-2034 |
| Base Year | 2025 |
| Estimated Year | 2026 |
| Forecast Period | 2026-2034 |
| Historical Period | 2020-2025 |
| Growth Rate | CAGR of 4.89% from 2020-2034 |
| Segmentation |
|
Table of Contents
- 1. Introduction
- 1.1. Research Scope
- 1.2. Market Segmentation
- 1.3. Research Objective
- 1.4. Definitions and Assumptions
- 2. Executive Summary
- 2.1. Market Snapshot
- 3. Market Dynamics
- 3.1. Market Drivers
- 3.2. Market Restrains
- 3.3. Market Trends
- 3.4. Market Opportunities
- 4. Market Factor Analysis
- 4.1. Porters Five Forces
- 4.1.1. Bargaining Power of Suppliers
- 4.1.2. Bargaining Power of Buyers
- 4.1.3. Threat of New Entrants
- 4.1.4. Threat of Substitutes
- 4.1.5. Competitive Rivalry
- 4.2. PESTEL analysis
- 4.3. BCG Analysis
- 4.3.1. Stars (High Growth, High Market Share)
- 4.3.2. Cash Cows (Low Growth, High Market Share)
- 4.3.3. Question Mark (High Growth, Low Market Share)
- 4.3.4. Dogs (Low Growth, Low Market Share)
- 4.4. Ansoff Matrix Analysis
- 4.5. Supply Chain Analysis
- 4.6. Regulatory Landscape
- 4.7. Current Market Potential and Opportunity Assessment (TAM–SAM–SOM Framework)
- 4.8. DMV Analyst Note
- 4.1. Porters Five Forces
- 5. Market Analysis, Insights and Forecast 2021-2033
- 5.1. Market Analysis, Insights and Forecast - by Wellhead Component
- 5.1.1. Casing Heads
- 5.1.2. Casing Spools
- 5.1.3. Tubing Heads
- 5.1.4. Casing Hangers
- 5.1.5. Secondary Seals
- 5.1.6. Tubing Hangers
- 5.1.7. Other Wellhead Components
- 5.2. Market Analysis, Insights and Forecast - by Location
- 5.2.1. Onshore
- 5.2.2. Offshore
- 5.3. Market Analysis, Insights and Forecast - by Region
- 5.3.1. North America
- 5.3.2. Europe
- 5.3.3. Asia Pacific
- 5.3.4. South America
- 5.3.5. Middle East and Africa
- 5.1. Market Analysis, Insights and Forecast - by Wellhead Component
- 6. Global Wellhead Components Industry Analysis, Insights and Forecast, 2021-2033
- 6.1. Market Analysis, Insights and Forecast - by Wellhead Component
- 6.1.1. Casing Heads
- 6.1.2. Casing Spools
- 6.1.3. Tubing Heads
- 6.1.4. Casing Hangers
- 6.1.5. Secondary Seals
- 6.1.6. Tubing Hangers
- 6.1.7. Other Wellhead Components
- 6.2. Market Analysis, Insights and Forecast - by Location
- 6.2.1. Onshore
- 6.2.2. Offshore
- 6.1. Market Analysis, Insights and Forecast - by Wellhead Component
- 7. North America Wellhead Components Industry Analysis, Insights and Forecast, 2020-2032
- 7.1. Market Analysis, Insights and Forecast - by Wellhead Component
- 7.1.1. Casing Heads
- 7.1.2. Casing Spools
- 7.1.3. Tubing Heads
- 7.1.4. Casing Hangers
- 7.1.5. Secondary Seals
- 7.1.6. Tubing Hangers
- 7.1.7. Other Wellhead Components
- 7.2. Market Analysis, Insights and Forecast - by Location
- 7.2.1. Onshore
- 7.2.2. Offshore
- 7.1. Market Analysis, Insights and Forecast - by Wellhead Component
- 8. Europe Wellhead Components Industry Analysis, Insights and Forecast, 2020-2032
- 8.1. Market Analysis, Insights and Forecast - by Wellhead Component
- 8.1.1. Casing Heads
- 8.1.2. Casing Spools
- 8.1.3. Tubing Heads
- 8.1.4. Casing Hangers
- 8.1.5. Secondary Seals
- 8.1.6. Tubing Hangers
- 8.1.7. Other Wellhead Components
- 8.2. Market Analysis, Insights and Forecast - by Location
- 8.2.1. Onshore
- 8.2.2. Offshore
- 8.1. Market Analysis, Insights and Forecast - by Wellhead Component
- 9. Asia Pacific Wellhead Components Industry Analysis, Insights and Forecast, 2020-2032
- 9.1. Market Analysis, Insights and Forecast - by Wellhead Component
- 9.1.1. Casing Heads
- 9.1.2. Casing Spools
- 9.1.3. Tubing Heads
- 9.1.4. Casing Hangers
- 9.1.5. Secondary Seals
- 9.1.6. Tubing Hangers
- 9.1.7. Other Wellhead Components
- 9.2. Market Analysis, Insights and Forecast - by Location
- 9.2.1. Onshore
- 9.2.2. Offshore
- 9.1. Market Analysis, Insights and Forecast - by Wellhead Component
- 10. South America Wellhead Components Industry Analysis, Insights and Forecast, 2020-2032
- 10.1. Market Analysis, Insights and Forecast - by Wellhead Component
- 10.1.1. Casing Heads
- 10.1.2. Casing Spools
- 10.1.3. Tubing Heads
- 10.1.4. Casing Hangers
- 10.1.5. Secondary Seals
- 10.1.6. Tubing Hangers
- 10.1.7. Other Wellhead Components
- 10.2. Market Analysis, Insights and Forecast - by Location
- 10.2.1. Onshore
- 10.2.2. Offshore
- 10.1. Market Analysis, Insights and Forecast - by Wellhead Component
- 11. Middle East and Africa Wellhead Components Industry Analysis, Insights and Forecast, 2020-2032
- 11.1. Market Analysis, Insights and Forecast - by Wellhead Component
- 11.1.1. Casing Heads
- 11.1.2. Casing Spools
- 11.1.3. Tubing Heads
- 11.1.4. Casing Hangers
- 11.1.5. Secondary Seals
- 11.1.6. Tubing Hangers
- 11.1.7. Other Wellhead Components
- 11.2. Market Analysis, Insights and Forecast - by Location
- 11.2.1. Onshore
- 11.2.2. Offshore
- 11.1. Market Analysis, Insights and Forecast - by Wellhead Component
- 12. Competitive Analysis
- 12.1. Company Profiles
- 12.1.1 Weir Group PLC
- 12.1.1.1. Company Overview
- 12.1.1.2. Products
- 12.1.1.3. Company Financials
- 12.1.1.4. SWOT Analysis
- 12.1.2 Oil States International Inc
- 12.1.2.1. Company Overview
- 12.1.2.2. Products
- 12.1.2.3. Company Financials
- 12.1.2.4. SWOT Analysis
- 12.1.3 Weatherford International PLC
- 12.1.3.1. Company Overview
- 12.1.3.2. Products
- 12.1.3.3. Company Financials
- 12.1.3.4. SWOT Analysis
- 12.1.4 Great Lakes Wellhead Inc
- 12.1.4.1. Company Overview
- 12.1.4.2. Products
- 12.1.4.3. Company Financials
- 12.1.4.4. SWOT Analysis
- 12.1.5 Forum Energy Technologies Inc
- 12.1.5.1. Company Overview
- 12.1.5.2. Products
- 12.1.5.3. Company Financials
- 12.1.5.4. SWOT Analysis
- 12.1.6 Baker Hughes Company
- 12.1.6.1. Company Overview
- 12.1.6.2. Products
- 12.1.6.3. Company Financials
- 12.1.6.4. SWOT Analysis
- 12.1.7 Cactus Wellhead LLC*List Not Exhaustive
- 12.1.7.1. Company Overview
- 12.1.7.2. Products
- 12.1.7.3. Company Financials
- 12.1.7.4. SWOT Analysis
- 12.1.8 Schlumberger Limited
- 12.1.8.1. Company Overview
- 12.1.8.2. Products
- 12.1.8.3. Company Financials
- 12.1.8.4. SWOT Analysis
- 12.1.9 NOV Inc
- 12.1.9.1. Company Overview
- 12.1.9.2. Products
- 12.1.9.3. Company Financials
- 12.1.9.4. SWOT Analysis
- 12.1.10 TechnipFMC PLC
- 12.1.10.1. Company Overview
- 12.1.10.2. Products
- 12.1.10.3. Company Financials
- 12.1.10.4. SWOT Analysis
- 12.1.1 Weir Group PLC
- 12.2. Market Entropy
- 12.2.1 Company's Key Areas Served
- 12.2.2 Recent Developments
- 12.3. Company Market Share Analysis 2025
- 12.3.1 Top 5 Companies Market Share Analysis
- 12.3.2 Top 3 Companies Market Share Analysis
- 12.4. List of Potential Customers
- 13. Research Methodology
List of Figures
- Figure 1: Global Wellhead Components Industry Revenue Breakdown (billion, %) by Region 2025 & 2033
- Figure 2: North America Wellhead Components Industry Revenue (billion), by Wellhead Component 2025 & 2033
- Figure 3: North America Wellhead Components Industry Revenue Share (%), by Wellhead Component 2025 & 2033
- Figure 4: North America Wellhead Components Industry Revenue (billion), by Location 2025 & 2033
- Figure 5: North America Wellhead Components Industry Revenue Share (%), by Location 2025 & 2033
- Figure 6: North America Wellhead Components Industry Revenue (billion), by Country 2025 & 2033
- Figure 7: North America Wellhead Components Industry Revenue Share (%), by Country 2025 & 2033
- Figure 8: Europe Wellhead Components Industry Revenue (billion), by Wellhead Component 2025 & 2033
- Figure 9: Europe Wellhead Components Industry Revenue Share (%), by Wellhead Component 2025 & 2033
- Figure 10: Europe Wellhead Components Industry Revenue (billion), by Location 2025 & 2033
- Figure 11: Europe Wellhead Components Industry Revenue Share (%), by Location 2025 & 2033
- Figure 12: Europe Wellhead Components Industry Revenue (billion), by Country 2025 & 2033
- Figure 13: Europe Wellhead Components Industry Revenue Share (%), by Country 2025 & 2033
- Figure 14: Asia Pacific Wellhead Components Industry Revenue (billion), by Wellhead Component 2025 & 2033
- Figure 15: Asia Pacific Wellhead Components Industry Revenue Share (%), by Wellhead Component 2025 & 2033
- Figure 16: Asia Pacific Wellhead Components Industry Revenue (billion), by Location 2025 & 2033
- Figure 17: Asia Pacific Wellhead Components Industry Revenue Share (%), by Location 2025 & 2033
- Figure 18: Asia Pacific Wellhead Components Industry Revenue (billion), by Country 2025 & 2033
- Figure 19: Asia Pacific Wellhead Components Industry Revenue Share (%), by Country 2025 & 2033
- Figure 20: South America Wellhead Components Industry Revenue (billion), by Wellhead Component 2025 & 2033
- Figure 21: South America Wellhead Components Industry Revenue Share (%), by Wellhead Component 2025 & 2033
- Figure 22: South America Wellhead Components Industry Revenue (billion), by Location 2025 & 2033
- Figure 23: South America Wellhead Components Industry Revenue Share (%), by Location 2025 & 2033
- Figure 24: South America Wellhead Components Industry Revenue (billion), by Country 2025 & 2033
- Figure 25: South America Wellhead Components Industry Revenue Share (%), by Country 2025 & 2033
- Figure 26: Middle East and Africa Wellhead Components Industry Revenue (billion), by Wellhead Component 2025 & 2033
- Figure 27: Middle East and Africa Wellhead Components Industry Revenue Share (%), by Wellhead Component 2025 & 2033
- Figure 28: Middle East and Africa Wellhead Components Industry Revenue (billion), by Location 2025 & 2033
- Figure 29: Middle East and Africa Wellhead Components Industry Revenue Share (%), by Location 2025 & 2033
- Figure 30: Middle East and Africa Wellhead Components Industry Revenue (billion), by Country 2025 & 2033
- Figure 31: Middle East and Africa Wellhead Components Industry Revenue Share (%), by Country 2025 & 2033
List of Tables
- Table 1: Global Wellhead Components Industry Revenue billion Forecast, by Wellhead Component 2020 & 2033
- Table 2: Global Wellhead Components Industry Revenue billion Forecast, by Location 2020 & 2033
- Table 3: Global Wellhead Components Industry Revenue billion Forecast, by Region 2020 & 2033
- Table 4: Global Wellhead Components Industry Revenue billion Forecast, by Wellhead Component 2020 & 2033
- Table 5: Global Wellhead Components Industry Revenue billion Forecast, by Location 2020 & 2033
- Table 6: Global Wellhead Components Industry Revenue billion Forecast, by Country 2020 & 2033
- Table 7: Global Wellhead Components Industry Revenue billion Forecast, by Wellhead Component 2020 & 2033
- Table 8: Global Wellhead Components Industry Revenue billion Forecast, by Location 2020 & 2033
- Table 9: Global Wellhead Components Industry Revenue billion Forecast, by Country 2020 & 2033
- Table 10: Global Wellhead Components Industry Revenue billion Forecast, by Wellhead Component 2020 & 2033
- Table 11: Global Wellhead Components Industry Revenue billion Forecast, by Location 2020 & 2033
- Table 12: Global Wellhead Components Industry Revenue billion Forecast, by Country 2020 & 2033
- Table 13: Global Wellhead Components Industry Revenue billion Forecast, by Wellhead Component 2020 & 2033
- Table 14: Global Wellhead Components Industry Revenue billion Forecast, by Location 2020 & 2033
- Table 15: Global Wellhead Components Industry Revenue billion Forecast, by Country 2020 & 2033
- Table 16: Global Wellhead Components Industry Revenue billion Forecast, by Wellhead Component 2020 & 2033
- Table 17: Global Wellhead Components Industry Revenue billion Forecast, by Location 2020 & 2033
- Table 18: Global Wellhead Components Industry Revenue billion Forecast, by Country 2020 & 2033
Frequently Asked Questions
1. What is the projected Compound Annual Growth Rate (CAGR) of the Wellhead Components Industry?
The projected CAGR is approximately 4.89%.
2. Which companies are prominent players in the Wellhead Components Industry?
Key companies in the market include Weir Group PLC, Oil States International Inc, Weatherford International PLC, Great Lakes Wellhead Inc, Forum Energy Technologies Inc, Baker Hughes Company, Cactus Wellhead LLC*List Not Exhaustive, Schlumberger Limited, NOV Inc, TechnipFMC PLC.
3. What are the main segments of the Wellhead Components Industry?
The market segments include Wellhead Component, Location.
4. Can you provide details about the market size?
The market size is estimated to be USD 6.69 billion as of 2022.
5. What are some drivers contributing to market growth?
4.; The Rise in Oil and Gas Drilling Activities4.; Increased Shale Gas Exploration.
6. What are the notable trends driving market growth?
Onshore Segment to Dominate the Market.
7. Are there any restraints impacting market growth?
4.; Increasing Share of Renewable Energy.
8. Can you provide examples of recent developments in the market?
In February 2021, TechnipFMC's subsidiary, FMC Wellhead Equipment Sdn Bhd was awarded a substantial contract by PETRONAS Carigali Sdn Bhd for Limbayong deepwater development project in offshore Malaysia. This contract covers the development of 10 deepwater wells and their tieback to the Limbayong Floating Production Storage and Offloading (FPSO) unit in Malaysia.
9. What pricing options are available for accessing the report?
Pricing options include single-user, multi-user, and enterprise licenses priced at USD 4750, USD 5250, and USD 8750 respectively.
10. Is the market size provided in terms of value or volume?
The market size is provided in terms of value, measured in billion.
11. Are there any specific market keywords associated with the report?
Yes, the market keyword associated with the report is "Wellhead Components Industry," which aids in identifying and referencing the specific market segment covered.
12. How do I determine which pricing option suits my needs best?
The pricing options vary based on user requirements and access needs. Individual users may opt for single-user licenses, while businesses requiring broader access may choose multi-user or enterprise licenses for cost-effective access to the report.
13. Are there any additional resources or data provided in the Wellhead Components Industry report?
While the report offers comprehensive insights, it's advisable to review the specific contents or supplementary materials provided to ascertain if additional resources or data are available.
14. How can I stay updated on further developments or reports in the Wellhead Components Industry?
To stay informed about further developments, trends, and reports in the Wellhead Components Industry, consider subscribing to industry newsletters, following relevant companies and organizations, or regularly checking reputable industry news sources and publications.
Methodology
Step 1 - Identification of Relevant Samples Size from Population Database


Step 2 - Approaches for Defining Global Market Size (Value, Volume* & Price*)

Note*: In applicable scenarios
Step 3 - Data Sources
Primary Research
- Web Analytics
- Survey Reports
- Research Institute
- Latest Research Reports
- Opinion Leaders
Secondary Research
- Annual Reports
- White Paper
- Latest Press Release
- Industry Association
- Paid Database
- Investor Presentations

Step 4 - Data Triangulation
Involves using different sources of information in order to increase the validity of a study
These sources are likely to be stakeholders in a program - participants, other researchers, program staff, other community members, and so on.
Then we put all data in single framework & apply various statistical tools to find out the dynamic on the market.
During the analysis stage, feedback from the stakeholder groups would be compared to determine areas of agreement as well as areas of divergence