

Key Insights
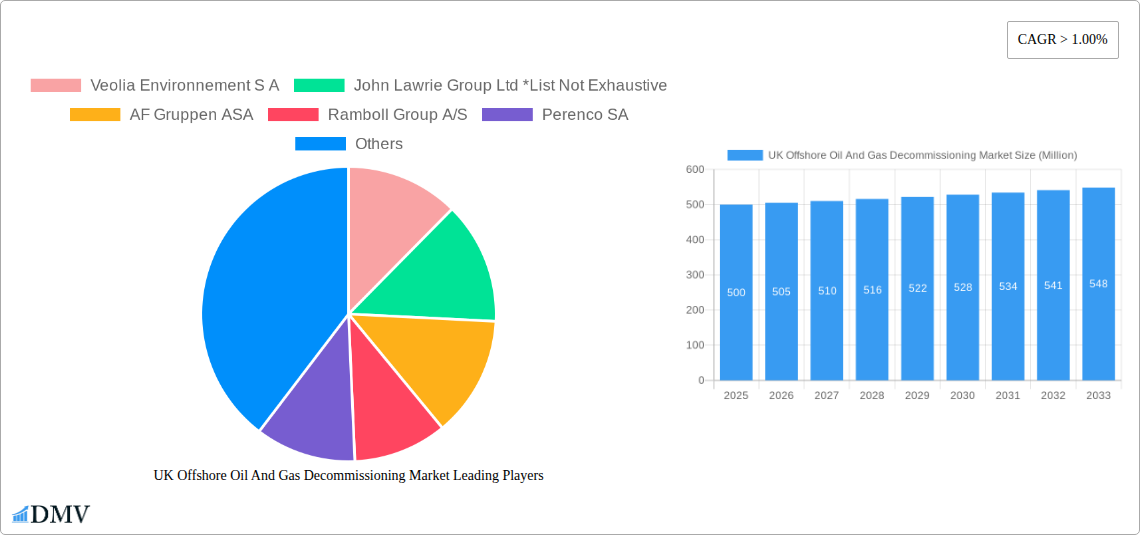
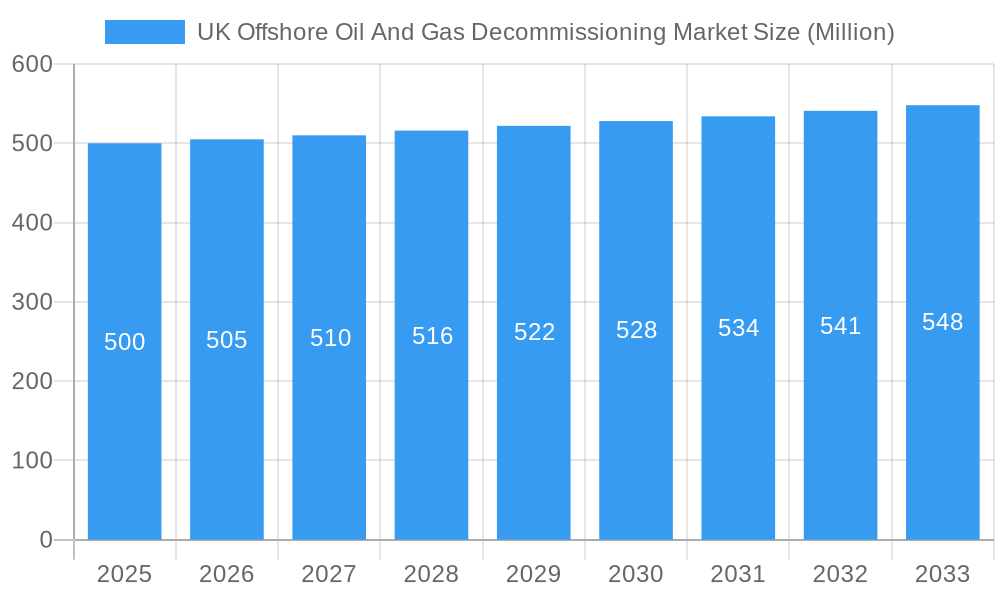
The UK offshore oil and gas decommissioning market is projected for significant expansion, propelled by the natural depletion of established fields and escalating regulatory mandates for responsible asset retirement. This dynamic market, covering well plugging and abandonment (P&A), pipeline decommissioning, and associated services, is fundamentally driven by the oil and gas sector's commitment to managing end-of-life infrastructure. Based on a Compound Annual Growth Rate (CAGR) of 6.5%, the market size was estimated at £11.1 billion in the base year of 2025. This valuation is anticipated to experience consistent growth through the forecast period of 2025-2033. Key growth accelerators include stringent environmental regulations designed to mitigate ecological impact and technological innovations that enhance decommissioning efficiency and cost-effectiveness. Prominent industry participants, including Veolia Environnement S.A. and John Lawrie Group Ltd., are actively engaged, offering specialized expertise and pioneering new technologies.
UK Offshore Oil And Gas Decommissioning Market Market Size (In Billion)
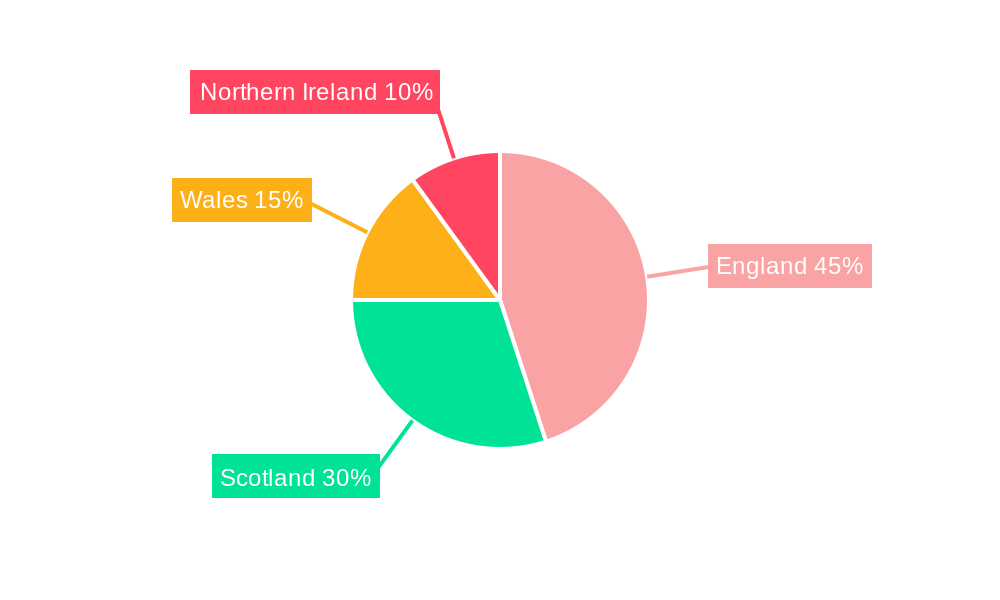
Conversely, market growth is tempered by substantial capital expenditure requirements for decommissioning projects, volatility in oil and gas prices influencing investment strategies, and the inherent logistical complexities of offshore operations. A significant segment of the market is dedicated to P&A services, underscoring the critical need for well integrity and environmental hazard prevention. The regional concentration for these activities is primarily within England, Wales, Scotland, and Northern Ireland. The ongoing transition towards renewable energy sources may indirectly present a competitive constraint by diverting resources. However, the substantial inventory of aging offshore assets in the UK's North Sea ensures a robust market outlook for the coming decade. The overall market trajectory points towards sustained, albeit moderate, growth, driven by the non-negotiable imperative for safe and environmentally sound decommissioning practices.
UK Offshore Oil And Gas Decommissioning Market Company Market Share
UK Offshore Oil & Gas Decommissioning Market: A Comprehensive Report (2019-2033)
This insightful report provides a comprehensive analysis of the UK offshore oil and gas decommissioning market, offering a detailed forecast from 2025 to 2033. With a focus on market size, key players, technological advancements, and future opportunities, this report is essential for stakeholders seeking to understand and capitalize on this burgeoning sector. The study period covers 2019-2033, with 2025 as the base and estimated year. The historical period analyzed is 2019-2024. The market is projected to reach xx Million by 2033.
UK Offshore Oil And Gas Decommissioning Market Market Composition & Trends
This section delves into the intricate structure of the UK offshore oil and gas decommissioning market, examining its key components and influential trends. We analyze market concentration, revealing the market share distribution amongst leading players such as Veolia Environnement S A, John Lawrie Group Ltd, AF Gruppen ASA, Ramboll Group A/S, Perenco SA, and Derrick Services (UK) Ltd (list not exhaustive). The report explores the role of innovation catalysts, including technological advancements and regulatory changes, shaping the competitive landscape. It also examines the influence of substitute products, end-user profiles (Oil Industry and Gas Industry), and mergers and acquisitions (M&A) activities, providing insights into deal values and their impact on market dynamics. The analysis encompasses a detailed overview of the regulatory landscape, impacting investment decisions and operational strategies. We examine the frequency and value of M&A deals within the sector (estimated at xx Million in total deal value during the historical period). Finally, the report offers a granular analysis of the market concentration, detailing the market share held by the top five players (xx% combined market share in 2024).
- Market Concentration: High, with a few major players dominating.
- Innovation Catalysts: Technological advancements in robotics, AI, and subsea intervention.
- Regulatory Landscape: Stringent environmental regulations driving innovation and investment.
- Substitute Products: Limited viable substitutes for established decommissioning technologies.
- End-User Profiles: Predominantly large oil and gas companies with extensive North Sea assets.
- M&A Activities: Consolidation expected to continue, driven by scale and expertise benefits.
UK Offshore Oil And Gas Decommissioning Market Industry Evolution
This section charts the evolution of the UK offshore oil and gas decommissioning market, examining its growth trajectory from 2019 to 2033. We analyze the historical growth rates (xx% CAGR 2019-2024) and project future growth based on industry trends and anticipated regulatory changes (xx% CAGR 2025-2033). The report will highlight significant technological advancements that have improved efficiency and reduced environmental impact, while also analyzing shifts in consumer demand for more sustainable decommissioning practices. Further, we discuss the rising adoption of advanced technologies, focusing on metrics like the percentage of projects utilizing robotics (xx% in 2024, projected to rise to xx% by 2033). The analysis will also incorporate the increasing focus on environmental, social, and governance (ESG) factors which are influencing investment decisions and market growth. The impact of government policies and incentives designed to support the decommissioning industry will also be analyzed in detail.
Leading Regions, Countries, or Segments in UK Offshore Oil And Gas Decommissioning Market
The UK offshore oil and gas decommissioning market is geographically concentrated, with the North Sea region being the dominant area. The report highlights the leading segments: Plugging and Abandonment (P&A) and Pipeline Decommissioning, and identifies the Oil and Gas Industries as the primary end-users.
Key Drivers for North Sea Dominance:
- High concentration of aging oil and gas infrastructure.
- Stringent UK government regulations promoting decommissioning.
- Significant investment in decommissioning projects.
- Availability of specialized decommissioning expertise and infrastructure.
Plugging and Abandonment (P&A): This segment is the largest, driven by the large number of aging wells requiring decommissioning.
Pipeline Decommissioning: This segment is also experiencing significant growth, due to the complexities involved in removing ageing pipelines and related infrastructure.
End-User Focus: The majority of projects are commissioned by large international oil and gas companies operating in the North Sea.
UK Offshore Oil And Gas Decommissioning Market Product Innovations
Recent years have witnessed the emergence of innovative decommissioning technologies, emphasizing efficiency, safety, and environmental responsibility. These innovations include advanced robotic systems for subsea intervention, improved waste management techniques minimizing environmental impact, and data analytics tools to optimize decommissioning strategies. These advancements offer unique selling propositions including reduced operational costs, faster project completion times, and enhanced environmental performance, further driving market growth.
Propelling Factors for UK Offshore Oil And Gas Decommissioning Market Growth
Several factors are driving the growth of the UK offshore oil and gas decommissioning market. Firstly, the large number of aging and depleted oil and gas fields in the North Sea necessitates significant decommissioning activity. Secondly, stringent government regulations and environmental concerns are pushing companies to expedite decommissioning processes and adopt sustainable practices. Thirdly, technological advancements leading to improved efficiency and cost-effectiveness also fuel this expansion. Finally, substantial government investment and support for the industry provide a further boost.
Obstacles in the UK Offshore Oil And Gas Decommissioning Market Market
The market faces challenges including high decommissioning costs, potential supply chain disruptions impacting project timelines and budgets (estimated xx% increase in costs during periods of disruption), and intense competition among decommissioning service providers. Furthermore, navigating complex regulatory frameworks and securing necessary permits can also delay projects. The uncertainty around future decommissioning regulations also creates challenges in long-term planning for businesses within the market.
Future Opportunities in UK Offshore Oil And Gas Decommissioning Market
Future opportunities lie in the development and deployment of advanced technologies (e.g., AI-powered robotics) for safer, faster, and more efficient decommissioning. Expansion into new market segments (e.g., decommissioning of renewable energy infrastructure) also represents considerable potential. Further opportunities exist in optimizing waste management strategies, reducing environmental impact, and promoting circular economy principles within the decommissioning sector.
Major Players in the UK Offshore Oil And Gas Decommissioning Market Ecosystem
- Veolia Environnement S A
- John Lawrie Group Ltd
- AF Gruppen ASA
- Ramboll Group A/S
- Perenco SA
- Derrick Services (UK) Ltd
Key Developments in UK Offshore Oil And Gas Decommissioning Market Industry
- November 2022: Offshore Energies UK (OEUK) reported over 2,000 abandoned oil and gas wells in the North Sea, signaling a significant increase in future decommissioning activity valued at EUR 20 billion.
- September 2022: The UK's Nuclear Decommissioning Authority (NDA) and National Decommissioning Centre (NDC) signed a three-year collaborative research agreement, fostering innovation and knowledge sharing between the nuclear and oil & gas decommissioning sectors.
Strategic UK Offshore Oil And Gas Decommissioning Market Market Forecast
The UK offshore oil and gas decommissioning market is poised for substantial growth driven by the factors discussed above. The increasing number of aging installations, stringent environmental regulations, and advancements in technology will create significant opportunities for companies operating in this sector. The market's future trajectory suggests strong growth potential, with substantial investment anticipated to ensure efficient and sustainable decommissioning operations. The market is expected to experience a robust growth trajectory throughout the forecast period, driven by continued technological innovation and sustained regulatory support.
UK Offshore Oil And Gas Decommissioning Market Segmentation
- 1. Shallow Water
- 2. Deepwater and Ultra-Deep Water
UK Offshore Oil And Gas Decommissioning Market Segmentation By Geography
-
1. North America
- 1.1. United States
- 1.2. Canada
- 1.3. Mexico
-
2. South America
- 2.1. Brazil
- 2.2. Argentina
- 2.3. Rest of South America
-
3. Europe
- 3.1. United Kingdom
- 3.2. Germany
- 3.3. France
- 3.4. Italy
- 3.5. Spain
- 3.6. Russia
- 3.7. Benelux
- 3.8. Nordics
- 3.9. Rest of Europe
-
4. Middle East & Africa
- 4.1. Turkey
- 4.2. Israel
- 4.3. GCC
- 4.4. North Africa
- 4.5. South Africa
- 4.6. Rest of Middle East & Africa
-
5. Asia Pacific
- 5.1. China
- 5.2. India
- 5.3. Japan
- 5.4. South Korea
- 5.5. ASEAN
- 5.6. Oceania
- 5.7. Rest of Asia Pacific
UK Offshore Oil And Gas Decommissioning Market Regional Market Share
Geographic Coverage of UK Offshore Oil And Gas Decommissioning Market
UK Offshore Oil And Gas Decommissioning Market REPORT HIGHLIGHTS
| Aspects | Details |
|---|---|
| Study Period | 2020-2034 |
| Base Year | 2025 |
| Estimated Year | 2026 |
| Forecast Period | 2026-2034 |
| Historical Period | 2020-2025 |
| Growth Rate | CAGR of 6.5% from 2020-2034 |
| Segmentation |
|
Table of Contents
- 1. Introduction
- 1.1. Research Scope
- 1.2. Market Segmentation
- 1.3. Research Objective
- 1.4. Definitions and Assumptions
- 2. Executive Summary
- 2.1. Market Snapshot
- 3. Market Dynamics
- 3.1. Market Drivers
- 3.2. Market Restrains
- 3.3. Market Trends
- 3.4. Market Opportunities
- 4. Market Factor Analysis
- 4.1. Porters Five Forces
- 4.1.1. Bargaining Power of Suppliers
- 4.1.2. Bargaining Power of Buyers
- 4.1.3. Threat of New Entrants
- 4.1.4. Threat of Substitutes
- 4.1.5. Competitive Rivalry
- 4.2. PESTEL analysis
- 4.3. BCG Analysis
- 4.3.1. Stars (High Growth, High Market Share)
- 4.3.2. Cash Cows (Low Growth, High Market Share)
- 4.3.3. Question Mark (High Growth, Low Market Share)
- 4.3.4. Dogs (Low Growth, Low Market Share)
- 4.4. Ansoff Matrix Analysis
- 4.5. Supply Chain Analysis
- 4.6. Regulatory Landscape
- 4.7. Current Market Potential and Opportunity Assessment (TAM–SAM–SOM Framework)
- 4.8. DMV Analyst Note
- 4.1. Porters Five Forces
- 5. Market Analysis, Insights and Forecast 2021-2033
- 5.1. Market Analysis, Insights and Forecast - by Shallow Water
- 5.2. Market Analysis, Insights and Forecast - by Deepwater and Ultra-Deep Water
- 5.3. Market Analysis, Insights and Forecast - by Region
- 5.3.1. North America
- 5.3.2. South America
- 5.3.3. Europe
- 5.3.4. Middle East & Africa
- 5.3.5. Asia Pacific
- 6. Global UK Offshore Oil And Gas Decommissioning Market Analysis, Insights and Forecast, 2021-2033
- 6.1. Market Analysis, Insights and Forecast - by Shallow Water
- 6.2. Market Analysis, Insights and Forecast - by Deepwater and Ultra-Deep Water
- 7. North America UK Offshore Oil And Gas Decommissioning Market Analysis, Insights and Forecast, 2020-2032
- 7.1. Market Analysis, Insights and Forecast - by Shallow Water
- 7.2. Market Analysis, Insights and Forecast - by Deepwater and Ultra-Deep Water
- 8. South America UK Offshore Oil And Gas Decommissioning Market Analysis, Insights and Forecast, 2020-2032
- 8.1. Market Analysis, Insights and Forecast - by Shallow Water
- 8.2. Market Analysis, Insights and Forecast - by Deepwater and Ultra-Deep Water
- 9. Europe UK Offshore Oil And Gas Decommissioning Market Analysis, Insights and Forecast, 2020-2032
- 9.1. Market Analysis, Insights and Forecast - by Shallow Water
- 9.2. Market Analysis, Insights and Forecast - by Deepwater and Ultra-Deep Water
- 10. Middle East & Africa UK Offshore Oil And Gas Decommissioning Market Analysis, Insights and Forecast, 2020-2032
- 10.1. Market Analysis, Insights and Forecast - by Shallow Water
- 10.2. Market Analysis, Insights and Forecast - by Deepwater and Ultra-Deep Water
- 11. Asia Pacific UK Offshore Oil And Gas Decommissioning Market Analysis, Insights and Forecast, 2020-2032
- 11.1. Market Analysis, Insights and Forecast - by Shallow Water
- 11.2. Market Analysis, Insights and Forecast - by Deepwater and Ultra-Deep Water
- 12. Competitive Analysis
- 12.1. Company Profiles
- 12.1.1 Veolia Environnement S A
- 12.1.1.1. Company Overview
- 12.1.1.2. Products
- 12.1.1.3. Company Financials
- 12.1.1.4. SWOT Analysis
- 12.1.2 John Lawrie Group Ltd *List Not Exhaustive
- 12.1.2.1. Company Overview
- 12.1.2.2. Products
- 12.1.2.3. Company Financials
- 12.1.2.4. SWOT Analysis
- 12.1.3 AF Gruppen ASA
- 12.1.3.1. Company Overview
- 12.1.3.2. Products
- 12.1.3.3. Company Financials
- 12.1.3.4. SWOT Analysis
- 12.1.4 Ramboll Group A/S
- 12.1.4.1. Company Overview
- 12.1.4.2. Products
- 12.1.4.3. Company Financials
- 12.1.4.4. SWOT Analysis
- 12.1.5 Perenco SA
- 12.1.5.1. Company Overview
- 12.1.5.2. Products
- 12.1.5.3. Company Financials
- 12.1.5.4. SWOT Analysis
- 12.1.6 Derrick Services (UK) Ltd
- 12.1.6.1. Company Overview
- 12.1.6.2. Products
- 12.1.6.3. Company Financials
- 12.1.6.4. SWOT Analysis
- 12.1.1 Veolia Environnement S A
- 12.2. Market Entropy
- 12.2.1 Company's Key Areas Served
- 12.2.2 Recent Developments
- 12.3. Company Market Share Analysis 2025
- 12.3.1 Top 5 Companies Market Share Analysis
- 12.3.2 Top 3 Companies Market Share Analysis
- 12.4. List of Potential Customers
- 13. Research Methodology
List of Figures
- Figure 1: Global UK Offshore Oil And Gas Decommissioning Market Revenue Breakdown (billion, %) by Region 2025 & 2033
- Figure 2: Global UK Offshore Oil And Gas Decommissioning Market Volume Breakdown (K Units, %) by Region 2025 & 2033
- Figure 3: North America UK Offshore Oil And Gas Decommissioning Market Revenue (billion), by Shallow Water 2025 & 2033
- Figure 4: North America UK Offshore Oil And Gas Decommissioning Market Volume (K Units), by Shallow Water 2025 & 2033
- Figure 5: North America UK Offshore Oil And Gas Decommissioning Market Revenue Share (%), by Shallow Water 2025 & 2033
- Figure 6: North America UK Offshore Oil And Gas Decommissioning Market Volume Share (%), by Shallow Water 2025 & 2033
- Figure 7: North America UK Offshore Oil And Gas Decommissioning Market Revenue (billion), by Deepwater and Ultra-Deep Water 2025 & 2033
- Figure 8: North America UK Offshore Oil And Gas Decommissioning Market Volume (K Units), by Deepwater and Ultra-Deep Water 2025 & 2033
- Figure 9: North America UK Offshore Oil And Gas Decommissioning Market Revenue Share (%), by Deepwater and Ultra-Deep Water 2025 & 2033
- Figure 10: North America UK Offshore Oil And Gas Decommissioning Market Volume Share (%), by Deepwater and Ultra-Deep Water 2025 & 2033
- Figure 11: North America UK Offshore Oil And Gas Decommissioning Market Revenue (billion), by Country 2025 & 2033
- Figure 12: North America UK Offshore Oil And Gas Decommissioning Market Volume (K Units), by Country 2025 & 2033
- Figure 13: North America UK Offshore Oil And Gas Decommissioning Market Revenue Share (%), by Country 2025 & 2033
- Figure 14: North America UK Offshore Oil And Gas Decommissioning Market Volume Share (%), by Country 2025 & 2033
- Figure 15: South America UK Offshore Oil And Gas Decommissioning Market Revenue (billion), by Shallow Water 2025 & 2033
- Figure 16: South America UK Offshore Oil And Gas Decommissioning Market Volume (K Units), by Shallow Water 2025 & 2033
- Figure 17: South America UK Offshore Oil And Gas Decommissioning Market Revenue Share (%), by Shallow Water 2025 & 2033
- Figure 18: South America UK Offshore Oil And Gas Decommissioning Market Volume Share (%), by Shallow Water 2025 & 2033
- Figure 19: South America UK Offshore Oil And Gas Decommissioning Market Revenue (billion), by Deepwater and Ultra-Deep Water 2025 & 2033
- Figure 20: South America UK Offshore Oil And Gas Decommissioning Market Volume (K Units), by Deepwater and Ultra-Deep Water 2025 & 2033
- Figure 21: South America UK Offshore Oil And Gas Decommissioning Market Revenue Share (%), by Deepwater and Ultra-Deep Water 2025 & 2033
- Figure 22: South America UK Offshore Oil And Gas Decommissioning Market Volume Share (%), by Deepwater and Ultra-Deep Water 2025 & 2033
- Figure 23: South America UK Offshore Oil And Gas Decommissioning Market Revenue (billion), by Country 2025 & 2033
- Figure 24: South America UK Offshore Oil And Gas Decommissioning Market Volume (K Units), by Country 2025 & 2033
- Figure 25: South America UK Offshore Oil And Gas Decommissioning Market Revenue Share (%), by Country 2025 & 2033
- Figure 26: South America UK Offshore Oil And Gas Decommissioning Market Volume Share (%), by Country 2025 & 2033
- Figure 27: Europe UK Offshore Oil And Gas Decommissioning Market Revenue (billion), by Shallow Water 2025 & 2033
- Figure 28: Europe UK Offshore Oil And Gas Decommissioning Market Volume (K Units), by Shallow Water 2025 & 2033
- Figure 29: Europe UK Offshore Oil And Gas Decommissioning Market Revenue Share (%), by Shallow Water 2025 & 2033
- Figure 30: Europe UK Offshore Oil And Gas Decommissioning Market Volume Share (%), by Shallow Water 2025 & 2033
- Figure 31: Europe UK Offshore Oil And Gas Decommissioning Market Revenue (billion), by Deepwater and Ultra-Deep Water 2025 & 2033
- Figure 32: Europe UK Offshore Oil And Gas Decommissioning Market Volume (K Units), by Deepwater and Ultra-Deep Water 2025 & 2033
- Figure 33: Europe UK Offshore Oil And Gas Decommissioning Market Revenue Share (%), by Deepwater and Ultra-Deep Water 2025 & 2033
- Figure 34: Europe UK Offshore Oil And Gas Decommissioning Market Volume Share (%), by Deepwater and Ultra-Deep Water 2025 & 2033
- Figure 35: Europe UK Offshore Oil And Gas Decommissioning Market Revenue (billion), by Country 2025 & 2033
- Figure 36: Europe UK Offshore Oil And Gas Decommissioning Market Volume (K Units), by Country 2025 & 2033
- Figure 37: Europe UK Offshore Oil And Gas Decommissioning Market Revenue Share (%), by Country 2025 & 2033
- Figure 38: Europe UK Offshore Oil And Gas Decommissioning Market Volume Share (%), by Country 2025 & 2033
- Figure 39: Middle East & Africa UK Offshore Oil And Gas Decommissioning Market Revenue (billion), by Shallow Water 2025 & 2033
- Figure 40: Middle East & Africa UK Offshore Oil And Gas Decommissioning Market Volume (K Units), by Shallow Water 2025 & 2033
- Figure 41: Middle East & Africa UK Offshore Oil And Gas Decommissioning Market Revenue Share (%), by Shallow Water 2025 & 2033
- Figure 42: Middle East & Africa UK Offshore Oil And Gas Decommissioning Market Volume Share (%), by Shallow Water 2025 & 2033
- Figure 43: Middle East & Africa UK Offshore Oil And Gas Decommissioning Market Revenue (billion), by Deepwater and Ultra-Deep Water 2025 & 2033
- Figure 44: Middle East & Africa UK Offshore Oil And Gas Decommissioning Market Volume (K Units), by Deepwater and Ultra-Deep Water 2025 & 2033
- Figure 45: Middle East & Africa UK Offshore Oil And Gas Decommissioning Market Revenue Share (%), by Deepwater and Ultra-Deep Water 2025 & 2033
- Figure 46: Middle East & Africa UK Offshore Oil And Gas Decommissioning Market Volume Share (%), by Deepwater and Ultra-Deep Water 2025 & 2033
- Figure 47: Middle East & Africa UK Offshore Oil And Gas Decommissioning Market Revenue (billion), by Country 2025 & 2033
- Figure 48: Middle East & Africa UK Offshore Oil And Gas Decommissioning Market Volume (K Units), by Country 2025 & 2033
- Figure 49: Middle East & Africa UK Offshore Oil And Gas Decommissioning Market Revenue Share (%), by Country 2025 & 2033
- Figure 50: Middle East & Africa UK Offshore Oil And Gas Decommissioning Market Volume Share (%), by Country 2025 & 2033
- Figure 51: Asia Pacific UK Offshore Oil And Gas Decommissioning Market Revenue (billion), by Shallow Water 2025 & 2033
- Figure 52: Asia Pacific UK Offshore Oil And Gas Decommissioning Market Volume (K Units), by Shallow Water 2025 & 2033
- Figure 53: Asia Pacific UK Offshore Oil And Gas Decommissioning Market Revenue Share (%), by Shallow Water 2025 & 2033
- Figure 54: Asia Pacific UK Offshore Oil And Gas Decommissioning Market Volume Share (%), by Shallow Water 2025 & 2033
- Figure 55: Asia Pacific UK Offshore Oil And Gas Decommissioning Market Revenue (billion), by Deepwater and Ultra-Deep Water 2025 & 2033
- Figure 56: Asia Pacific UK Offshore Oil And Gas Decommissioning Market Volume (K Units), by Deepwater and Ultra-Deep Water 2025 & 2033
- Figure 57: Asia Pacific UK Offshore Oil And Gas Decommissioning Market Revenue Share (%), by Deepwater and Ultra-Deep Water 2025 & 2033
- Figure 58: Asia Pacific UK Offshore Oil And Gas Decommissioning Market Volume Share (%), by Deepwater and Ultra-Deep Water 2025 & 2033
- Figure 59: Asia Pacific UK Offshore Oil And Gas Decommissioning Market Revenue (billion), by Country 2025 & 2033
- Figure 60: Asia Pacific UK Offshore Oil And Gas Decommissioning Market Volume (K Units), by Country 2025 & 2033
- Figure 61: Asia Pacific UK Offshore Oil And Gas Decommissioning Market Revenue Share (%), by Country 2025 & 2033
- Figure 62: Asia Pacific UK Offshore Oil And Gas Decommissioning Market Volume Share (%), by Country 2025 & 2033
List of Tables
- Table 1: Global UK Offshore Oil And Gas Decommissioning Market Revenue billion Forecast, by Shallow Water 2020 & 2033
- Table 2: Global UK Offshore Oil And Gas Decommissioning Market Volume K Units Forecast, by Shallow Water 2020 & 2033
- Table 3: Global UK Offshore Oil And Gas Decommissioning Market Revenue billion Forecast, by Deepwater and Ultra-Deep Water 2020 & 2033
- Table 4: Global UK Offshore Oil And Gas Decommissioning Market Volume K Units Forecast, by Deepwater and Ultra-Deep Water 2020 & 2033
- Table 5: Global UK Offshore Oil And Gas Decommissioning Market Revenue billion Forecast, by Region 2020 & 2033
- Table 6: Global UK Offshore Oil And Gas Decommissioning Market Volume K Units Forecast, by Region 2020 & 2033
- Table 7: Global UK Offshore Oil And Gas Decommissioning Market Revenue billion Forecast, by Shallow Water 2020 & 2033
- Table 8: Global UK Offshore Oil And Gas Decommissioning Market Volume K Units Forecast, by Shallow Water 2020 & 2033
- Table 9: Global UK Offshore Oil And Gas Decommissioning Market Revenue billion Forecast, by Deepwater and Ultra-Deep Water 2020 & 2033
- Table 10: Global UK Offshore Oil And Gas Decommissioning Market Volume K Units Forecast, by Deepwater and Ultra-Deep Water 2020 & 2033
- Table 11: Global UK Offshore Oil And Gas Decommissioning Market Revenue billion Forecast, by Country 2020 & 2033
- Table 12: Global UK Offshore Oil And Gas Decommissioning Market Volume K Units Forecast, by Country 2020 & 2033
- Table 13: United States UK Offshore Oil And Gas Decommissioning Market Revenue (billion) Forecast, by Application 2020 & 2033
- Table 14: United States UK Offshore Oil And Gas Decommissioning Market Volume (K Units) Forecast, by Application 2020 & 2033
- Table 15: Canada UK Offshore Oil And Gas Decommissioning Market Revenue (billion) Forecast, by Application 2020 & 2033
- Table 16: Canada UK Offshore Oil And Gas Decommissioning Market Volume (K Units) Forecast, by Application 2020 & 2033
- Table 17: Mexico UK Offshore Oil And Gas Decommissioning Market Revenue (billion) Forecast, by Application 2020 & 2033
- Table 18: Mexico UK Offshore Oil And Gas Decommissioning Market Volume (K Units) Forecast, by Application 2020 & 2033
- Table 19: Global UK Offshore Oil And Gas Decommissioning Market Revenue billion Forecast, by Shallow Water 2020 & 2033
- Table 20: Global UK Offshore Oil And Gas Decommissioning Market Volume K Units Forecast, by Shallow Water 2020 & 2033
- Table 21: Global UK Offshore Oil And Gas Decommissioning Market Revenue billion Forecast, by Deepwater and Ultra-Deep Water 2020 & 2033
- Table 22: Global UK Offshore Oil And Gas Decommissioning Market Volume K Units Forecast, by Deepwater and Ultra-Deep Water 2020 & 2033
- Table 23: Global UK Offshore Oil And Gas Decommissioning Market Revenue billion Forecast, by Country 2020 & 2033
- Table 24: Global UK Offshore Oil And Gas Decommissioning Market Volume K Units Forecast, by Country 2020 & 2033
- Table 25: Brazil UK Offshore Oil And Gas Decommissioning Market Revenue (billion) Forecast, by Application 2020 & 2033
- Table 26: Brazil UK Offshore Oil And Gas Decommissioning Market Volume (K Units) Forecast, by Application 2020 & 2033
- Table 27: Argentina UK Offshore Oil And Gas Decommissioning Market Revenue (billion) Forecast, by Application 2020 & 2033
- Table 28: Argentina UK Offshore Oil And Gas Decommissioning Market Volume (K Units) Forecast, by Application 2020 & 2033
- Table 29: Rest of South America UK Offshore Oil And Gas Decommissioning Market Revenue (billion) Forecast, by Application 2020 & 2033
- Table 30: Rest of South America UK Offshore Oil And Gas Decommissioning Market Volume (K Units) Forecast, by Application 2020 & 2033
- Table 31: Global UK Offshore Oil And Gas Decommissioning Market Revenue billion Forecast, by Shallow Water 2020 & 2033
- Table 32: Global UK Offshore Oil And Gas Decommissioning Market Volume K Units Forecast, by Shallow Water 2020 & 2033
- Table 33: Global UK Offshore Oil And Gas Decommissioning Market Revenue billion Forecast, by Deepwater and Ultra-Deep Water 2020 & 2033
- Table 34: Global UK Offshore Oil And Gas Decommissioning Market Volume K Units Forecast, by Deepwater and Ultra-Deep Water 2020 & 2033
- Table 35: Global UK Offshore Oil And Gas Decommissioning Market Revenue billion Forecast, by Country 2020 & 2033
- Table 36: Global UK Offshore Oil And Gas Decommissioning Market Volume K Units Forecast, by Country 2020 & 2033
- Table 37: United Kingdom UK Offshore Oil And Gas Decommissioning Market Revenue (billion) Forecast, by Application 2020 & 2033
- Table 38: United Kingdom UK Offshore Oil And Gas Decommissioning Market Volume (K Units) Forecast, by Application 2020 & 2033
- Table 39: Germany UK Offshore Oil And Gas Decommissioning Market Revenue (billion) Forecast, by Application 2020 & 2033
- Table 40: Germany UK Offshore Oil And Gas Decommissioning Market Volume (K Units) Forecast, by Application 2020 & 2033
- Table 41: France UK Offshore Oil And Gas Decommissioning Market Revenue (billion) Forecast, by Application 2020 & 2033
- Table 42: France UK Offshore Oil And Gas Decommissioning Market Volume (K Units) Forecast, by Application 2020 & 2033
- Table 43: Italy UK Offshore Oil And Gas Decommissioning Market Revenue (billion) Forecast, by Application 2020 & 2033
- Table 44: Italy UK Offshore Oil And Gas Decommissioning Market Volume (K Units) Forecast, by Application 2020 & 2033
- Table 45: Spain UK Offshore Oil And Gas Decommissioning Market Revenue (billion) Forecast, by Application 2020 & 2033
- Table 46: Spain UK Offshore Oil And Gas Decommissioning Market Volume (K Units) Forecast, by Application 2020 & 2033
- Table 47: Russia UK Offshore Oil And Gas Decommissioning Market Revenue (billion) Forecast, by Application 2020 & 2033
- Table 48: Russia UK Offshore Oil And Gas Decommissioning Market Volume (K Units) Forecast, by Application 2020 & 2033
- Table 49: Benelux UK Offshore Oil And Gas Decommissioning Market Revenue (billion) Forecast, by Application 2020 & 2033
- Table 50: Benelux UK Offshore Oil And Gas Decommissioning Market Volume (K Units) Forecast, by Application 2020 & 2033
- Table 51: Nordics UK Offshore Oil And Gas Decommissioning Market Revenue (billion) Forecast, by Application 2020 & 2033
- Table 52: Nordics UK Offshore Oil And Gas Decommissioning Market Volume (K Units) Forecast, by Application 2020 & 2033
- Table 53: Rest of Europe UK Offshore Oil And Gas Decommissioning Market Revenue (billion) Forecast, by Application 2020 & 2033
- Table 54: Rest of Europe UK Offshore Oil And Gas Decommissioning Market Volume (K Units) Forecast, by Application 2020 & 2033
- Table 55: Global UK Offshore Oil And Gas Decommissioning Market Revenue billion Forecast, by Shallow Water 2020 & 2033
- Table 56: Global UK Offshore Oil And Gas Decommissioning Market Volume K Units Forecast, by Shallow Water 2020 & 2033
- Table 57: Global UK Offshore Oil And Gas Decommissioning Market Revenue billion Forecast, by Deepwater and Ultra-Deep Water 2020 & 2033
- Table 58: Global UK Offshore Oil And Gas Decommissioning Market Volume K Units Forecast, by Deepwater and Ultra-Deep Water 2020 & 2033
- Table 59: Global UK Offshore Oil And Gas Decommissioning Market Revenue billion Forecast, by Country 2020 & 2033
- Table 60: Global UK Offshore Oil And Gas Decommissioning Market Volume K Units Forecast, by Country 2020 & 2033
- Table 61: Turkey UK Offshore Oil And Gas Decommissioning Market Revenue (billion) Forecast, by Application 2020 & 2033
- Table 62: Turkey UK Offshore Oil And Gas Decommissioning Market Volume (K Units) Forecast, by Application 2020 & 2033
- Table 63: Israel UK Offshore Oil And Gas Decommissioning Market Revenue (billion) Forecast, by Application 2020 & 2033
- Table 64: Israel UK Offshore Oil And Gas Decommissioning Market Volume (K Units) Forecast, by Application 2020 & 2033
- Table 65: GCC UK Offshore Oil And Gas Decommissioning Market Revenue (billion) Forecast, by Application 2020 & 2033
- Table 66: GCC UK Offshore Oil And Gas Decommissioning Market Volume (K Units) Forecast, by Application 2020 & 2033
- Table 67: North Africa UK Offshore Oil And Gas Decommissioning Market Revenue (billion) Forecast, by Application 2020 & 2033
- Table 68: North Africa UK Offshore Oil And Gas Decommissioning Market Volume (K Units) Forecast, by Application 2020 & 2033
- Table 69: South Africa UK Offshore Oil And Gas Decommissioning Market Revenue (billion) Forecast, by Application 2020 & 2033
- Table 70: South Africa UK Offshore Oil And Gas Decommissioning Market Volume (K Units) Forecast, by Application 2020 & 2033
- Table 71: Rest of Middle East & Africa UK Offshore Oil And Gas Decommissioning Market Revenue (billion) Forecast, by Application 2020 & 2033
- Table 72: Rest of Middle East & Africa UK Offshore Oil And Gas Decommissioning Market Volume (K Units) Forecast, by Application 2020 & 2033
- Table 73: Global UK Offshore Oil And Gas Decommissioning Market Revenue billion Forecast, by Shallow Water 2020 & 2033
- Table 74: Global UK Offshore Oil And Gas Decommissioning Market Volume K Units Forecast, by Shallow Water 2020 & 2033
- Table 75: Global UK Offshore Oil And Gas Decommissioning Market Revenue billion Forecast, by Deepwater and Ultra-Deep Water 2020 & 2033
- Table 76: Global UK Offshore Oil And Gas Decommissioning Market Volume K Units Forecast, by Deepwater and Ultra-Deep Water 2020 & 2033
- Table 77: Global UK Offshore Oil And Gas Decommissioning Market Revenue billion Forecast, by Country 2020 & 2033
- Table 78: Global UK Offshore Oil And Gas Decommissioning Market Volume K Units Forecast, by Country 2020 & 2033
- Table 79: China UK Offshore Oil And Gas Decommissioning Market Revenue (billion) Forecast, by Application 2020 & 2033
- Table 80: China UK Offshore Oil And Gas Decommissioning Market Volume (K Units) Forecast, by Application 2020 & 2033
- Table 81: India UK Offshore Oil And Gas Decommissioning Market Revenue (billion) Forecast, by Application 2020 & 2033
- Table 82: India UK Offshore Oil And Gas Decommissioning Market Volume (K Units) Forecast, by Application 2020 & 2033
- Table 83: Japan UK Offshore Oil And Gas Decommissioning Market Revenue (billion) Forecast, by Application 2020 & 2033
- Table 84: Japan UK Offshore Oil And Gas Decommissioning Market Volume (K Units) Forecast, by Application 2020 & 2033
- Table 85: South Korea UK Offshore Oil And Gas Decommissioning Market Revenue (billion) Forecast, by Application 2020 & 2033
- Table 86: South Korea UK Offshore Oil And Gas Decommissioning Market Volume (K Units) Forecast, by Application 2020 & 2033
- Table 87: ASEAN UK Offshore Oil And Gas Decommissioning Market Revenue (billion) Forecast, by Application 2020 & 2033
- Table 88: ASEAN UK Offshore Oil And Gas Decommissioning Market Volume (K Units) Forecast, by Application 2020 & 2033
- Table 89: Oceania UK Offshore Oil And Gas Decommissioning Market Revenue (billion) Forecast, by Application 2020 & 2033
- Table 90: Oceania UK Offshore Oil And Gas Decommissioning Market Volume (K Units) Forecast, by Application 2020 & 2033
- Table 91: Rest of Asia Pacific UK Offshore Oil And Gas Decommissioning Market Revenue (billion) Forecast, by Application 2020 & 2033
- Table 92: Rest of Asia Pacific UK Offshore Oil And Gas Decommissioning Market Volume (K Units) Forecast, by Application 2020 & 2033
Frequently Asked Questions
1. What is the projected Compound Annual Growth Rate (CAGR) of the UK Offshore Oil And Gas Decommissioning Market?
The projected CAGR is approximately 6.5%.
2. Which companies are prominent players in the UK Offshore Oil And Gas Decommissioning Market?
Key companies in the market include Veolia Environnement S A, John Lawrie Group Ltd *List Not Exhaustive, AF Gruppen ASA, Ramboll Group A/S, Perenco SA, Derrick Services (UK) Ltd.
3. What are the main segments of the UK Offshore Oil And Gas Decommissioning Market?
The market segments include Shallow Water, Deepwater and Ultra-Deep Water.
4. Can you provide details about the market size?
The market size is estimated to be USD 11.1 billion as of 2022.
5. What are some drivers contributing to market growth?
4.; Supportive Government Policies in Developing Solar Energy4.; Abundant Solar Resources Across the Country.
6. What are the notable trends driving market growth?
Increasing Decommissioning Projects to Drive the Market.
7. Are there any restraints impacting market growth?
4.; Competition from Conventional Energy Sources.
8. Can you provide examples of recent developments in the market?
November 2022: there were more than 2,000 abandoned oil and gas wells in the North Sea begin, The high number of abandoned wells is expected to lead to an increase in activity as operations worth EUR 20 billion are decommissioned and shut down. The research was conducted by industry group Offshore Energies UK (OEUK), formerly Oil & Gas UK, which provides fresh insight into petroleum decommissioning efforts.
9. What pricing options are available for accessing the report?
Pricing options include single-user, multi-user, and enterprise licenses priced at USD 3800, USD 4500, and USD 5800 respectively.
10. Is the market size provided in terms of value or volume?
The market size is provided in terms of value, measured in billion and volume, measured in K Units.
11. Are there any specific market keywords associated with the report?
Yes, the market keyword associated with the report is "UK Offshore Oil And Gas Decommissioning Market," which aids in identifying and referencing the specific market segment covered.
12. How do I determine which pricing option suits my needs best?
The pricing options vary based on user requirements and access needs. Individual users may opt for single-user licenses, while businesses requiring broader access may choose multi-user or enterprise licenses for cost-effective access to the report.
13. Are there any additional resources or data provided in the UK Offshore Oil And Gas Decommissioning Market report?
While the report offers comprehensive insights, it's advisable to review the specific contents or supplementary materials provided to ascertain if additional resources or data are available.
14. How can I stay updated on further developments or reports in the UK Offshore Oil And Gas Decommissioning Market?
To stay informed about further developments, trends, and reports in the UK Offshore Oil And Gas Decommissioning Market, consider subscribing to industry newsletters, following relevant companies and organizations, or regularly checking reputable industry news sources and publications.
Methodology
Step 1 - Identification of Relevant Samples Size from Population Database


Step 2 - Approaches for Defining Global Market Size (Value, Volume* & Price*)

Note*: In applicable scenarios
Step 3 - Data Sources
Primary Research
- Web Analytics
- Survey Reports
- Research Institute
- Latest Research Reports
- Opinion Leaders
Secondary Research
- Annual Reports
- White Paper
- Latest Press Release
- Industry Association
- Paid Database
- Investor Presentations

Step 4 - Data Triangulation
Involves using different sources of information in order to increase the validity of a study
These sources are likely to be stakeholders in a program - participants, other researchers, program staff, other community members, and so on.
Then we put all data in single framework & apply various statistical tools to find out the dynamic on the market.
During the analysis stage, feedback from the stakeholder groups would be compared to determine areas of agreement as well as areas of divergence