


Key Insights
The global Solar Grid-tied Inverter market is projected for significant expansion, anticipated to reach a market size of $6.29 billion by 2025, exhibiting a Compound Annual Growth Rate (CAGR) of 7.4%. This growth is driven by increasing demand for renewable energy, stringent environmental regulations, supportive government policies, and the imperative to diversify energy sources. As solar photovoltaic (PV) installations grow in residential and commercial sectors, the demand for efficient grid-tied inverters, which convert DC to AC power, is set to increase. Key applications include residential solar, utility-scale solar farms, and grid integration projects.
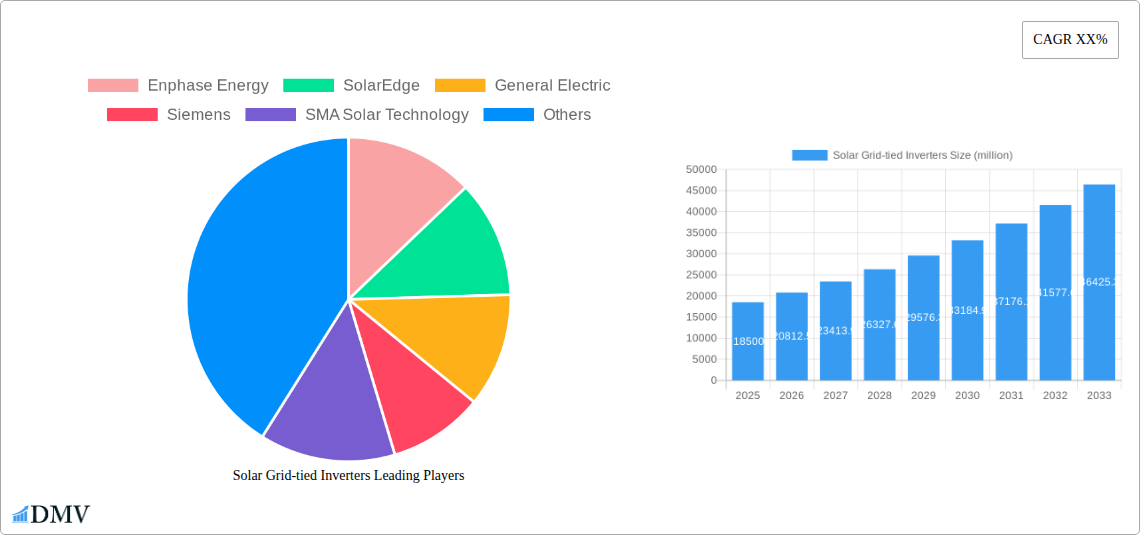
Solar Grid-tied Inverters Market Size (In Billion)

Technological advancements in inverter efficiency, grid integration, and smart inverter functionalities are further accelerating market adoption. Innovations in high-frequency inverters contribute to compact designs and improved performance. Growing adoption of energy management systems and increasing consumer awareness of energy independence and cost savings also fuel the market. While supply chain disruptions, raw material cost fluctuations, and the need for standardized grid connection protocols may pose challenges, the global commitment to sustainability and declining solar technology costs are expected to ensure robust growth for the Solar Grid-tied Inverter market.
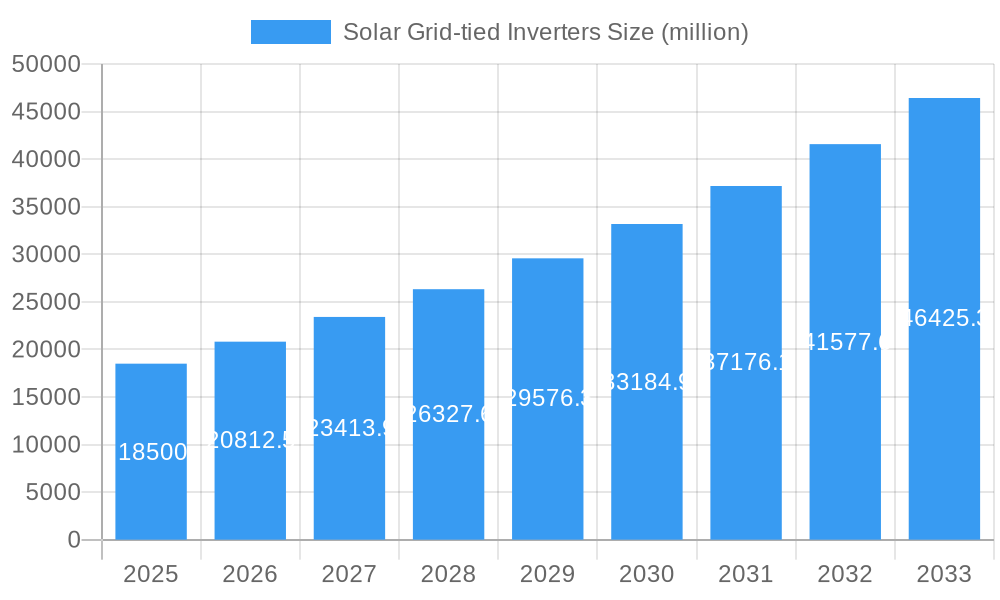
Solar Grid-tied Inverters Company Market Share
Solar Grid-tied Inverters Market Report: Comprehensive Analysis & Strategic Forecast (2019-2033)
This in-depth market research report provides a strategic analysis of the global Solar Grid-tied Inverters Market, offering critical insights for stakeholders navigating this dynamic sector. Covering a Study Period from 2019 to 2033, with a Base Year of 2025 and a Forecast Period of 2025–2033, this report delves into market composition, industry evolution, regional dominance, product innovations, growth drivers, obstacles, and future opportunities. We meticulously analyze the competitive landscape, technological advancements, and regulatory frameworks shaping the solar inverter market, with a particular focus on photovoltaic inverter performance and renewable energy integration. This report is essential for understanding market trends, investment potential, and strategic planning within the burgeoning solar energy sector.
Solar Grid-tied Inverters Market Composition & Trends
The solar grid-tied inverters market exhibits a moderately consolidated structure, with leading manufacturers like Sungrow, Huawei, and Enphase Energy holding significant market share, estimated to be over $15,000 million in 2025. Innovation catalysts include the ongoing quest for higher energy conversion efficiencies, advanced grid integration capabilities such as smart grid solutions and frequency regulation, and the development of more robust and reliable photovoltaic inverters. The regulatory landscape plays a crucial role, with government incentives, feed-in tariffs, and grid interconnection standards significantly influencing market adoption. Substitute products, primarily off-grid inverters and battery storage systems, are becoming increasingly competitive, especially in regions with unreliable grids. End-user profiles range from residential and commercial building owners to utility-scale solar farm developers, each with distinct needs for DC voltage source and grid connection capabilities. Mergers and acquisitions (M&A) activity, valued at approximately $500 million in the last five years, continues to shape the market, as larger players seek to expand their product portfolios and geographical reach. Key M&A trends include consolidation among inverter manufacturers and strategic partnerships for integrated solar solutions.
Solar Grid-tied Inverters Industry Evolution
The solar grid-tied inverters industry has witnessed remarkable evolution, driven by a confluence of technological innovation, supportive government policies, and a growing global imperative for clean energy. From the historical period of 2019–2024, the market has experienced a compound annual growth rate (CAGR) of approximately 15%, a trajectory anticipated to continue into the forecast period. This robust growth is fueled by the plummeting cost of solar panels and the increasing demand for sustainable energy solutions across residential, commercial, and utility sectors. Technological advancements have been pivotal, with the transition from traditional low frequency inverters to more efficient and sophisticated high frequency inverters and advanced string inverter designs. Innovations such as Maximum Power Point Tracking (MPPT) algorithms have been refined to maximize energy harvest, while the integration of communication technologies has enabled remote monitoring, diagnostics, and participation in grid services. Shifting consumer demands are also playing a significant role. As awareness of climate change grows and energy costs rise, consumers are increasingly seeking ways to reduce their carbon footprint and achieve energy independence. This has led to a surge in distributed solar installations, further boosting the demand for residential and commercial grid-tied inverters. The development of hybrid inverters, capable of managing both grid-connected and battery storage systems, addresses the growing interest in energy resilience and backup power. The industry's evolution is also marked by increasing modularity, miniaturization, and enhanced safety features in inverter designs. The total market size for solar grid-tied inverters is projected to reach over $35,000 million by 2033, a testament to the sector's sustained dynamism and its critical role in the global energy transition.
Leading Regions, Countries, or Segments in Solar Grid-tied Inverters
The Grid Connection application segment overwhelmingly dominates the Solar Grid-tied Inverters Market, accounting for an estimated 90% of the market value in 2025, projected to be worth over $30,000 million. This dominance is driven by the fundamental purpose of these inverters: to enable the seamless integration of solar power into existing electricity grids. Key drivers for this segment's leadership include:
- Massive Utility-Scale Solar Farm Deployments: Countries with ambitious renewable energy targets and vast land resources are investing heavily in large-scale solar power plants. These projects require a substantial number of high-capacity grid-tied inverters to inject clean electricity into the national grid.
- Supportive Government Policies and Grid Interconnection Standards: Favorable feed-in tariffs, net metering policies, and clear grid interconnection regulations in leading nations encourage the adoption of solar energy and, consequently, grid-tied inverters. Regions like Asia-Pacific, North America, and Europe are at the forefront of such supportive frameworks.
- Declining Levelized Cost of Electricity (LCOE) for Solar: As the LCOE for solar power continues to fall, making it competitive with, and in some cases cheaper than, traditional fossil fuels, the economic viability of grid-connected solar projects increases significantly.
- Corporate Power Purchase Agreements (PPAs): A growing number of corporations are signing PPAs for solar energy, driving demand for utility-scale installations that rely heavily on grid-tied inverters.
Within this dominant segment, the High Frequency Inverter type is rapidly gaining traction, representing a significant portion of the market share and projected to grow at a CAGR of approximately 18% during the forecast period. This preference stems from their superior efficiency, smaller physical footprint, and enhanced power density compared to their Low Frequency Inverter counterparts.
- Technological Superiority of High Frequency Inverters: These inverters offer better energy conversion rates, leading to greater energy yields from solar installations. Their advanced control algorithms also contribute to improved grid stability and power quality.
- Miniaturization and Ease of Installation: The smaller size and lighter weight of high-frequency inverters simplify transportation and installation, reducing labor costs for both residential and commercial projects.
- Advanced Features and Connectivity: High-frequency inverters are often equipped with sophisticated digital controls, enabling seamless communication with smart grids, remote monitoring capabilities, and advanced fault detection.
The DC Voltage Source application, while less dominant, serves niche markets such as specialized industrial applications and certain off-grid systems that still require grid synchronization capabilities. The "Others" category encompasses emerging applications and specialized configurations that are gradually gaining market share.
Solar Grid-tied Inverters Product Innovations
Product innovation in the solar grid-tied inverters market is primarily focused on enhancing energy conversion efficiency, improving grid integration capabilities, and increasing system reliability. Manufacturers are developing advanced Maximum Power Point Tracking (MPPT) algorithms for optimal energy harvest under varying irradiance and temperature conditions. The integration of smart grid functionalities, such as grid support services (e.g., voltage and frequency regulation) and demand response capabilities, is a significant trend. Furthermore, advancements in materials science and thermal management are leading to more compact, lightweight, and durable inverter designs with extended lifespans. For instance, Enphase Energy's microinverter technology offers granular energy monitoring and panel-level optimization, while SolarEdge’s power optimizers enhance system performance and safety. These innovations are critical for maximizing the return on investment for solar projects and ensuring seamless integration into the evolving energy landscape.
Propelling Factors for Solar Grid-tied Inverters Growth
The solar grid-tied inverters market is experiencing robust growth driven by several key factors. Firstly, increasing global investments in renewable energy infrastructure, fueled by environmental concerns and the need for energy security, are paramount. Government policies, including tax incentives, subsidies, and renewable portfolio standards, provide significant financial impetus for solar adoption. Secondly, technological advancements in inverter design, leading to higher efficiencies, enhanced grid integration capabilities, and reduced costs, are making solar energy more accessible and attractive. The continuous decline in the levelized cost of solar electricity further strengthens this trend. Finally, growing consumer awareness and demand for sustainable energy solutions, coupled with the rising costs of conventional energy sources, are pushing individuals and businesses towards solar power, directly stimulating the demand for grid-tied inverters. The estimated market growth rate is approximately 16% annually.
Obstacles in the Solar Grid-tied Inverters Market
Despite its strong growth trajectory, the solar grid-tied inverters market faces several obstacles. Regulatory hurdles, including complex permitting processes, evolving grid interconnection standards, and inconsistent policy frameworks across different regions, can impede the pace of solar deployment. Supply chain disruptions, exacerbated by geopolitical events and the demand for critical components, can lead to price volatility and extended lead times for inverters, impacting project timelines and budgets. Furthermore, the increasing competition from established and emerging players, coupled with the commoditization of certain inverter segments, exerts downward pressure on profit margins. The threat of cybersecurity breaches targeting connected inverters also poses a significant concern for grid stability and data security, necessitating robust protective measures.
Future Opportunities in Solar Grid-tied Inverters
Emerging opportunities in the solar grid-tied inverters market are abundant. The expansion of smart grid technologies presents a significant avenue, with inverters playing a crucial role in enabling grid stability, demand response, and microgrid functionalities. The growing demand for energy storage solutions is also creating opportunities for hybrid inverters that seamlessly integrate battery storage with solar PV systems. Furthermore, the development of advanced inverter technologies, such as artificial intelligence-powered diagnostics and predictive maintenance, will enhance system reliability and reduce operational costs. Emerging markets in developing economies, with their vast untapped solar potential and increasing energy demands, represent substantial growth prospects. The continuous innovation in inverter form factors and integrated solutions will also cater to diverse application needs.
Major Players in the Solar Grid-tied Inverters Ecosystem
- Enphase Energy
- SolarEdge
- General Electric
- Siemens
- SMA Solar Technology
- Schneider Electric
- Cyber Power Systems
- OutBack Power Technologies
- Luminous
- Leonics
- INVT
- Easun Power
- Alencon Systems
- Fimer Group (ABB)
- Sungrow
- Hitachi
- Huawei
- TBEA
- Yaskawa-Solectria Solar
- Power Electronics
- Fronius
- TMEIC
- Growatt
- Tabuchi Electric
- Apsystems
- NEGO
- Yuneng Technology
- Hoymiles
- Ginlong
- GoodWe
Key Developments in Solar Grid-tied Inverters Industry
- 2023/06: Sungrow launches its new range of commercial string inverters with enhanced grid support functionalities, boosting market competitiveness.
- 2023/04: Huawei announces significant advancements in its inverter technology, focusing on AI-driven performance optimization and enhanced cybersecurity features.
- 2023/02: Enphase Energy reports strong growth in its microinverter installations, highlighting increasing residential adoption and system reliability.
- 2022/12: SolarEdge showcases its latest power optimizers and inverters designed for complex commercial and utility-scale projects, emphasizing safety and efficiency.
- 2022/10: Fimer Group (ABB) acquires a significant market share in the European utility-scale inverter segment, signaling consolidation trends.
Strategic Solar Grid-tied Inverters Market Forecast
The strategic forecast for the solar grid-tied inverters market indicates sustained and robust growth, projected to exceed $50,000 million by 2033, with an estimated CAGR of 17% from 2025-2033. This optimistic outlook is primarily driven by accelerating global renewable energy targets, supportive government policies worldwide, and the continuous decrease in the cost of solar electricity. Technological advancements in inverter efficiency, grid integration capabilities, and the rise of hybrid inverter solutions that combine solar and storage are key growth catalysts. Emerging markets, coupled with the increasing demand for distributed energy resources and microgrids, offer substantial expansion opportunities. Players focusing on innovation in smart inverter technology, cybersecurity, and enhanced grid services will be well-positioned for success.
Solar Grid-tied Inverters Segmentation
-
1. Application
- 1.1. DC Voltage Source
- 1.2. Grid Connection
- 1.3. Others
-
2. Types
- 2.1. Low Frequency Inverter
- 2.2. High Frequency Inverter
Solar Grid-tied Inverters Segmentation By Geography
-
1. North America
- 1.1. United States
- 1.2. Canada
- 1.3. Mexico
-
2. South America
- 2.1. Brazil
- 2.2. Argentina
- 2.3. Rest of South America
-
3. Europe
- 3.1. United Kingdom
- 3.2. Germany
- 3.3. France
- 3.4. Italy
- 3.5. Spain
- 3.6. Russia
- 3.7. Benelux
- 3.8. Nordics
- 3.9. Rest of Europe
-
4. Middle East & Africa
- 4.1. Turkey
- 4.2. Israel
- 4.3. GCC
- 4.4. North Africa
- 4.5. South Africa
- 4.6. Rest of Middle East & Africa
-
5. Asia Pacific
- 5.1. China
- 5.2. India
- 5.3. Japan
- 5.4. South Korea
- 5.5. ASEAN
- 5.6. Oceania
- 5.7. Rest of Asia Pacific
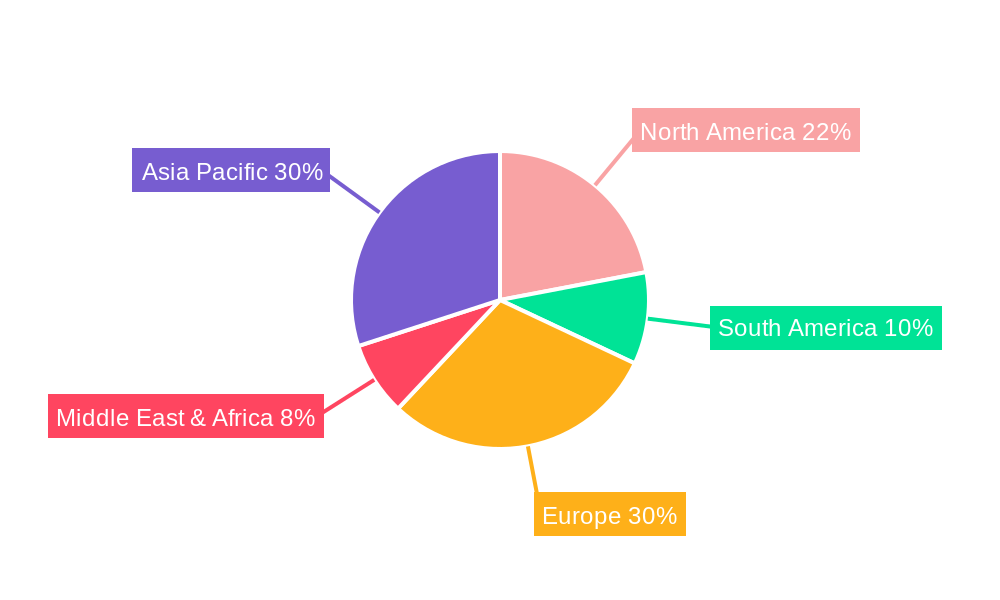
Solar Grid-tied Inverters Regional Market Share
Geographic Coverage of Solar Grid-tied Inverters
Solar Grid-tied Inverters REPORT HIGHLIGHTS
| Aspects | Details |
|---|---|
| Study Period | 2020-2034 |
| Base Year | 2025 |
| Estimated Year | 2026 |
| Forecast Period | 2026-2034 |
| Historical Period | 2020-2025 |
| Growth Rate | CAGR of 7.4% from 2020-2034 |
| Segmentation |
|
Table of Contents
- 1. Introduction
- 1.1. Research Scope
- 1.2. Market Segmentation
- 1.3. Research Objective
- 1.4. Definitions and Assumptions
- 2. Executive Summary
- 2.1. Market Snapshot
- 3. Market Dynamics
- 3.1. Market Drivers
- 3.2. Market Restrains
- 3.3. Market Trends
- 3.4. Market Opportunities
- 4. Market Factor Analysis
- 4.1. Porters Five Forces
- 4.1.1. Bargaining Power of Suppliers
- 4.1.2. Bargaining Power of Buyers
- 4.1.3. Threat of New Entrants
- 4.1.4. Threat of Substitutes
- 4.1.5. Competitive Rivalry
- 4.2. PESTEL analysis
- 4.3. BCG Analysis
- 4.3.1. Stars (High Growth, High Market Share)
- 4.3.2. Cash Cows (Low Growth, High Market Share)
- 4.3.3. Question Mark (High Growth, Low Market Share)
- 4.3.4. Dogs (Low Growth, Low Market Share)
- 4.4. Ansoff Matrix Analysis
- 4.5. Supply Chain Analysis
- 4.6. Regulatory Landscape
- 4.7. Current Market Potential and Opportunity Assessment (TAM–SAM–SOM Framework)
- 4.8. DMV Analyst Note
- 4.1. Porters Five Forces
- 5. Market Analysis, Insights and Forecast 2021-2033
- 5.1. Market Analysis, Insights and Forecast - by Application
- 5.1.1. DC Voltage Source
- 5.1.2. Grid Connection
- 5.1.3. Others
- 5.2. Market Analysis, Insights and Forecast - by Types
- 5.2.1. Low Frequency Inverter
- 5.2.2. High Frequency Inverter
- 5.3. Market Analysis, Insights and Forecast - by Region
- 5.3.1. North America
- 5.3.2. South America
- 5.3.3. Europe
- 5.3.4. Middle East & Africa
- 5.3.5. Asia Pacific
- 5.1. Market Analysis, Insights and Forecast - by Application
- 6. Global Solar Grid-tied Inverters Analysis, Insights and Forecast, 2021-2033
- 6.1. Market Analysis, Insights and Forecast - by Application
- 6.1.1. DC Voltage Source
- 6.1.2. Grid Connection
- 6.1.3. Others
- 6.2. Market Analysis, Insights and Forecast - by Types
- 6.2.1. Low Frequency Inverter
- 6.2.2. High Frequency Inverter
- 6.1. Market Analysis, Insights and Forecast - by Application
- 7. North America Solar Grid-tied Inverters Analysis, Insights and Forecast, 2020-2032
- 7.1. Market Analysis, Insights and Forecast - by Application
- 7.1.1. DC Voltage Source
- 7.1.2. Grid Connection
- 7.1.3. Others
- 7.2. Market Analysis, Insights and Forecast - by Types
- 7.2.1. Low Frequency Inverter
- 7.2.2. High Frequency Inverter
- 7.1. Market Analysis, Insights and Forecast - by Application
- 8. South America Solar Grid-tied Inverters Analysis, Insights and Forecast, 2020-2032
- 8.1. Market Analysis, Insights and Forecast - by Application
- 8.1.1. DC Voltage Source
- 8.1.2. Grid Connection
- 8.1.3. Others
- 8.2. Market Analysis, Insights and Forecast - by Types
- 8.2.1. Low Frequency Inverter
- 8.2.2. High Frequency Inverter
- 8.1. Market Analysis, Insights and Forecast - by Application
- 9. Europe Solar Grid-tied Inverters Analysis, Insights and Forecast, 2020-2032
- 9.1. Market Analysis, Insights and Forecast - by Application
- 9.1.1. DC Voltage Source
- 9.1.2. Grid Connection
- 9.1.3. Others
- 9.2. Market Analysis, Insights and Forecast - by Types
- 9.2.1. Low Frequency Inverter
- 9.2.2. High Frequency Inverter
- 9.1. Market Analysis, Insights and Forecast - by Application
- 10. Middle East & Africa Solar Grid-tied Inverters Analysis, Insights and Forecast, 2020-2032
- 10.1. Market Analysis, Insights and Forecast - by Application
- 10.1.1. DC Voltage Source
- 10.1.2. Grid Connection
- 10.1.3. Others
- 10.2. Market Analysis, Insights and Forecast - by Types
- 10.2.1. Low Frequency Inverter
- 10.2.2. High Frequency Inverter
- 10.1. Market Analysis, Insights and Forecast - by Application
- 11. Asia Pacific Solar Grid-tied Inverters Analysis, Insights and Forecast, 2020-2032
- 11.1. Market Analysis, Insights and Forecast - by Application
- 11.1.1. DC Voltage Source
- 11.1.2. Grid Connection
- 11.1.3. Others
- 11.2. Market Analysis, Insights and Forecast - by Types
- 11.2.1. Low Frequency Inverter
- 11.2.2. High Frequency Inverter
- 11.1. Market Analysis, Insights and Forecast - by Application
- 12. Competitive Analysis
- 12.1. Company Profiles
- 12.1.1 Enphase Energy
- 12.1.1.1. Company Overview
- 12.1.1.2. Products
- 12.1.1.3. Company Financials
- 12.1.1.4. SWOT Analysis
- 12.1.2 SolarEdge
- 12.1.2.1. Company Overview
- 12.1.2.2. Products
- 12.1.2.3. Company Financials
- 12.1.2.4. SWOT Analysis
- 12.1.3 General Electric
- 12.1.3.1. Company Overview
- 12.1.3.2. Products
- 12.1.3.3. Company Financials
- 12.1.3.4. SWOT Analysis
- 12.1.4 Siemens
- 12.1.4.1. Company Overview
- 12.1.4.2. Products
- 12.1.4.3. Company Financials
- 12.1.4.4. SWOT Analysis
- 12.1.5 SMA Solar Technology
- 12.1.5.1. Company Overview
- 12.1.5.2. Products
- 12.1.5.3. Company Financials
- 12.1.5.4. SWOT Analysis
- 12.1.6 Schneider Electric
- 12.1.6.1. Company Overview
- 12.1.6.2. Products
- 12.1.6.3. Company Financials
- 12.1.6.4. SWOT Analysis
- 12.1.7 Cyber Power Systems
- 12.1.7.1. Company Overview
- 12.1.7.2. Products
- 12.1.7.3. Company Financials
- 12.1.7.4. SWOT Analysis
- 12.1.8 OutBack Power Technologies
- 12.1.8.1. Company Overview
- 12.1.8.2. Products
- 12.1.8.3. Company Financials
- 12.1.8.4. SWOT Analysis
- 12.1.9 Luminous
- 12.1.9.1. Company Overview
- 12.1.9.2. Products
- 12.1.9.3. Company Financials
- 12.1.9.4. SWOT Analysis
- 12.1.10 Leonics
- 12.1.10.1. Company Overview
- 12.1.10.2. Products
- 12.1.10.3. Company Financials
- 12.1.10.4. SWOT Analysis
- 12.1.11 INVT
- 12.1.11.1. Company Overview
- 12.1.11.2. Products
- 12.1.11.3. Company Financials
- 12.1.11.4. SWOT Analysis
- 12.1.12 Easun Power
- 12.1.12.1. Company Overview
- 12.1.12.2. Products
- 12.1.12.3. Company Financials
- 12.1.12.4. SWOT Analysis
- 12.1.13 Alencon Systems
- 12.1.13.1. Company Overview
- 12.1.13.2. Products
- 12.1.13.3. Company Financials
- 12.1.13.4. SWOT Analysis
- 12.1.14 Fimer Group (ABB)
- 12.1.14.1. Company Overview
- 12.1.14.2. Products
- 12.1.14.3. Company Financials
- 12.1.14.4. SWOT Analysis
- 12.1.15 Sungrow
- 12.1.15.1. Company Overview
- 12.1.15.2. Products
- 12.1.15.3. Company Financials
- 12.1.15.4. SWOT Analysis
- 12.1.16 Hitachi
- 12.1.16.1. Company Overview
- 12.1.16.2. Products
- 12.1.16.3. Company Financials
- 12.1.16.4. SWOT Analysis
- 12.1.17 Huawei
- 12.1.17.1. Company Overview
- 12.1.17.2. Products
- 12.1.17.3. Company Financials
- 12.1.17.4. SWOT Analysis
- 12.1.18 TBEA
- 12.1.18.1. Company Overview
- 12.1.18.2. Products
- 12.1.18.3. Company Financials
- 12.1.18.4. SWOT Analysis
- 12.1.19 Yaskawa-Solectria Solar
- 12.1.19.1. Company Overview
- 12.1.19.2. Products
- 12.1.19.3. Company Financials
- 12.1.19.4. SWOT Analysis
- 12.1.20 Power Electronics
- 12.1.20.1. Company Overview
- 12.1.20.2. Products
- 12.1.20.3. Company Financials
- 12.1.20.4. SWOT Analysis
- 12.1.21 Fronius
- 12.1.21.1. Company Overview
- 12.1.21.2. Products
- 12.1.21.3. Company Financials
- 12.1.21.4. SWOT Analysis
- 12.1.22 TMEIC
- 12.1.22.1. Company Overview
- 12.1.22.2. Products
- 12.1.22.3. Company Financials
- 12.1.22.4. SWOT Analysis
- 12.1.23 Growatt
- 12.1.23.1. Company Overview
- 12.1.23.2. Products
- 12.1.23.3. Company Financials
- 12.1.23.4. SWOT Analysis
- 12.1.24 Tabuchi Electric
- 12.1.24.1. Company Overview
- 12.1.24.2. Products
- 12.1.24.3. Company Financials
- 12.1.24.4. SWOT Analysis
- 12.1.25 Apsystems
- 12.1.25.1. Company Overview
- 12.1.25.2. Products
- 12.1.25.3. Company Financials
- 12.1.25.4. SWOT Analysis
- 12.1.26 NEGO
- 12.1.26.1. Company Overview
- 12.1.26.2. Products
- 12.1.26.3. Company Financials
- 12.1.26.4. SWOT Analysis
- 12.1.27 Yuneng Technology
- 12.1.27.1. Company Overview
- 12.1.27.2. Products
- 12.1.27.3. Company Financials
- 12.1.27.4. SWOT Analysis
- 12.1.28 Hoymiles
- 12.1.28.1. Company Overview
- 12.1.28.2. Products
- 12.1.28.3. Company Financials
- 12.1.28.4. SWOT Analysis
- 12.1.29 Ginlong
- 12.1.29.1. Company Overview
- 12.1.29.2. Products
- 12.1.29.3. Company Financials
- 12.1.29.4. SWOT Analysis
- 12.1.30 GoodWe
- 12.1.30.1. Company Overview
- 12.1.30.2. Products
- 12.1.30.3. Company Financials
- 12.1.30.4. SWOT Analysis
- 12.1.1 Enphase Energy
- 12.2. Market Entropy
- 12.2.1 Company's Key Areas Served
- 12.2.2 Recent Developments
- 12.3. Company Market Share Analysis 2025
- 12.3.1 Top 5 Companies Market Share Analysis
- 12.3.2 Top 3 Companies Market Share Analysis
- 12.4. List of Potential Customers
- 13. Research Methodology
List of Figures
- Figure 1: Global Solar Grid-tied Inverters Revenue Breakdown (billion, %) by Region 2025 & 2033
- Figure 2: North America Solar Grid-tied Inverters Revenue (billion), by Application 2025 & 2033
- Figure 3: North America Solar Grid-tied Inverters Revenue Share (%), by Application 2025 & 2033
- Figure 4: North America Solar Grid-tied Inverters Revenue (billion), by Types 2025 & 2033
- Figure 5: North America Solar Grid-tied Inverters Revenue Share (%), by Types 2025 & 2033
- Figure 6: North America Solar Grid-tied Inverters Revenue (billion), by Country 2025 & 2033
- Figure 7: North America Solar Grid-tied Inverters Revenue Share (%), by Country 2025 & 2033
- Figure 8: South America Solar Grid-tied Inverters Revenue (billion), by Application 2025 & 2033
- Figure 9: South America Solar Grid-tied Inverters Revenue Share (%), by Application 2025 & 2033
- Figure 10: South America Solar Grid-tied Inverters Revenue (billion), by Types 2025 & 2033
- Figure 11: South America Solar Grid-tied Inverters Revenue Share (%), by Types 2025 & 2033
- Figure 12: South America Solar Grid-tied Inverters Revenue (billion), by Country 2025 & 2033
- Figure 13: South America Solar Grid-tied Inverters Revenue Share (%), by Country 2025 & 2033
- Figure 14: Europe Solar Grid-tied Inverters Revenue (billion), by Application 2025 & 2033
- Figure 15: Europe Solar Grid-tied Inverters Revenue Share (%), by Application 2025 & 2033
- Figure 16: Europe Solar Grid-tied Inverters Revenue (billion), by Types 2025 & 2033
- Figure 17: Europe Solar Grid-tied Inverters Revenue Share (%), by Types 2025 & 2033
- Figure 18: Europe Solar Grid-tied Inverters Revenue (billion), by Country 2025 & 2033
- Figure 19: Europe Solar Grid-tied Inverters Revenue Share (%), by Country 2025 & 2033
- Figure 20: Middle East & Africa Solar Grid-tied Inverters Revenue (billion), by Application 2025 & 2033
- Figure 21: Middle East & Africa Solar Grid-tied Inverters Revenue Share (%), by Application 2025 & 2033
- Figure 22: Middle East & Africa Solar Grid-tied Inverters Revenue (billion), by Types 2025 & 2033
- Figure 23: Middle East & Africa Solar Grid-tied Inverters Revenue Share (%), by Types 2025 & 2033
- Figure 24: Middle East & Africa Solar Grid-tied Inverters Revenue (billion), by Country 2025 & 2033
- Figure 25: Middle East & Africa Solar Grid-tied Inverters Revenue Share (%), by Country 2025 & 2033
- Figure 26: Asia Pacific Solar Grid-tied Inverters Revenue (billion), by Application 2025 & 2033
- Figure 27: Asia Pacific Solar Grid-tied Inverters Revenue Share (%), by Application 2025 & 2033
- Figure 28: Asia Pacific Solar Grid-tied Inverters Revenue (billion), by Types 2025 & 2033
- Figure 29: Asia Pacific Solar Grid-tied Inverters Revenue Share (%), by Types 2025 & 2033
- Figure 30: Asia Pacific Solar Grid-tied Inverters Revenue (billion), by Country 2025 & 2033
- Figure 31: Asia Pacific Solar Grid-tied Inverters Revenue Share (%), by Country 2025 & 2033
List of Tables
- Table 1: Global Solar Grid-tied Inverters Revenue billion Forecast, by Application 2020 & 2033
- Table 2: Global Solar Grid-tied Inverters Revenue billion Forecast, by Types 2020 & 2033
- Table 3: Global Solar Grid-tied Inverters Revenue billion Forecast, by Region 2020 & 2033
- Table 4: Global Solar Grid-tied Inverters Revenue billion Forecast, by Application 2020 & 2033
- Table 5: Global Solar Grid-tied Inverters Revenue billion Forecast, by Types 2020 & 2033
- Table 6: Global Solar Grid-tied Inverters Revenue billion Forecast, by Country 2020 & 2033
- Table 7: United States Solar Grid-tied Inverters Revenue (billion) Forecast, by Application 2020 & 2033
- Table 8: Canada Solar Grid-tied Inverters Revenue (billion) Forecast, by Application 2020 & 2033
- Table 9: Mexico Solar Grid-tied Inverters Revenue (billion) Forecast, by Application 2020 & 2033
- Table 10: Global Solar Grid-tied Inverters Revenue billion Forecast, by Application 2020 & 2033
- Table 11: Global Solar Grid-tied Inverters Revenue billion Forecast, by Types 2020 & 2033
- Table 12: Global Solar Grid-tied Inverters Revenue billion Forecast, by Country 2020 & 2033
- Table 13: Brazil Solar Grid-tied Inverters Revenue (billion) Forecast, by Application 2020 & 2033
- Table 14: Argentina Solar Grid-tied Inverters Revenue (billion) Forecast, by Application 2020 & 2033
- Table 15: Rest of South America Solar Grid-tied Inverters Revenue (billion) Forecast, by Application 2020 & 2033
- Table 16: Global Solar Grid-tied Inverters Revenue billion Forecast, by Application 2020 & 2033
- Table 17: Global Solar Grid-tied Inverters Revenue billion Forecast, by Types 2020 & 2033
- Table 18: Global Solar Grid-tied Inverters Revenue billion Forecast, by Country 2020 & 2033
- Table 19: United Kingdom Solar Grid-tied Inverters Revenue (billion) Forecast, by Application 2020 & 2033
- Table 20: Germany Solar Grid-tied Inverters Revenue (billion) Forecast, by Application 2020 & 2033
- Table 21: France Solar Grid-tied Inverters Revenue (billion) Forecast, by Application 2020 & 2033
- Table 22: Italy Solar Grid-tied Inverters Revenue (billion) Forecast, by Application 2020 & 2033
- Table 23: Spain Solar Grid-tied Inverters Revenue (billion) Forecast, by Application 2020 & 2033
- Table 24: Russia Solar Grid-tied Inverters Revenue (billion) Forecast, by Application 2020 & 2033
- Table 25: Benelux Solar Grid-tied Inverters Revenue (billion) Forecast, by Application 2020 & 2033
- Table 26: Nordics Solar Grid-tied Inverters Revenue (billion) Forecast, by Application 2020 & 2033
- Table 27: Rest of Europe Solar Grid-tied Inverters Revenue (billion) Forecast, by Application 2020 & 2033
- Table 28: Global Solar Grid-tied Inverters Revenue billion Forecast, by Application 2020 & 2033
- Table 29: Global Solar Grid-tied Inverters Revenue billion Forecast, by Types 2020 & 2033
- Table 30: Global Solar Grid-tied Inverters Revenue billion Forecast, by Country 2020 & 2033
- Table 31: Turkey Solar Grid-tied Inverters Revenue (billion) Forecast, by Application 2020 & 2033
- Table 32: Israel Solar Grid-tied Inverters Revenue (billion) Forecast, by Application 2020 & 2033
- Table 33: GCC Solar Grid-tied Inverters Revenue (billion) Forecast, by Application 2020 & 2033
- Table 34: North Africa Solar Grid-tied Inverters Revenue (billion) Forecast, by Application 2020 & 2033
- Table 35: South Africa Solar Grid-tied Inverters Revenue (billion) Forecast, by Application 2020 & 2033
- Table 36: Rest of Middle East & Africa Solar Grid-tied Inverters Revenue (billion) Forecast, by Application 2020 & 2033
- Table 37: Global Solar Grid-tied Inverters Revenue billion Forecast, by Application 2020 & 2033
- Table 38: Global Solar Grid-tied Inverters Revenue billion Forecast, by Types 2020 & 2033
- Table 39: Global Solar Grid-tied Inverters Revenue billion Forecast, by Country 2020 & 2033
- Table 40: China Solar Grid-tied Inverters Revenue (billion) Forecast, by Application 2020 & 2033
- Table 41: India Solar Grid-tied Inverters Revenue (billion) Forecast, by Application 2020 & 2033
- Table 42: Japan Solar Grid-tied Inverters Revenue (billion) Forecast, by Application 2020 & 2033
- Table 43: South Korea Solar Grid-tied Inverters Revenue (billion) Forecast, by Application 2020 & 2033
- Table 44: ASEAN Solar Grid-tied Inverters Revenue (billion) Forecast, by Application 2020 & 2033
- Table 45: Oceania Solar Grid-tied Inverters Revenue (billion) Forecast, by Application 2020 & 2033
- Table 46: Rest of Asia Pacific Solar Grid-tied Inverters Revenue (billion) Forecast, by Application 2020 & 2033
Frequently Asked Questions
1. What is the projected Compound Annual Growth Rate (CAGR) of the Solar Grid-tied Inverters?
The projected CAGR is approximately 7.4%.
2. Which companies are prominent players in the Solar Grid-tied Inverters?
Key companies in the market include Enphase Energy, SolarEdge, General Electric, Siemens, SMA Solar Technology, Schneider Electric, Cyber Power Systems, OutBack Power Technologies, Luminous, Leonics, INVT, Easun Power, Alencon Systems, Fimer Group (ABB), Sungrow, Hitachi, Huawei, TBEA, Yaskawa-Solectria Solar, Power Electronics, Fronius, TMEIC, Growatt, Tabuchi Electric, Apsystems, NEGO, Yuneng Technology, Hoymiles, Ginlong, GoodWe.
3. What are the main segments of the Solar Grid-tied Inverters?
The market segments include Application, Types.
4. Can you provide details about the market size?
The market size is estimated to be USD 6.29 billion as of 2022.
5. What are some drivers contributing to market growth?
N/A
6. What are the notable trends driving market growth?
N/A
7. Are there any restraints impacting market growth?
N/A
8. Can you provide examples of recent developments in the market?
N/A
9. What pricing options are available for accessing the report?
Pricing options include single-user, multi-user, and enterprise licenses priced at USD 4900.00, USD 7350.00, and USD 9800.00 respectively.
10. Is the market size provided in terms of value or volume?
The market size is provided in terms of value, measured in billion.
11. Are there any specific market keywords associated with the report?
Yes, the market keyword associated with the report is "Solar Grid-tied Inverters," which aids in identifying and referencing the specific market segment covered.
12. How do I determine which pricing option suits my needs best?
The pricing options vary based on user requirements and access needs. Individual users may opt for single-user licenses, while businesses requiring broader access may choose multi-user or enterprise licenses for cost-effective access to the report.
13. Are there any additional resources or data provided in the Solar Grid-tied Inverters report?
While the report offers comprehensive insights, it's advisable to review the specific contents or supplementary materials provided to ascertain if additional resources or data are available.
14. How can I stay updated on further developments or reports in the Solar Grid-tied Inverters?
To stay informed about further developments, trends, and reports in the Solar Grid-tied Inverters, consider subscribing to industry newsletters, following relevant companies and organizations, or regularly checking reputable industry news sources and publications.
Methodology
Step 1 - Identification of Relevant Samples Size from Population Database



Step 2 - Approaches for Defining Global Market Size (Value, Volume* & Price*)

Note*: In applicable scenarios
Step 3 - Data Sources
Primary Research
- Web Analytics
- Survey Reports
- Research Institute
- Latest Research Reports
- Opinion Leaders
Secondary Research
- Annual Reports
- White Paper
- Latest Press Release
- Industry Association
- Paid Database
- Investor Presentations

Step 4 - Data Triangulation
Involves using different sources of information in order to increase the validity of a study
These sources are likely to be stakeholders in a program - participants, other researchers, program staff, other community members, and so on.
Then we put all data in single framework & apply various statistical tools to find out the dynamic on the market.
During the analysis stage, feedback from the stakeholder groups would be compared to determine areas of agreement as well as areas of divergence