

Key Insights
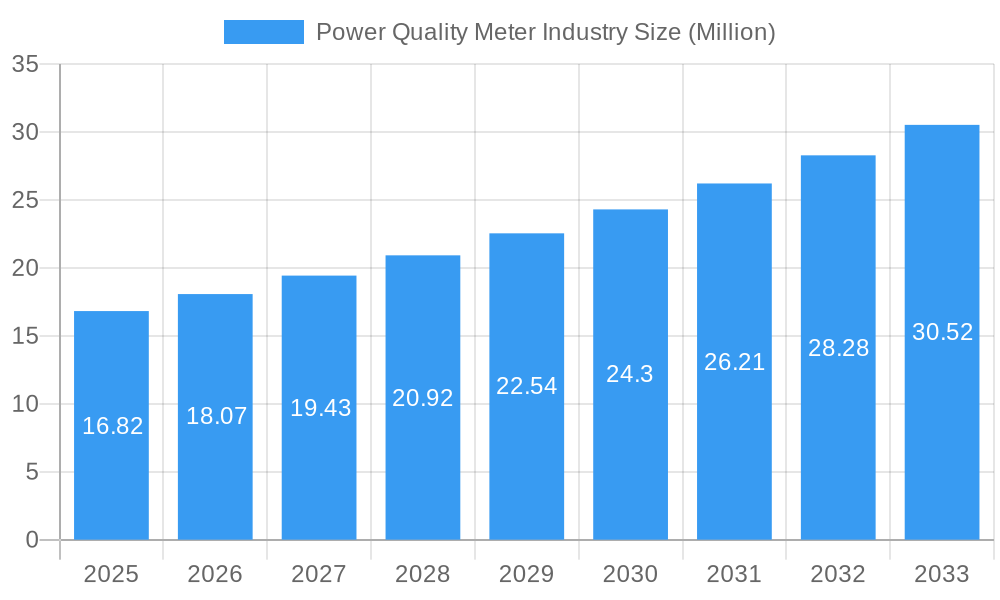
The Power Quality Meter market, valued at $16.82 million in 2025, is projected to experience robust growth, exhibiting a Compound Annual Growth Rate (CAGR) of 7.40% from 2025 to 2033. This expansion is driven by several key factors. Increasing industrial automation and the rising adoption of smart grids are creating a greater need for precise and reliable power monitoring. Businesses are increasingly prioritizing power quality to prevent costly equipment downtime and production losses, fueling demand for sophisticated power quality meters. Furthermore, stringent government regulations aimed at improving grid stability and energy efficiency are mandating the implementation of advanced power monitoring solutions across various sectors. The market is segmented by equipment type (UPS, harmonic filters, etc.), phase (single and three-phase), and end-users (industrial, commercial, etc.), offering diverse growth opportunities. North America and Europe currently hold significant market share, driven by mature infrastructure and high technological adoption. However, the Asia-Pacific region is anticipated to witness substantial growth in the coming years due to rapid industrialization and urbanization. Competition in this market is intense, with key players such as Active Power Inc, Hitachi Energy Ltd, and Schneider Electric SE continuously innovating and expanding their product portfolios to meet evolving customer needs and maintain a strong market presence.
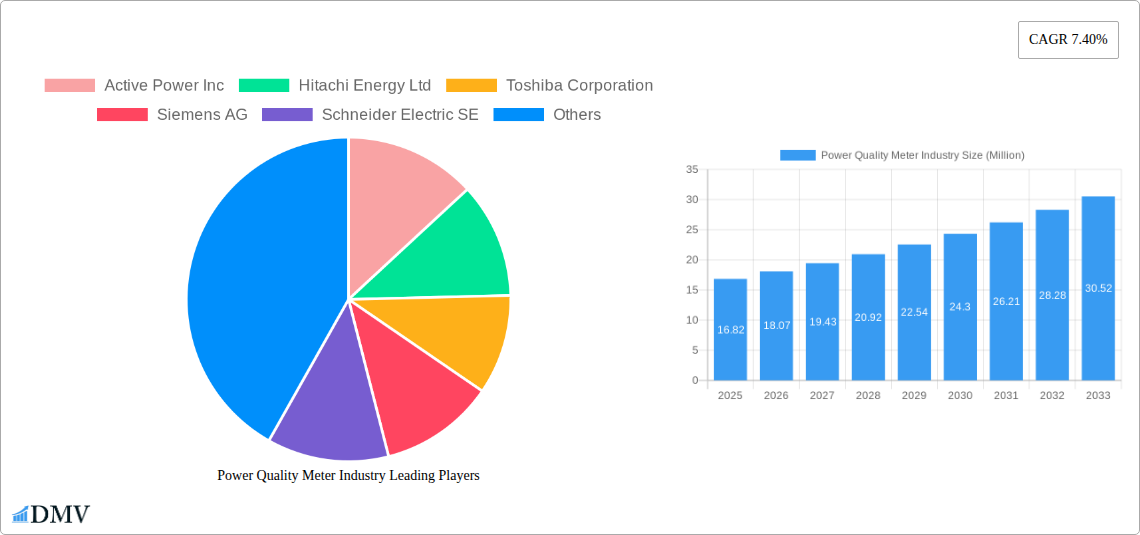
Power Quality Meter Industry Market Size (In Million)
The market's growth trajectory is expected to be influenced by several trends. The integration of IoT and advanced analytics into power quality meters allows for predictive maintenance and improved operational efficiency, boosting demand. Miniaturization and cost reduction of these meters are making them accessible to a wider range of businesses, further expanding the market's reach. However, challenges remain, including the high initial investment cost associated with implementing power quality monitoring systems which might restrain growth in certain segments. Despite this, the long-term benefits of improved power quality, including reduced energy costs and operational disruptions, are expected to outweigh these initial costs, ensuring continued market growth throughout the forecast period.
Power Quality Meter Industry Company Market Share
Power Quality Meter Industry Market Report: 2019-2033
This comprehensive report provides an in-depth analysis of the Power Quality Meter industry, offering invaluable insights for stakeholders seeking to navigate this dynamic market. The report covers the period from 2019 to 2033, with a focus on the 2025-2033 forecast period. The market is valued at xx Million in 2025 and is projected to reach xx Million by 2033, exhibiting a robust Compound Annual Growth Rate (CAGR). Key players such as Active Power Inc, Hitachi Energy Ltd, Toshiba Corporation, Siemens AG, Schneider Electric SE, EATON Corporation Plc, MTE Corporation, General Electric Company, Schaffner, and Emerson Electric Company are profiled, revealing their market strategies and competitive landscapes.
Power Quality Meter Industry Market Composition & Trends
This section dissects the intricate structure of the Power Quality Meter market, examining its concentration, innovation drivers, regulatory environment, substitute products, end-user profiles, and mergers and acquisitions (M&A) activities. The market exhibits a moderately concentrated structure, with the top 5 players holding an estimated xx% market share in 2025.
- Market Concentration: Top 5 players hold xx% market share in 2025.
- Innovation Catalysts: Advancements in sensor technology, data analytics, and IoT integration are driving innovation.
- Regulatory Landscape: Stringent regulations regarding grid stability and energy efficiency are shaping market growth. The recent "smart grids" initiative in Germany significantly impacts market demand.
- Substitute Products: Limited viable substitutes exist, fostering market growth.
- End-User Profiles: Industrial and manufacturing sectors represent the largest end-user segment, followed by the commercial sector.
- M&A Activities: The total value of M&A deals in the Power Quality Meter industry between 2019 and 2024 is estimated at xx Million. This activity is driven by companies' efforts to expand their product portfolios and market reach.
Power Quality Meter Industry Industry Evolution
The Power Quality Meter industry has witnessed significant growth and transformation over the past few years. The market is experiencing a steady rise driven by increased demand for reliable power supply, stringent environmental regulations, and the growing adoption of smart grids. The historical period (2019-2024) saw a CAGR of xx%, while the forecast period (2025-2033) projects a CAGR of xx%. This growth is largely attributed to technological advancements such as the development of more accurate and efficient power quality meters, the integration of advanced analytics capabilities, and the increasing use of cloud-based platforms for data management and analysis. The shift towards renewable energy sources and the increasing adoption of energy-efficient technologies further bolster the market’s growth trajectory. Consumer demands are shifting towards more sophisticated and feature-rich meters, pushing vendors to continually improve product offerings. The adoption rate of smart meters is increasing steadily, particularly in regions with proactive government policies supporting grid modernization.
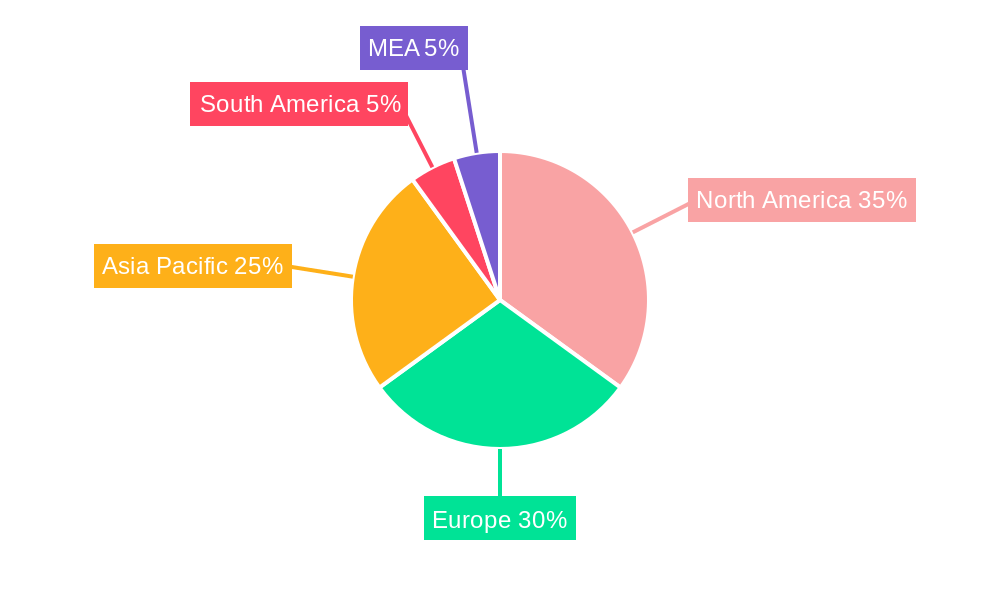
Leading Regions, Countries, or Segments in Power Quality Meter Industry
North America and Europe currently dominate the Power Quality Meter market, driven by robust industrial infrastructure and stringent environmental regulations. However, Asia-Pacific is projected to experience the fastest growth, fueled by rapid industrialization and increasing investments in renewable energy.
Key Drivers:
- North America: Stringent energy efficiency standards, high industrial automation, and significant investments in grid modernization are driving market growth.
- Europe: The implementation of smart grids initiatives and expanding renewable energy deployment are key growth catalysts. Germany's "smart grids" legislation mandates a significant increase in smart meter installations.
- Asia-Pacific: Rapid industrialization and economic development are fueling demand, particularly in China and India.
- Equipment Segment: Power Quality Meters represent the largest segment, followed by UPS systems.
- Phase Segment: Three-phase meters dominate due to their wider application in industrial settings.
- End-User Segment: The industrial and manufacturing sector remains the primary driver of growth, owing to its critical need for uninterrupted and reliable power supply.
Power Quality Meter Industry Product Innovations
Recent innovations include the integration of advanced communication protocols (e.g., IoT) for remote monitoring and control, enhanced data analytics capabilities for predictive maintenance, and the development of more compact and energy-efficient devices. These innovations offer unique selling propositions such as improved accuracy, reduced operational costs, and enhanced grid management capabilities. The use of AI and machine learning is emerging as a key differentiator, enabling more sophisticated data analysis and predictive maintenance.
Propelling Factors for Power Quality Meter Industry Growth
The growth of the Power Quality Meter industry is driven by a confluence of factors, including the increasing demand for reliable power, stringent government regulations promoting energy efficiency and grid stability, and technological advancements in metering and data analytics. The shift towards smart grids and renewable energy integration further bolsters market expansion.
Obstacles in the Power Quality Meter Industry Market
Despite the positive growth outlook, several obstacles hinder market expansion. These include the high initial investment cost of implementing smart metering infrastructure, supply chain disruptions impacting the availability of key components, and intense competition among established players and emerging entrants. These challenges may result in slower than anticipated adoption rates in certain regions.
Future Opportunities in Power Quality Meter Industry
Emerging opportunities include the expansion into developing economies, the integration of advanced technologies such as AI and machine learning, and the growing demand for energy storage solutions. The development of new applications in areas like microgrids and distributed generation also offers significant growth potential.
Major Players in the Power Quality Meter Industry Ecosystem
Key Developments in Power Quality Meter Industry Industry
- June 2023: Germany announces plans to digitalize its grid through a new "smart grids" legal framework, mandating significant smart meter rollouts by 2025 and 2028. This significantly boosts demand for Power Quality Meters.
- March 2023: GE opens the 300-megawatt Biblis Grid Stability Power Plant, enhancing grid stability and indirectly increasing the demand for advanced power monitoring solutions, including Power Quality Meters.
Strategic Power Quality Meter Industry Market Forecast
The Power Quality Meter industry is poised for continued growth, driven by the increasing adoption of smart grids, the growing demand for reliable power, and the expanding renewable energy sector. Technological innovations and government initiatives supporting grid modernization will further fuel market expansion over the forecast period, resulting in significant market potential.
Power Quality Meter Industry Segmentation
-
1. Equipment
- 1.1. Uninterruptable Power Supply (UPS)
- 1.2. Harmonic Filters
- 1.3. Static VAR Compensator
- 1.4. Power Quality Meters
- 1.5. Other Equipment Types
-
2. Phase
- 2.1. Single Phase
- 2.2. Three Phase
-
3. End-Users
- 3.1. Industrial and Manufacturing
- 3.2. Commercial
- 3.3. Others End-Users
Power Quality Meter Industry Segmentation By Geography
-
1. North America
- 1.1. United States
- 1.2. Canada
- 1.3. Rest of North America
-
2. Europe
- 2.1. Germany
- 2.2. France
- 2.3. United Kingdom
- 2.4. Italy
- 2.5. Rest of Europe
-
3. Asia Pacific
- 3.1. China
- 3.2. India
- 3.3. Japan
- 3.4. Australia
- 3.5. Rest of Asia Pacific
-
4. South America
- 4.1. Brazil
- 4.2. Argentina
- 4.3. Chile
- 4.4. Rest of South America
-
5. Middle East and Africa
- 5.1. United Arab Emirates
- 5.2. Qatar
- 5.3. Saudi Arabia
- 5.4. South Africa
- 5.5. Egypt
- 5.6. Rest of Middle East and Africa
Power Quality Meter Industry Regional Market Share
Geographic Coverage of Power Quality Meter Industry
Power Quality Meter Industry REPORT HIGHLIGHTS
| Aspects | Details |
|---|---|
| Study Period | 2020-2034 |
| Base Year | 2025 |
| Estimated Year | 2026 |
| Forecast Period | 2026-2034 |
| Historical Period | 2020-2025 |
| Growth Rate | CAGR of 7.40% from 2020-2034 |
| Segmentation |
|
Table of Contents
- 1. Introduction
- 1.1. Research Scope
- 1.2. Market Segmentation
- 1.3. Research Objective
- 1.4. Definitions and Assumptions
- 2. Executive Summary
- 2.1. Market Snapshot
- 3. Market Dynamics
- 3.1. Market Drivers
- 3.2. Market Restrains
- 3.3. Market Trends
- 3.4. Market Opportunities
- 4. Market Factor Analysis
- 4.1. Porters Five Forces
- 4.1.1. Bargaining Power of Suppliers
- 4.1.2. Bargaining Power of Buyers
- 4.1.3. Threat of New Entrants
- 4.1.4. Threat of Substitutes
- 4.1.5. Competitive Rivalry
- 4.2. PESTEL analysis
- 4.3. BCG Analysis
- 4.3.1. Stars (High Growth, High Market Share)
- 4.3.2. Cash Cows (Low Growth, High Market Share)
- 4.3.3. Question Mark (High Growth, Low Market Share)
- 4.3.4. Dogs (Low Growth, Low Market Share)
- 4.4. Ansoff Matrix Analysis
- 4.5. Supply Chain Analysis
- 4.6. Regulatory Landscape
- 4.7. Current Market Potential and Opportunity Assessment (TAM–SAM–SOM Framework)
- 4.8. DMV Analyst Note
- 4.1. Porters Five Forces
- 5. Market Analysis, Insights and Forecast 2021-2033
- 5.1. Market Analysis, Insights and Forecast - by Equipment
- 5.1.1. Uninterruptable Power Supply (UPS)
- 5.1.2. Harmonic Filters
- 5.1.3. Static VAR Compensator
- 5.1.4. Power Quality Meters
- 5.1.5. Other Equipment Types
- 5.2. Market Analysis, Insights and Forecast - by Phase
- 5.2.1. Single Phase
- 5.2.2. Three Phase
- 5.3. Market Analysis, Insights and Forecast - by End-Users
- 5.3.1. Industrial and Manufacturing
- 5.3.2. Commercial
- 5.3.3. Others End-Users
- 5.4. Market Analysis, Insights and Forecast - by Region
- 5.4.1. North America
- 5.4.2. Europe
- 5.4.3. Asia Pacific
- 5.4.4. South America
- 5.4.5. Middle East and Africa
- 5.1. Market Analysis, Insights and Forecast - by Equipment
- 6. Global Power Quality Meter Industry Analysis, Insights and Forecast, 2021-2033
- 6.1. Market Analysis, Insights and Forecast - by Equipment
- 6.1.1. Uninterruptable Power Supply (UPS)
- 6.1.2. Harmonic Filters
- 6.1.3. Static VAR Compensator
- 6.1.4. Power Quality Meters
- 6.1.5. Other Equipment Types
- 6.2. Market Analysis, Insights and Forecast - by Phase
- 6.2.1. Single Phase
- 6.2.2. Three Phase
- 6.3. Market Analysis, Insights and Forecast - by End-Users
- 6.3.1. Industrial and Manufacturing
- 6.3.2. Commercial
- 6.3.3. Others End-Users
- 6.1. Market Analysis, Insights and Forecast - by Equipment
- 7. North America Power Quality Meter Industry Analysis, Insights and Forecast, 2020-2032
- 7.1. Market Analysis, Insights and Forecast - by Equipment
- 7.1.1. Uninterruptable Power Supply (UPS)
- 7.1.2. Harmonic Filters
- 7.1.3. Static VAR Compensator
- 7.1.4. Power Quality Meters
- 7.1.5. Other Equipment Types
- 7.2. Market Analysis, Insights and Forecast - by Phase
- 7.2.1. Single Phase
- 7.2.2. Three Phase
- 7.3. Market Analysis, Insights and Forecast - by End-Users
- 7.3.1. Industrial and Manufacturing
- 7.3.2. Commercial
- 7.3.3. Others End-Users
- 7.1. Market Analysis, Insights and Forecast - by Equipment
- 8. Europe Power Quality Meter Industry Analysis, Insights and Forecast, 2020-2032
- 8.1. Market Analysis, Insights and Forecast - by Equipment
- 8.1.1. Uninterruptable Power Supply (UPS)
- 8.1.2. Harmonic Filters
- 8.1.3. Static VAR Compensator
- 8.1.4. Power Quality Meters
- 8.1.5. Other Equipment Types
- 8.2. Market Analysis, Insights and Forecast - by Phase
- 8.2.1. Single Phase
- 8.2.2. Three Phase
- 8.3. Market Analysis, Insights and Forecast - by End-Users
- 8.3.1. Industrial and Manufacturing
- 8.3.2. Commercial
- 8.3.3. Others End-Users
- 8.1. Market Analysis, Insights and Forecast - by Equipment
- 9. Asia Pacific Power Quality Meter Industry Analysis, Insights and Forecast, 2020-2032
- 9.1. Market Analysis, Insights and Forecast - by Equipment
- 9.1.1. Uninterruptable Power Supply (UPS)
- 9.1.2. Harmonic Filters
- 9.1.3. Static VAR Compensator
- 9.1.4. Power Quality Meters
- 9.1.5. Other Equipment Types
- 9.2. Market Analysis, Insights and Forecast - by Phase
- 9.2.1. Single Phase
- 9.2.2. Three Phase
- 9.3. Market Analysis, Insights and Forecast - by End-Users
- 9.3.1. Industrial and Manufacturing
- 9.3.2. Commercial
- 9.3.3. Others End-Users
- 9.1. Market Analysis, Insights and Forecast - by Equipment
- 10. South America Power Quality Meter Industry Analysis, Insights and Forecast, 2020-2032
- 10.1. Market Analysis, Insights and Forecast - by Equipment
- 10.1.1. Uninterruptable Power Supply (UPS)
- 10.1.2. Harmonic Filters
- 10.1.3. Static VAR Compensator
- 10.1.4. Power Quality Meters
- 10.1.5. Other Equipment Types
- 10.2. Market Analysis, Insights and Forecast - by Phase
- 10.2.1. Single Phase
- 10.2.2. Three Phase
- 10.3. Market Analysis, Insights and Forecast - by End-Users
- 10.3.1. Industrial and Manufacturing
- 10.3.2. Commercial
- 10.3.3. Others End-Users
- 10.1. Market Analysis, Insights and Forecast - by Equipment
- 11. Middle East and Africa Power Quality Meter Industry Analysis, Insights and Forecast, 2020-2032
- 11.1. Market Analysis, Insights and Forecast - by Equipment
- 11.1.1. Uninterruptable Power Supply (UPS)
- 11.1.2. Harmonic Filters
- 11.1.3. Static VAR Compensator
- 11.1.4. Power Quality Meters
- 11.1.5. Other Equipment Types
- 11.2. Market Analysis, Insights and Forecast - by Phase
- 11.2.1. Single Phase
- 11.2.2. Three Phase
- 11.3. Market Analysis, Insights and Forecast - by End-Users
- 11.3.1. Industrial and Manufacturing
- 11.3.2. Commercial
- 11.3.3. Others End-Users
- 11.1. Market Analysis, Insights and Forecast - by Equipment
- 12. Competitive Analysis
- 12.1. Company Profiles
- 12.1.1 Active Power Inc
- 12.1.1.1. Company Overview
- 12.1.1.2. Products
- 12.1.1.3. Company Financials
- 12.1.1.4. SWOT Analysis
- 12.1.2 Hitachi Energy Ltd
- 12.1.2.1. Company Overview
- 12.1.2.2. Products
- 12.1.2.3. Company Financials
- 12.1.2.4. SWOT Analysis
- 12.1.3 Toshiba Corporation
- 12.1.3.1. Company Overview
- 12.1.3.2. Products
- 12.1.3.3. Company Financials
- 12.1.3.4. SWOT Analysis
- 12.1.4 Siemens AG
- 12.1.4.1. Company Overview
- 12.1.4.2. Products
- 12.1.4.3. Company Financials
- 12.1.4.4. SWOT Analysis
- 12.1.5 Schneider Electric SE
- 12.1.5.1. Company Overview
- 12.1.5.2. Products
- 12.1.5.3. Company Financials
- 12.1.5.4. SWOT Analysis
- 12.1.6 EATON Corporation Plc
- 12.1.6.1. Company Overview
- 12.1.6.2. Products
- 12.1.6.3. Company Financials
- 12.1.6.4. SWOT Analysis
- 12.1.7 MTE Corporation
- 12.1.7.1. Company Overview
- 12.1.7.2. Products
- 12.1.7.3. Company Financials
- 12.1.7.4. SWOT Analysis
- 12.1.8 General Electric Company
- 12.1.8.1. Company Overview
- 12.1.8.2. Products
- 12.1.8.3. Company Financials
- 12.1.8.4. SWOT Analysis
- 12.1.9 Schaffner
- 12.1.9.1. Company Overview
- 12.1.9.2. Products
- 12.1.9.3. Company Financials
- 12.1.9.4. SWOT Analysis
- 12.1.10 Emerson Electric Company
- 12.1.10.1. Company Overview
- 12.1.10.2. Products
- 12.1.10.3. Company Financials
- 12.1.10.4. SWOT Analysis
- 12.1.1 Active Power Inc
- 12.2. Market Entropy
- 12.2.1 Company's Key Areas Served
- 12.2.2 Recent Developments
- 12.3. Company Market Share Analysis 2025
- 12.3.1 Top 5 Companies Market Share Analysis
- 12.3.2 Top 3 Companies Market Share Analysis
- 12.4. List of Potential Customers
- 13. Research Methodology
List of Figures
- Figure 1: Global Power Quality Meter Industry Revenue Breakdown (Million, %) by Region 2025 & 2033
- Figure 2: Global Power Quality Meter Industry Volume Breakdown (K Unit, %) by Region 2025 & 2033
- Figure 3: North America Power Quality Meter Industry Revenue (Million), by Equipment 2025 & 2033
- Figure 4: North America Power Quality Meter Industry Volume (K Unit), by Equipment 2025 & 2033
- Figure 5: North America Power Quality Meter Industry Revenue Share (%), by Equipment 2025 & 2033
- Figure 6: North America Power Quality Meter Industry Volume Share (%), by Equipment 2025 & 2033
- Figure 7: North America Power Quality Meter Industry Revenue (Million), by Phase 2025 & 2033
- Figure 8: North America Power Quality Meter Industry Volume (K Unit), by Phase 2025 & 2033
- Figure 9: North America Power Quality Meter Industry Revenue Share (%), by Phase 2025 & 2033
- Figure 10: North America Power Quality Meter Industry Volume Share (%), by Phase 2025 & 2033
- Figure 11: North America Power Quality Meter Industry Revenue (Million), by End-Users 2025 & 2033
- Figure 12: North America Power Quality Meter Industry Volume (K Unit), by End-Users 2025 & 2033
- Figure 13: North America Power Quality Meter Industry Revenue Share (%), by End-Users 2025 & 2033
- Figure 14: North America Power Quality Meter Industry Volume Share (%), by End-Users 2025 & 2033
- Figure 15: North America Power Quality Meter Industry Revenue (Million), by Country 2025 & 2033
- Figure 16: North America Power Quality Meter Industry Volume (K Unit), by Country 2025 & 2033
- Figure 17: North America Power Quality Meter Industry Revenue Share (%), by Country 2025 & 2033
- Figure 18: North America Power Quality Meter Industry Volume Share (%), by Country 2025 & 2033
- Figure 19: Europe Power Quality Meter Industry Revenue (Million), by Equipment 2025 & 2033
- Figure 20: Europe Power Quality Meter Industry Volume (K Unit), by Equipment 2025 & 2033
- Figure 21: Europe Power Quality Meter Industry Revenue Share (%), by Equipment 2025 & 2033
- Figure 22: Europe Power Quality Meter Industry Volume Share (%), by Equipment 2025 & 2033
- Figure 23: Europe Power Quality Meter Industry Revenue (Million), by Phase 2025 & 2033
- Figure 24: Europe Power Quality Meter Industry Volume (K Unit), by Phase 2025 & 2033
- Figure 25: Europe Power Quality Meter Industry Revenue Share (%), by Phase 2025 & 2033
- Figure 26: Europe Power Quality Meter Industry Volume Share (%), by Phase 2025 & 2033
- Figure 27: Europe Power Quality Meter Industry Revenue (Million), by End-Users 2025 & 2033
- Figure 28: Europe Power Quality Meter Industry Volume (K Unit), by End-Users 2025 & 2033
- Figure 29: Europe Power Quality Meter Industry Revenue Share (%), by End-Users 2025 & 2033
- Figure 30: Europe Power Quality Meter Industry Volume Share (%), by End-Users 2025 & 2033
- Figure 31: Europe Power Quality Meter Industry Revenue (Million), by Country 2025 & 2033
- Figure 32: Europe Power Quality Meter Industry Volume (K Unit), by Country 2025 & 2033
- Figure 33: Europe Power Quality Meter Industry Revenue Share (%), by Country 2025 & 2033
- Figure 34: Europe Power Quality Meter Industry Volume Share (%), by Country 2025 & 2033
- Figure 35: Asia Pacific Power Quality Meter Industry Revenue (Million), by Equipment 2025 & 2033
- Figure 36: Asia Pacific Power Quality Meter Industry Volume (K Unit), by Equipment 2025 & 2033
- Figure 37: Asia Pacific Power Quality Meter Industry Revenue Share (%), by Equipment 2025 & 2033
- Figure 38: Asia Pacific Power Quality Meter Industry Volume Share (%), by Equipment 2025 & 2033
- Figure 39: Asia Pacific Power Quality Meter Industry Revenue (Million), by Phase 2025 & 2033
- Figure 40: Asia Pacific Power Quality Meter Industry Volume (K Unit), by Phase 2025 & 2033
- Figure 41: Asia Pacific Power Quality Meter Industry Revenue Share (%), by Phase 2025 & 2033
- Figure 42: Asia Pacific Power Quality Meter Industry Volume Share (%), by Phase 2025 & 2033
- Figure 43: Asia Pacific Power Quality Meter Industry Revenue (Million), by End-Users 2025 & 2033
- Figure 44: Asia Pacific Power Quality Meter Industry Volume (K Unit), by End-Users 2025 & 2033
- Figure 45: Asia Pacific Power Quality Meter Industry Revenue Share (%), by End-Users 2025 & 2033
- Figure 46: Asia Pacific Power Quality Meter Industry Volume Share (%), by End-Users 2025 & 2033
- Figure 47: Asia Pacific Power Quality Meter Industry Revenue (Million), by Country 2025 & 2033
- Figure 48: Asia Pacific Power Quality Meter Industry Volume (K Unit), by Country 2025 & 2033
- Figure 49: Asia Pacific Power Quality Meter Industry Revenue Share (%), by Country 2025 & 2033
- Figure 50: Asia Pacific Power Quality Meter Industry Volume Share (%), by Country 2025 & 2033
- Figure 51: South America Power Quality Meter Industry Revenue (Million), by Equipment 2025 & 2033
- Figure 52: South America Power Quality Meter Industry Volume (K Unit), by Equipment 2025 & 2033
- Figure 53: South America Power Quality Meter Industry Revenue Share (%), by Equipment 2025 & 2033
- Figure 54: South America Power Quality Meter Industry Volume Share (%), by Equipment 2025 & 2033
- Figure 55: South America Power Quality Meter Industry Revenue (Million), by Phase 2025 & 2033
- Figure 56: South America Power Quality Meter Industry Volume (K Unit), by Phase 2025 & 2033
- Figure 57: South America Power Quality Meter Industry Revenue Share (%), by Phase 2025 & 2033
- Figure 58: South America Power Quality Meter Industry Volume Share (%), by Phase 2025 & 2033
- Figure 59: South America Power Quality Meter Industry Revenue (Million), by End-Users 2025 & 2033
- Figure 60: South America Power Quality Meter Industry Volume (K Unit), by End-Users 2025 & 2033
- Figure 61: South America Power Quality Meter Industry Revenue Share (%), by End-Users 2025 & 2033
- Figure 62: South America Power Quality Meter Industry Volume Share (%), by End-Users 2025 & 2033
- Figure 63: South America Power Quality Meter Industry Revenue (Million), by Country 2025 & 2033
- Figure 64: South America Power Quality Meter Industry Volume (K Unit), by Country 2025 & 2033
- Figure 65: South America Power Quality Meter Industry Revenue Share (%), by Country 2025 & 2033
- Figure 66: South America Power Quality Meter Industry Volume Share (%), by Country 2025 & 2033
- Figure 67: Middle East and Africa Power Quality Meter Industry Revenue (Million), by Equipment 2025 & 2033
- Figure 68: Middle East and Africa Power Quality Meter Industry Volume (K Unit), by Equipment 2025 & 2033
- Figure 69: Middle East and Africa Power Quality Meter Industry Revenue Share (%), by Equipment 2025 & 2033
- Figure 70: Middle East and Africa Power Quality Meter Industry Volume Share (%), by Equipment 2025 & 2033
- Figure 71: Middle East and Africa Power Quality Meter Industry Revenue (Million), by Phase 2025 & 2033
- Figure 72: Middle East and Africa Power Quality Meter Industry Volume (K Unit), by Phase 2025 & 2033
- Figure 73: Middle East and Africa Power Quality Meter Industry Revenue Share (%), by Phase 2025 & 2033
- Figure 74: Middle East and Africa Power Quality Meter Industry Volume Share (%), by Phase 2025 & 2033
- Figure 75: Middle East and Africa Power Quality Meter Industry Revenue (Million), by End-Users 2025 & 2033
- Figure 76: Middle East and Africa Power Quality Meter Industry Volume (K Unit), by End-Users 2025 & 2033
- Figure 77: Middle East and Africa Power Quality Meter Industry Revenue Share (%), by End-Users 2025 & 2033
- Figure 78: Middle East and Africa Power Quality Meter Industry Volume Share (%), by End-Users 2025 & 2033
- Figure 79: Middle East and Africa Power Quality Meter Industry Revenue (Million), by Country 2025 & 2033
- Figure 80: Middle East and Africa Power Quality Meter Industry Volume (K Unit), by Country 2025 & 2033
- Figure 81: Middle East and Africa Power Quality Meter Industry Revenue Share (%), by Country 2025 & 2033
- Figure 82: Middle East and Africa Power Quality Meter Industry Volume Share (%), by Country 2025 & 2033
List of Tables
- Table 1: Global Power Quality Meter Industry Revenue Million Forecast, by Equipment 2020 & 2033
- Table 2: Global Power Quality Meter Industry Volume K Unit Forecast, by Equipment 2020 & 2033
- Table 3: Global Power Quality Meter Industry Revenue Million Forecast, by Phase 2020 & 2033
- Table 4: Global Power Quality Meter Industry Volume K Unit Forecast, by Phase 2020 & 2033
- Table 5: Global Power Quality Meter Industry Revenue Million Forecast, by End-Users 2020 & 2033
- Table 6: Global Power Quality Meter Industry Volume K Unit Forecast, by End-Users 2020 & 2033
- Table 7: Global Power Quality Meter Industry Revenue Million Forecast, by Region 2020 & 2033
- Table 8: Global Power Quality Meter Industry Volume K Unit Forecast, by Region 2020 & 2033
- Table 9: Global Power Quality Meter Industry Revenue Million Forecast, by Equipment 2020 & 2033
- Table 10: Global Power Quality Meter Industry Volume K Unit Forecast, by Equipment 2020 & 2033
- Table 11: Global Power Quality Meter Industry Revenue Million Forecast, by Phase 2020 & 2033
- Table 12: Global Power Quality Meter Industry Volume K Unit Forecast, by Phase 2020 & 2033
- Table 13: Global Power Quality Meter Industry Revenue Million Forecast, by End-Users 2020 & 2033
- Table 14: Global Power Quality Meter Industry Volume K Unit Forecast, by End-Users 2020 & 2033
- Table 15: Global Power Quality Meter Industry Revenue Million Forecast, by Country 2020 & 2033
- Table 16: Global Power Quality Meter Industry Volume K Unit Forecast, by Country 2020 & 2033
- Table 17: United States Power Quality Meter Industry Revenue (Million) Forecast, by Application 2020 & 2033
- Table 18: United States Power Quality Meter Industry Volume (K Unit) Forecast, by Application 2020 & 2033
- Table 19: Canada Power Quality Meter Industry Revenue (Million) Forecast, by Application 2020 & 2033
- Table 20: Canada Power Quality Meter Industry Volume (K Unit) Forecast, by Application 2020 & 2033
- Table 21: Rest of North America Power Quality Meter Industry Revenue (Million) Forecast, by Application 2020 & 2033
- Table 22: Rest of North America Power Quality Meter Industry Volume (K Unit) Forecast, by Application 2020 & 2033
- Table 23: Global Power Quality Meter Industry Revenue Million Forecast, by Equipment 2020 & 2033
- Table 24: Global Power Quality Meter Industry Volume K Unit Forecast, by Equipment 2020 & 2033
- Table 25: Global Power Quality Meter Industry Revenue Million Forecast, by Phase 2020 & 2033
- Table 26: Global Power Quality Meter Industry Volume K Unit Forecast, by Phase 2020 & 2033
- Table 27: Global Power Quality Meter Industry Revenue Million Forecast, by End-Users 2020 & 2033
- Table 28: Global Power Quality Meter Industry Volume K Unit Forecast, by End-Users 2020 & 2033
- Table 29: Global Power Quality Meter Industry Revenue Million Forecast, by Country 2020 & 2033
- Table 30: Global Power Quality Meter Industry Volume K Unit Forecast, by Country 2020 & 2033
- Table 31: Germany Power Quality Meter Industry Revenue (Million) Forecast, by Application 2020 & 2033
- Table 32: Germany Power Quality Meter Industry Volume (K Unit) Forecast, by Application 2020 & 2033
- Table 33: France Power Quality Meter Industry Revenue (Million) Forecast, by Application 2020 & 2033
- Table 34: France Power Quality Meter Industry Volume (K Unit) Forecast, by Application 2020 & 2033
- Table 35: United Kingdom Power Quality Meter Industry Revenue (Million) Forecast, by Application 2020 & 2033
- Table 36: United Kingdom Power Quality Meter Industry Volume (K Unit) Forecast, by Application 2020 & 2033
- Table 37: Italy Power Quality Meter Industry Revenue (Million) Forecast, by Application 2020 & 2033
- Table 38: Italy Power Quality Meter Industry Volume (K Unit) Forecast, by Application 2020 & 2033
- Table 39: Rest of Europe Power Quality Meter Industry Revenue (Million) Forecast, by Application 2020 & 2033
- Table 40: Rest of Europe Power Quality Meter Industry Volume (K Unit) Forecast, by Application 2020 & 2033
- Table 41: Global Power Quality Meter Industry Revenue Million Forecast, by Equipment 2020 & 2033
- Table 42: Global Power Quality Meter Industry Volume K Unit Forecast, by Equipment 2020 & 2033
- Table 43: Global Power Quality Meter Industry Revenue Million Forecast, by Phase 2020 & 2033
- Table 44: Global Power Quality Meter Industry Volume K Unit Forecast, by Phase 2020 & 2033
- Table 45: Global Power Quality Meter Industry Revenue Million Forecast, by End-Users 2020 & 2033
- Table 46: Global Power Quality Meter Industry Volume K Unit Forecast, by End-Users 2020 & 2033
- Table 47: Global Power Quality Meter Industry Revenue Million Forecast, by Country 2020 & 2033
- Table 48: Global Power Quality Meter Industry Volume K Unit Forecast, by Country 2020 & 2033
- Table 49: China Power Quality Meter Industry Revenue (Million) Forecast, by Application 2020 & 2033
- Table 50: China Power Quality Meter Industry Volume (K Unit) Forecast, by Application 2020 & 2033
- Table 51: India Power Quality Meter Industry Revenue (Million) Forecast, by Application 2020 & 2033
- Table 52: India Power Quality Meter Industry Volume (K Unit) Forecast, by Application 2020 & 2033
- Table 53: Japan Power Quality Meter Industry Revenue (Million) Forecast, by Application 2020 & 2033
- Table 54: Japan Power Quality Meter Industry Volume (K Unit) Forecast, by Application 2020 & 2033
- Table 55: Australia Power Quality Meter Industry Revenue (Million) Forecast, by Application 2020 & 2033
- Table 56: Australia Power Quality Meter Industry Volume (K Unit) Forecast, by Application 2020 & 2033
- Table 57: Rest of Asia Pacific Power Quality Meter Industry Revenue (Million) Forecast, by Application 2020 & 2033
- Table 58: Rest of Asia Pacific Power Quality Meter Industry Volume (K Unit) Forecast, by Application 2020 & 2033
- Table 59: Global Power Quality Meter Industry Revenue Million Forecast, by Equipment 2020 & 2033
- Table 60: Global Power Quality Meter Industry Volume K Unit Forecast, by Equipment 2020 & 2033
- Table 61: Global Power Quality Meter Industry Revenue Million Forecast, by Phase 2020 & 2033
- Table 62: Global Power Quality Meter Industry Volume K Unit Forecast, by Phase 2020 & 2033
- Table 63: Global Power Quality Meter Industry Revenue Million Forecast, by End-Users 2020 & 2033
- Table 64: Global Power Quality Meter Industry Volume K Unit Forecast, by End-Users 2020 & 2033
- Table 65: Global Power Quality Meter Industry Revenue Million Forecast, by Country 2020 & 2033
- Table 66: Global Power Quality Meter Industry Volume K Unit Forecast, by Country 2020 & 2033
- Table 67: Brazil Power Quality Meter Industry Revenue (Million) Forecast, by Application 2020 & 2033
- Table 68: Brazil Power Quality Meter Industry Volume (K Unit) Forecast, by Application 2020 & 2033
- Table 69: Argentina Power Quality Meter Industry Revenue (Million) Forecast, by Application 2020 & 2033
- Table 70: Argentina Power Quality Meter Industry Volume (K Unit) Forecast, by Application 2020 & 2033
- Table 71: Chile Power Quality Meter Industry Revenue (Million) Forecast, by Application 2020 & 2033
- Table 72: Chile Power Quality Meter Industry Volume (K Unit) Forecast, by Application 2020 & 2033
- Table 73: Rest of South America Power Quality Meter Industry Revenue (Million) Forecast, by Application 2020 & 2033
- Table 74: Rest of South America Power Quality Meter Industry Volume (K Unit) Forecast, by Application 2020 & 2033
- Table 75: Global Power Quality Meter Industry Revenue Million Forecast, by Equipment 2020 & 2033
- Table 76: Global Power Quality Meter Industry Volume K Unit Forecast, by Equipment 2020 & 2033
- Table 77: Global Power Quality Meter Industry Revenue Million Forecast, by Phase 2020 & 2033
- Table 78: Global Power Quality Meter Industry Volume K Unit Forecast, by Phase 2020 & 2033
- Table 79: Global Power Quality Meter Industry Revenue Million Forecast, by End-Users 2020 & 2033
- Table 80: Global Power Quality Meter Industry Volume K Unit Forecast, by End-Users 2020 & 2033
- Table 81: Global Power Quality Meter Industry Revenue Million Forecast, by Country 2020 & 2033
- Table 82: Global Power Quality Meter Industry Volume K Unit Forecast, by Country 2020 & 2033
- Table 83: United Arab Emirates Power Quality Meter Industry Revenue (Million) Forecast, by Application 2020 & 2033
- Table 84: United Arab Emirates Power Quality Meter Industry Volume (K Unit) Forecast, by Application 2020 & 2033
- Table 85: Qatar Power Quality Meter Industry Revenue (Million) Forecast, by Application 2020 & 2033
- Table 86: Qatar Power Quality Meter Industry Volume (K Unit) Forecast, by Application 2020 & 2033
- Table 87: Saudi Arabia Power Quality Meter Industry Revenue (Million) Forecast, by Application 2020 & 2033
- Table 88: Saudi Arabia Power Quality Meter Industry Volume (K Unit) Forecast, by Application 2020 & 2033
- Table 89: South Africa Power Quality Meter Industry Revenue (Million) Forecast, by Application 2020 & 2033
- Table 90: South Africa Power Quality Meter Industry Volume (K Unit) Forecast, by Application 2020 & 2033
- Table 91: Egypt Power Quality Meter Industry Revenue (Million) Forecast, by Application 2020 & 2033
- Table 92: Egypt Power Quality Meter Industry Volume (K Unit) Forecast, by Application 2020 & 2033
- Table 93: Rest of Middle East and Africa Power Quality Meter Industry Revenue (Million) Forecast, by Application 2020 & 2033
- Table 94: Rest of Middle East and Africa Power Quality Meter Industry Volume (K Unit) Forecast, by Application 2020 & 2033
Frequently Asked Questions
1. What is the projected Compound Annual Growth Rate (CAGR) of the Power Quality Meter Industry?
The projected CAGR is approximately 7.40%.
2. Which companies are prominent players in the Power Quality Meter Industry?
Key companies in the market include Active Power Inc, Hitachi Energy Ltd, Toshiba Corporation, Siemens AG, Schneider Electric SE, EATON Corporation Plc, MTE Corporation, General Electric Company, Schaffner, Emerson Electric Company.
3. What are the main segments of the Power Quality Meter Industry?
The market segments include Equipment, Phase, End-Users.
4. Can you provide details about the market size?
The market size is estimated to be USD 16.82 Million as of 2022.
5. What are some drivers contributing to market growth?
4.; Increasing Demand For Power Quality In Industrial And Manufacturing Sectors4.; Increase In Smart Grid Infrastructure.
6. What are the notable trends driving market growth?
Industrial and Manufacturing Segment to Dominate the Market.
7. Are there any restraints impacting market growth?
4.; High Costs Of Power Quality Equipment.
8. Can you provide examples of recent developments in the market?
In June 2023, Germany’s Government announced plans to digitalise its grid, notably at the low-voltage or distribution level, through a new “smart grids” legal framework. The Metering Point Operation Act mandates a 20% roll-out of smart meters by the end of 2025 and 50% by the end of 2028.
9. What pricing options are available for accessing the report?
Pricing options include single-user, multi-user, and enterprise licenses priced at USD 4750, USD 5250, and USD 8750 respectively.
10. Is the market size provided in terms of value or volume?
The market size is provided in terms of value, measured in Million and volume, measured in K Unit.
11. Are there any specific market keywords associated with the report?
Yes, the market keyword associated with the report is "Power Quality Meter Industry," which aids in identifying and referencing the specific market segment covered.
12. How do I determine which pricing option suits my needs best?
The pricing options vary based on user requirements and access needs. Individual users may opt for single-user licenses, while businesses requiring broader access may choose multi-user or enterprise licenses for cost-effective access to the report.
13. Are there any additional resources or data provided in the Power Quality Meter Industry report?
While the report offers comprehensive insights, it's advisable to review the specific contents or supplementary materials provided to ascertain if additional resources or data are available.
14. How can I stay updated on further developments or reports in the Power Quality Meter Industry?
To stay informed about further developments, trends, and reports in the Power Quality Meter Industry, consider subscribing to industry newsletters, following relevant companies and organizations, or regularly checking reputable industry news sources and publications.
Methodology
Step 1 - Identification of Relevant Samples Size from Population Database


Step 2 - Approaches for Defining Global Market Size (Value, Volume* & Price*)

Note*: In applicable scenarios
Step 3 - Data Sources
Primary Research
- Web Analytics
- Survey Reports
- Research Institute
- Latest Research Reports
- Opinion Leaders
Secondary Research
- Annual Reports
- White Paper
- Latest Press Release
- Industry Association
- Paid Database
- Investor Presentations

Step 4 - Data Triangulation
Involves using different sources of information in order to increase the validity of a study
These sources are likely to be stakeholders in a program - participants, other researchers, program staff, other community members, and so on.
Then we put all data in single framework & apply various statistical tools to find out the dynamic on the market.
During the analysis stage, feedback from the stakeholder groups would be compared to determine areas of agreement as well as areas of divergence