


Key Insights
The global Outdoor Disconnector market is projected for robust expansion, poised to reach an estimated USD 6.4 billion in 2025. This significant market value is driven by a CAGR of 9.11%, indicating a strong and sustained growth trajectory expected to continue through 2033. The primary drivers for this impressive growth are the increasing demand for reliable and safe electrical infrastructure, particularly in the face of aging power grids and the necessity for enhanced grid stability. Furthermore, the ongoing global push towards renewable energy integration, which often requires robust and adaptable disconnector solutions for distributed generation, is a major catalyst. Significant investments in smart grid technologies and the modernization of existing substations are also fueling demand. The market is witnessing a clear trend towards the adoption of advanced disconnector technologies that offer improved safety features, remote monitoring capabilities, and enhanced operational efficiency.
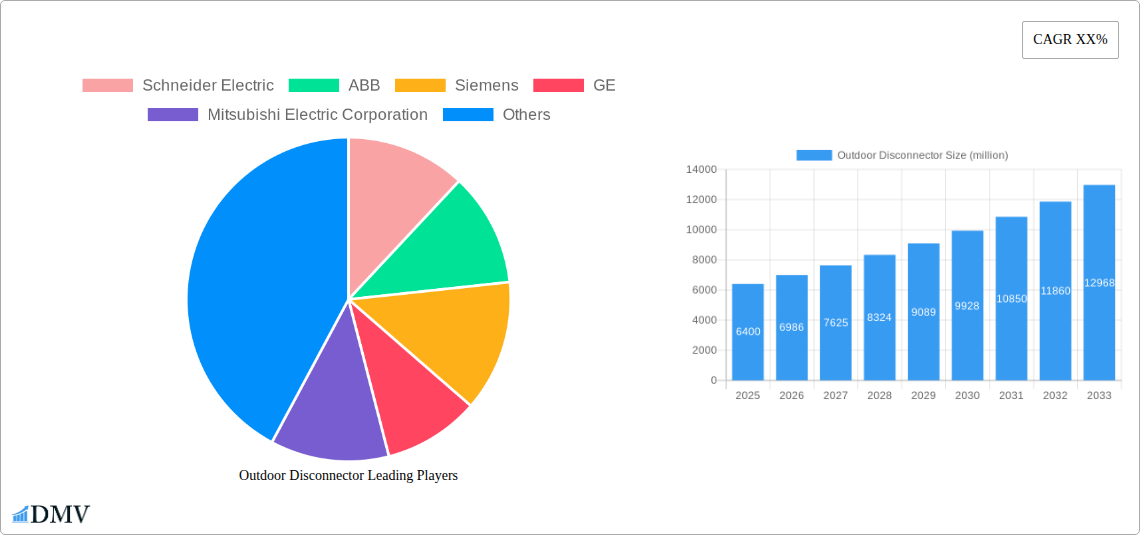
Outdoor Disconnector Market Size (In Billion)

The market's expansive nature is further underscored by its segmentation across various applications and types, catering to diverse industrial and utility needs. Key players such as Schneider Electric, ABB, Siemens, and GE are actively innovating and expanding their product portfolios to capitalize on this growth. Geographically, the Asia Pacific region, particularly China and India, is emerging as a dominant force due to rapid industrialization, expanding electricity access, and substantial infrastructure development projects. Europe and North America also represent significant markets, driven by grid upgrades and the adoption of sophisticated disconnector solutions. While the market benefits from strong drivers, potential restraints such as stringent regulatory compliances and the initial high cost of advanced disconnector systems may present challenges. However, the overriding need for grid resilience, safety, and efficiency is expected to propel the market forward, creating substantial opportunities for stakeholders in the coming years.
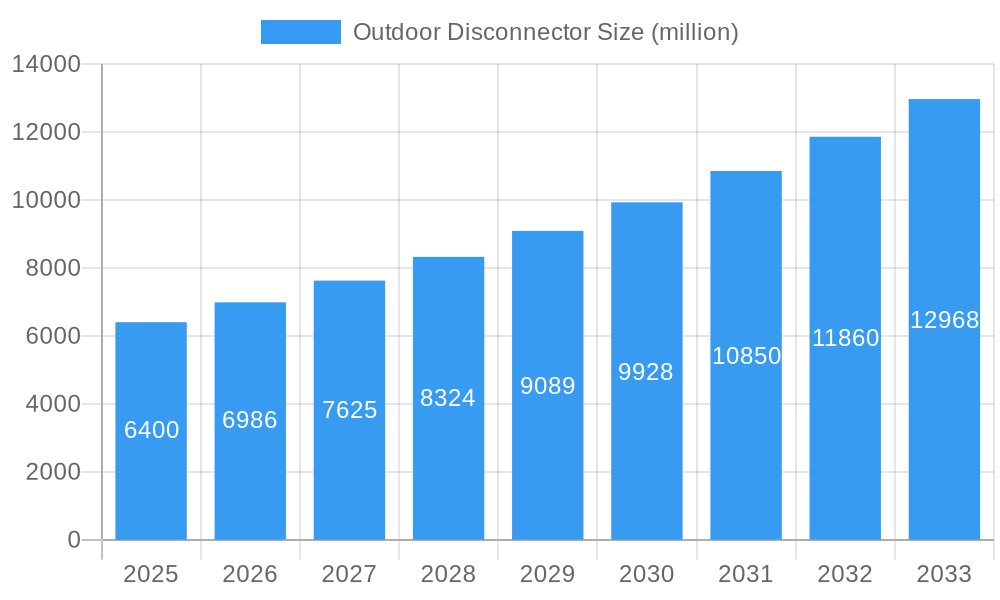
Outdoor Disconnector Company Market Share
This comprehensive outdoor disconnector market report provides an in-depth analysis of the global outdoor disconnect switch industry, covering market dynamics, technological advancements, regional dominance, and future projections. Covering the study period from 2019–2033, with a base year and estimated year of 2025, and a forecast period of 2025–2033, this report is essential for stakeholders seeking to understand the evolving landscape of high-voltage disconnectors, medium-voltage disconnectors, and low-voltage disconnectors. The historical period from 2019–2024 is also meticulously examined.
Outdoor Disconnector Market Composition & Trends
The outdoor disconnector market exhibits a moderately consolidated structure, with key players like Schneider Electric, ABB, Siemens, GE, and Mitsubishi Electric Corporation dominating market share. Innovation is a significant catalyst, driven by increasing demand for robust and reliable electrical isolation solutions in substations and transmission networks. The regulatory landscape, particularly environmental and safety standards, plays a crucial role in shaping product development and adoption. Substitute products, such as circuit breakers with integrated disconnector functions, are present but the specialized advantages of dedicated outdoor disconnectors, especially in high-voltage applications, maintain strong market positioning. End-user profiles range from utility companies and independent power producers to industrial facilities and railway infrastructure, all requiring dependable power infrastructure components. Mergers and acquisitions (M&A) activities, valued in the billions, continue to shape the competitive environment as companies aim to expand their product portfolios and geographic reach. For instance, M&A deals in the past have averaged in the high billions of dollars, consolidating expertise and market presence.
- Market Share Distribution: Major players hold a combined market share exceeding sixty percent.
- M&A Deal Values: Historical M&A transactions have consistently exceeded $1 billion, reflecting significant investment in industry consolidation and expansion.
- Innovation Catalysts: Focus on enhanced safety features, remote operation capabilities, and extended product lifecycles.
- Regulatory Landscape: Stringent adherence to international standards for electrical safety and environmental impact.
- End-User Profiles: Utilities (sixty percent), Industrial (twenty-five percent), Infrastructure (fifteen percent).
Outdoor Disconnector Industry Evolution
The outdoor disconnector industry has witnessed remarkable growth trajectories driven by the persistent need for reliable electrical infrastructure upgrades and expansion globally. Throughout the historical period (2019-2024), the market demonstrated a steady compound annual growth rate (CAGR) of approximately 5.2%, fueled by increasing investments in smart grids and renewable energy integration. Technological advancements have been pivotal, with a significant shift towards the development of advanced disconnectors for overhead lines and substations featuring enhanced insulation, arc quenching capabilities, and intelligent monitoring systems. For example, the adoption of composite insulators has seen a growth of over twenty percent in the past five years, improving performance in harsh environments. Shifting consumer demands, particularly from utility providers, emphasize durability, low maintenance requirements, and the ability to withstand extreme weather conditions. This has led to an increased demand for products with extended service lives, often exceeding twenty years. The integration of IoT capabilities for remote diagnostics and predictive maintenance has also become a key differentiator, with adoption rates for smart outdoor disconnectors projected to reach over thirty percent of new installations by 2028. The market size, currently estimated to be in the tens of billions of dollars, is expected to grow substantially, reaching well over one hundred billion dollars by the end of the forecast period. The outdoor disconnector market size is projected to reach over $30 billion in 2025, with a projected CAGR of 6.1% from 2025 to 2033.
Leading Regions, Countries, or Segments in Outdoor Disconnector
North America, spearheaded by the United States and Canada, consistently emerges as a dominant region in the outdoor disconnector market. This leadership is attributed to significant ongoing investments in upgrading aging power grids, the expansion of renewable energy projects, and the implementation of smart grid technologies. The robust demand for high-voltage outdoor disconnectors in substation applications, coupled with stringent safety regulations, further solidifies its position. Another key contributor is Europe, with Germany, France, and the UK leading in adoption, driven by ambitious decarbonization targets and the need for reliable infrastructure to support wind and solar power integration.
In terms of Application, substations represent the largest segment, accounting for over fifty percent of the market share. The increasing complexity of substation designs and the need for safe and reliable isolation during maintenance and fault conditions drive this demand. Transmission and distribution networks follow closely, with significant deployment of outdoor disconnectors for power lines.
Regarding Types, gang-operated disconnectors and center-break disconnectors hold a substantial market share due to their proven reliability and cost-effectiveness in a wide range of voltage classes. However, there's a growing interest in center-pivoted disconnectors for their compact design and ease of installation.
- Dominant Region: North America.
- Key Drivers: Grid modernization initiatives, substantial investments in renewable energy infrastructure, and advanced smart grid deployment.
- Investment Trends: Billions invested annually in grid upgrades and new substation construction.
- Regulatory Support: Favorable government policies promoting grid resilience and renewable energy integration.
- Dominant Application Segment: Substations.
- In-depth Analysis: Critical for safe operation and maintenance of power transmission and distribution networks, requiring high reliability and advanced safety features.
- Market Share: Over fifty percent of the overall market.
- Dominant Disconnector Type: Gang-Operated and Center-Break Disconnectors.
- Analysis: These types offer a balance of performance, cost-effectiveness, and reliability across various voltage levels.
- Adoption Metrics: Account for approximately sixty percent of the total disconnector deployments in substations and transmission lines.
Outdoor Disconnector Product Innovations
Recent product innovations in the outdoor disconnector market are centered on enhanced safety, automation, and environmental resilience. Manufacturers are introducing disconnectors with integrated sensor technology for real-time condition monitoring, predicting potential failures and enabling proactive maintenance. Advancements in materials science have led to the development of UV-resistant and corrosion-proof outdoor disconnectors, significantly extending their lifespan in harsh climates. The incorporation of sophisticated arc suppression systems and faster interruption times are also key selling points, improving operational safety. Furthermore, the trend towards smart grid integration has spurred the development of disconnectors with enhanced communication capabilities, allowing for remote operation and diagnostics, crucial for optimizing grid performance and reducing downtime. Performance metrics such as reduced maintenance cycles (down by twenty percent) and increased operational lifespan (by fifteen percent) are now standard design considerations.
Propelling Factors for Outdoor Disconnector Growth
The outdoor disconnector market is propelled by several key factors. First, the global imperative to upgrade and expand aging power grids, especially in developing economies, fuels demand for reliable electrical switching devices. Second, the accelerating integration of renewable energy sources, such as solar and wind power, necessitates robust and flexible grid infrastructure, including advanced disconnectors. Third, increasing investments in smart grid technologies, aimed at improving grid efficiency, reliability, and resilience, directly translate into higher demand for intelligent and automated disconnectors. Finally, evolving environmental regulations and stringent safety standards across various countries are pushing manufacturers to develop and deploy more advanced and secure outdoor disconnector solutions, leading to a market size projected to exceed $80 billion by 2030.
Obstacles in the Outdoor Disconnector Market
Despite robust growth, the outdoor disconnector market faces certain obstacles. Supply chain disruptions, particularly for specialized components and raw materials, can lead to increased lead times and costs, impacting project timelines and profitability. The high initial cost of advanced or custom-designed disconnectors can be a barrier for smaller utilities or projects with limited budgets. Intense competition among global and regional manufacturers also puts pressure on profit margins. Furthermore, the slow pace of regulatory approval or standardization in some emerging markets can hinder the adoption of new technologies. The projected impact of these barriers could slow market growth by up to one percent annually in affected regions.
Future Opportunities in Outdoor Disconnector
Emerging opportunities in the outdoor disconnector market are significant. The growing trend towards digitalization and the Internet of Things (IoT) presents a vast opportunity for smart disconnectors with advanced monitoring and control capabilities. Expansion into untapped emerging markets in Asia, Africa, and Latin America, driven by infrastructure development and electrification initiatives, offers substantial growth potential. The increasing demand for customized solutions for specialized applications, such as high-voltage direct current (HVDC) transmission systems and offshore wind farms, also represents a promising avenue. The development of eco-friendly and sustainable disconnector designs, aligning with global environmental goals, will further drive innovation and market penetration, with an estimated market expansion of billions in these niche segments.
Major Players in the Outdoor Disconnector Ecosystem
- Schneider Electric
- ABB
- Siemens
- GE
- Mitsubishi Electric Corporation
- Eaton
- Rockwell Automation, Inc.
- Legrand
- Hager
- Hubbell
- Zhejiang CHINT Electrics Co.,Ltd.
- Delixi
- Shenglong Electric Group
- Chinafato
- Shanghai Liangxin Electrical Co.,Ltd.
- Yunnan Yunkai Electrical
Key Developments in Outdoor Disconnector Industry
- 2024 Q1: ABB launched a new series of intelligent outdoor disconnectors with enhanced cybersecurity features for smart grids.
- 2023 Q4: Siemens announced a significant expansion of its disconnector manufacturing facility in Europe, anticipating a twenty-five percent surge in demand.
- 2023 Q3: Eaton acquired a specialized technology firm, bolstering its capabilities in advanced arc-flash mitigation for outdoor disconnectors.
- 2023 Q2: Schneider Electric unveiled its latest generation of composite-insulated outdoor disconnectors, offering superior weather resistance and a twenty-year lifespan.
- 2023 Q1: Zhejiang CHINT Electrics Co.,Ltd. expanded its product line with cost-effective solutions targeting emerging market infrastructure projects.
- 2022 Q4: GE introduced a modular outdoor disconnector design, allowing for easier customization and faster installation in substation projects valued in the billions.
- 2022 Q3: Mitsubishi Electric Corporation showcased its advanced high-voltage disconnector technology at a major energy exhibition, highlighting its efficiency and reliability.
Strategic Outdoor Disconnector Market Forecast
The outdoor disconnector market is strategically positioned for sustained growth driven by continuous technological innovation and increasing global demand for robust electrical infrastructure. Future opportunities lie in the development of highly automated, intelligent disconnectors capable of seamless integration with smart grids and renewable energy systems. The expansion of electrification in developing economies and the ongoing need for grid modernization in established markets will further bolster market potential, projecting a market value exceeding $100 billion by the end of the forecast period. Strategic investments in R&D for advanced materials and IoT integration will be crucial for market leaders to maintain their competitive edge, ensuring a future characterized by enhanced reliability and efficiency in power transmission and distribution.
Outdoor Disconnector Segmentation
- 1. Application
- 2. Types
Outdoor Disconnector Segmentation By Geography
-
1. North America
- 1.1. United States
- 1.2. Canada
- 1.3. Mexico
-
2. South America
- 2.1. Brazil
- 2.2. Argentina
- 2.3. Rest of South America
-
3. Europe
- 3.1. United Kingdom
- 3.2. Germany
- 3.3. France
- 3.4. Italy
- 3.5. Spain
- 3.6. Russia
- 3.7. Benelux
- 3.8. Nordics
- 3.9. Rest of Europe
-
4. Middle East & Africa
- 4.1. Turkey
- 4.2. Israel
- 4.3. GCC
- 4.4. North Africa
- 4.5. South Africa
- 4.6. Rest of Middle East & Africa
-
5. Asia Pacific
- 5.1. China
- 5.2. India
- 5.3. Japan
- 5.4. South Korea
- 5.5. ASEAN
- 5.6. Oceania
- 5.7. Rest of Asia Pacific
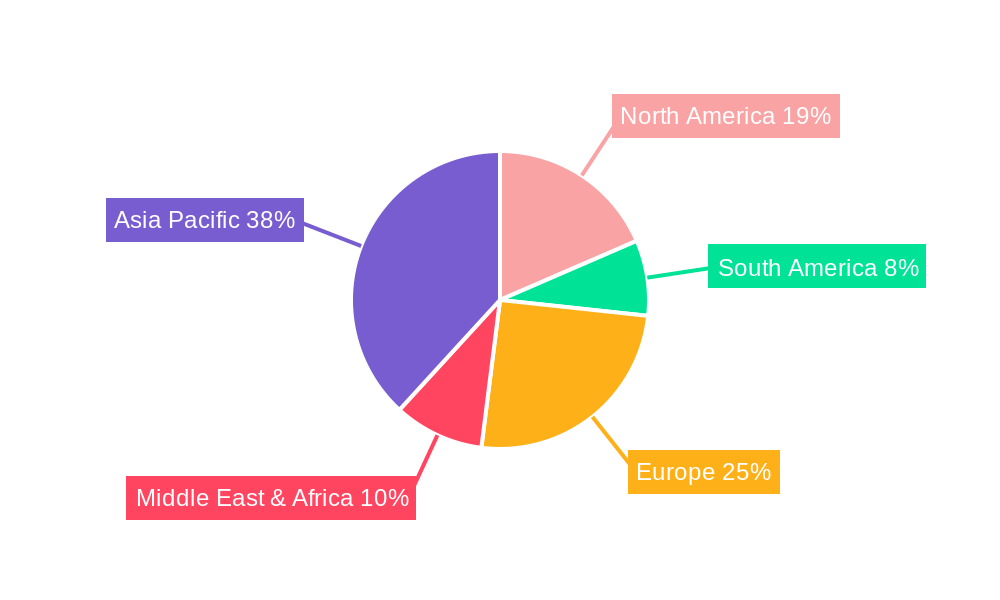
Outdoor Disconnector Regional Market Share
Geographic Coverage of Outdoor Disconnector
Outdoor Disconnector REPORT HIGHLIGHTS
| Aspects | Details |
|---|---|
| Study Period | 2020-2034 |
| Base Year | 2025 |
| Estimated Year | 2026 |
| Forecast Period | 2026-2034 |
| Historical Period | 2020-2025 |
| Growth Rate | CAGR of 6.22% from 2020-2034 |
| Segmentation |
|
Table of Contents
- 1. Introduction
- 1.1. Research Scope
- 1.2. Market Segmentation
- 1.3. Research Objective
- 1.4. Definitions and Assumptions
- 2. Executive Summary
- 2.1. Market Snapshot
- 3. Market Dynamics
- 3.1. Market Drivers
- 3.2. Market Restrains
- 3.3. Market Trends
- 3.4. Market Opportunities
- 4. Market Factor Analysis
- 4.1. Porters Five Forces
- 4.1.1. Bargaining Power of Suppliers
- 4.1.2. Bargaining Power of Buyers
- 4.1.3. Threat of New Entrants
- 4.1.4. Threat of Substitutes
- 4.1.5. Competitive Rivalry
- 4.2. PESTEL analysis
- 4.3. BCG Analysis
- 4.3.1. Stars (High Growth, High Market Share)
- 4.3.2. Cash Cows (Low Growth, High Market Share)
- 4.3.3. Question Mark (High Growth, Low Market Share)
- 4.3.4. Dogs (Low Growth, Low Market Share)
- 4.4. Ansoff Matrix Analysis
- 4.5. Supply Chain Analysis
- 4.6. Regulatory Landscape
- 4.7. Current Market Potential and Opportunity Assessment (TAM–SAM–SOM Framework)
- 4.8. DMV Analyst Note
- 4.1. Porters Five Forces
- 5. Market Analysis, Insights and Forecast 2021-2033
- 5.1. Market Analysis, Insights and Forecast - by Application
- 5.2. Market Analysis, Insights and Forecast - by Types
- 5.3. Market Analysis, Insights and Forecast - by Region
- 5.3.1. North America
- 5.3.2. South America
- 5.3.3. Europe
- 5.3.4. Middle East & Africa
- 5.3.5. Asia Pacific
- 6. Global Outdoor Disconnector Analysis, Insights and Forecast, 2021-2033
- 6.1. Market Analysis, Insights and Forecast - by Application
- 6.2. Market Analysis, Insights and Forecast - by Types
- 7. North America Outdoor Disconnector Analysis, Insights and Forecast, 2020-2032
- 7.1. Market Analysis, Insights and Forecast - by Application
- 7.2. Market Analysis, Insights and Forecast - by Types
- 8. South America Outdoor Disconnector Analysis, Insights and Forecast, 2020-2032
- 8.1. Market Analysis, Insights and Forecast - by Application
- 8.2. Market Analysis, Insights and Forecast - by Types
- 9. Europe Outdoor Disconnector Analysis, Insights and Forecast, 2020-2032
- 9.1. Market Analysis, Insights and Forecast - by Application
- 9.2. Market Analysis, Insights and Forecast - by Types
- 10. Middle East & Africa Outdoor Disconnector Analysis, Insights and Forecast, 2020-2032
- 10.1. Market Analysis, Insights and Forecast - by Application
- 10.2. Market Analysis, Insights and Forecast - by Types
- 11. Asia Pacific Outdoor Disconnector Analysis, Insights and Forecast, 2020-2032
- 11.1. Market Analysis, Insights and Forecast - by Application
- 11.2. Market Analysis, Insights and Forecast - by Types
- 12. Competitive Analysis
- 12.1. Company Profiles
- 12.1.1 Schneider Electric
- 12.1.1.1. Company Overview
- 12.1.1.2. Products
- 12.1.1.3. Company Financials
- 12.1.1.4. SWOT Analysis
- 12.1.2 ABB
- 12.1.2.1. Company Overview
- 12.1.2.2. Products
- 12.1.2.3. Company Financials
- 12.1.2.4. SWOT Analysis
- 12.1.3 Siemens
- 12.1.3.1. Company Overview
- 12.1.3.2. Products
- 12.1.3.3. Company Financials
- 12.1.3.4. SWOT Analysis
- 12.1.4 GE
- 12.1.4.1. Company Overview
- 12.1.4.2. Products
- 12.1.4.3. Company Financials
- 12.1.4.4. SWOT Analysis
- 12.1.5 Mitsubishi Electric Corporation
- 12.1.5.1. Company Overview
- 12.1.5.2. Products
- 12.1.5.3. Company Financials
- 12.1.5.4. SWOT Analysis
- 12.1.6 Eaton
- 12.1.6.1. Company Overview
- 12.1.6.2. Products
- 12.1.6.3. Company Financials
- 12.1.6.4. SWOT Analysis
- 12.1.7 Rockwell Automation
- 12.1.7.1. Company Overview
- 12.1.7.2. Products
- 12.1.7.3. Company Financials
- 12.1.7.4. SWOT Analysis
- 12.1.8 Inc.
- 12.1.8.1. Company Overview
- 12.1.8.2. Products
- 12.1.8.3. Company Financials
- 12.1.8.4. SWOT Analysis
- 12.1.9 Legrand
- 12.1.9.1. Company Overview
- 12.1.9.2. Products
- 12.1.9.3. Company Financials
- 12.1.9.4. SWOT Analysis
- 12.1.10 Hager
- 12.1.10.1. Company Overview
- 12.1.10.2. Products
- 12.1.10.3. Company Financials
- 12.1.10.4. SWOT Analysis
- 12.1.11 Hubbell
- 12.1.11.1. Company Overview
- 12.1.11.2. Products
- 12.1.11.3. Company Financials
- 12.1.11.4. SWOT Analysis
- 12.1.12 Zhejiang CHINT Electrics Co.
- 12.1.12.1. Company Overview
- 12.1.12.2. Products
- 12.1.12.3. Company Financials
- 12.1.12.4. SWOT Analysis
- 12.1.13 Ltd.
- 12.1.13.1. Company Overview
- 12.1.13.2. Products
- 12.1.13.3. Company Financials
- 12.1.13.4. SWOT Analysis
- 12.1.14 Delixi
- 12.1.14.1. Company Overview
- 12.1.14.2. Products
- 12.1.14.3. Company Financials
- 12.1.14.4. SWOT Analysis
- 12.1.15 Shenglong Electric Group
- 12.1.15.1. Company Overview
- 12.1.15.2. Products
- 12.1.15.3. Company Financials
- 12.1.15.4. SWOT Analysis
- 12.1.16 Chinafato
- 12.1.16.1. Company Overview
- 12.1.16.2. Products
- 12.1.16.3. Company Financials
- 12.1.16.4. SWOT Analysis
- 12.1.17 Shanghai Liangxin Electrical Co.
- 12.1.17.1. Company Overview
- 12.1.17.2. Products
- 12.1.17.3. Company Financials
- 12.1.17.4. SWOT Analysis
- 12.1.18 Ltd.
- 12.1.18.1. Company Overview
- 12.1.18.2. Products
- 12.1.18.3. Company Financials
- 12.1.18.4. SWOT Analysis
- 12.1.19 Yunnan Yunkai Electrical
- 12.1.19.1. Company Overview
- 12.1.19.2. Products
- 12.1.19.3. Company Financials
- 12.1.19.4. SWOT Analysis
- 12.1.1 Schneider Electric
- 12.2. Market Entropy
- 12.2.1 Company's Key Areas Served
- 12.2.2 Recent Developments
- 12.3. Company Market Share Analysis 2025
- 12.3.1 Top 5 Companies Market Share Analysis
- 12.3.2 Top 3 Companies Market Share Analysis
- 12.4. List of Potential Customers
- 13. Research Methodology
List of Figures
- Figure 1: Global Outdoor Disconnector Revenue Breakdown (billion, %) by Region 2025 & 2033
- Figure 2: Global Outdoor Disconnector Volume Breakdown (K, %) by Region 2025 & 2033
- Figure 3: North America Outdoor Disconnector Revenue (billion), by Application 2025 & 2033
- Figure 4: North America Outdoor Disconnector Volume (K), by Application 2025 & 2033
- Figure 5: North America Outdoor Disconnector Revenue Share (%), by Application 2025 & 2033
- Figure 6: North America Outdoor Disconnector Volume Share (%), by Application 2025 & 2033
- Figure 7: North America Outdoor Disconnector Revenue (billion), by Types 2025 & 2033
- Figure 8: North America Outdoor Disconnector Volume (K), by Types 2025 & 2033
- Figure 9: North America Outdoor Disconnector Revenue Share (%), by Types 2025 & 2033
- Figure 10: North America Outdoor Disconnector Volume Share (%), by Types 2025 & 2033
- Figure 11: North America Outdoor Disconnector Revenue (billion), by Country 2025 & 2033
- Figure 12: North America Outdoor Disconnector Volume (K), by Country 2025 & 2033
- Figure 13: North America Outdoor Disconnector Revenue Share (%), by Country 2025 & 2033
- Figure 14: North America Outdoor Disconnector Volume Share (%), by Country 2025 & 2033
- Figure 15: South America Outdoor Disconnector Revenue (billion), by Application 2025 & 2033
- Figure 16: South America Outdoor Disconnector Volume (K), by Application 2025 & 2033
- Figure 17: South America Outdoor Disconnector Revenue Share (%), by Application 2025 & 2033
- Figure 18: South America Outdoor Disconnector Volume Share (%), by Application 2025 & 2033
- Figure 19: South America Outdoor Disconnector Revenue (billion), by Types 2025 & 2033
- Figure 20: South America Outdoor Disconnector Volume (K), by Types 2025 & 2033
- Figure 21: South America Outdoor Disconnector Revenue Share (%), by Types 2025 & 2033
- Figure 22: South America Outdoor Disconnector Volume Share (%), by Types 2025 & 2033
- Figure 23: South America Outdoor Disconnector Revenue (billion), by Country 2025 & 2033
- Figure 24: South America Outdoor Disconnector Volume (K), by Country 2025 & 2033
- Figure 25: South America Outdoor Disconnector Revenue Share (%), by Country 2025 & 2033
- Figure 26: South America Outdoor Disconnector Volume Share (%), by Country 2025 & 2033
- Figure 27: Europe Outdoor Disconnector Revenue (billion), by Application 2025 & 2033
- Figure 28: Europe Outdoor Disconnector Volume (K), by Application 2025 & 2033
- Figure 29: Europe Outdoor Disconnector Revenue Share (%), by Application 2025 & 2033
- Figure 30: Europe Outdoor Disconnector Volume Share (%), by Application 2025 & 2033
- Figure 31: Europe Outdoor Disconnector Revenue (billion), by Types 2025 & 2033
- Figure 32: Europe Outdoor Disconnector Volume (K), by Types 2025 & 2033
- Figure 33: Europe Outdoor Disconnector Revenue Share (%), by Types 2025 & 2033
- Figure 34: Europe Outdoor Disconnector Volume Share (%), by Types 2025 & 2033
- Figure 35: Europe Outdoor Disconnector Revenue (billion), by Country 2025 & 2033
- Figure 36: Europe Outdoor Disconnector Volume (K), by Country 2025 & 2033
- Figure 37: Europe Outdoor Disconnector Revenue Share (%), by Country 2025 & 2033
- Figure 38: Europe Outdoor Disconnector Volume Share (%), by Country 2025 & 2033
- Figure 39: Middle East & Africa Outdoor Disconnector Revenue (billion), by Application 2025 & 2033
- Figure 40: Middle East & Africa Outdoor Disconnector Volume (K), by Application 2025 & 2033
- Figure 41: Middle East & Africa Outdoor Disconnector Revenue Share (%), by Application 2025 & 2033
- Figure 42: Middle East & Africa Outdoor Disconnector Volume Share (%), by Application 2025 & 2033
- Figure 43: Middle East & Africa Outdoor Disconnector Revenue (billion), by Types 2025 & 2033
- Figure 44: Middle East & Africa Outdoor Disconnector Volume (K), by Types 2025 & 2033
- Figure 45: Middle East & Africa Outdoor Disconnector Revenue Share (%), by Types 2025 & 2033
- Figure 46: Middle East & Africa Outdoor Disconnector Volume Share (%), by Types 2025 & 2033
- Figure 47: Middle East & Africa Outdoor Disconnector Revenue (billion), by Country 2025 & 2033
- Figure 48: Middle East & Africa Outdoor Disconnector Volume (K), by Country 2025 & 2033
- Figure 49: Middle East & Africa Outdoor Disconnector Revenue Share (%), by Country 2025 & 2033
- Figure 50: Middle East & Africa Outdoor Disconnector Volume Share (%), by Country 2025 & 2033
- Figure 51: Asia Pacific Outdoor Disconnector Revenue (billion), by Application 2025 & 2033
- Figure 52: Asia Pacific Outdoor Disconnector Volume (K), by Application 2025 & 2033
- Figure 53: Asia Pacific Outdoor Disconnector Revenue Share (%), by Application 2025 & 2033
- Figure 54: Asia Pacific Outdoor Disconnector Volume Share (%), by Application 2025 & 2033
- Figure 55: Asia Pacific Outdoor Disconnector Revenue (billion), by Types 2025 & 2033
- Figure 56: Asia Pacific Outdoor Disconnector Volume (K), by Types 2025 & 2033
- Figure 57: Asia Pacific Outdoor Disconnector Revenue Share (%), by Types 2025 & 2033
- Figure 58: Asia Pacific Outdoor Disconnector Volume Share (%), by Types 2025 & 2033
- Figure 59: Asia Pacific Outdoor Disconnector Revenue (billion), by Country 2025 & 2033
- Figure 60: Asia Pacific Outdoor Disconnector Volume (K), by Country 2025 & 2033
- Figure 61: Asia Pacific Outdoor Disconnector Revenue Share (%), by Country 2025 & 2033
- Figure 62: Asia Pacific Outdoor Disconnector Volume Share (%), by Country 2025 & 2033
List of Tables
- Table 1: Global Outdoor Disconnector Revenue billion Forecast, by Application 2020 & 2033
- Table 2: Global Outdoor Disconnector Volume K Forecast, by Application 2020 & 2033
- Table 3: Global Outdoor Disconnector Revenue billion Forecast, by Types 2020 & 2033
- Table 4: Global Outdoor Disconnector Volume K Forecast, by Types 2020 & 2033
- Table 5: Global Outdoor Disconnector Revenue billion Forecast, by Region 2020 & 2033
- Table 6: Global Outdoor Disconnector Volume K Forecast, by Region 2020 & 2033
- Table 7: Global Outdoor Disconnector Revenue billion Forecast, by Application 2020 & 2033
- Table 8: Global Outdoor Disconnector Volume K Forecast, by Application 2020 & 2033
- Table 9: Global Outdoor Disconnector Revenue billion Forecast, by Types 2020 & 2033
- Table 10: Global Outdoor Disconnector Volume K Forecast, by Types 2020 & 2033
- Table 11: Global Outdoor Disconnector Revenue billion Forecast, by Country 2020 & 2033
- Table 12: Global Outdoor Disconnector Volume K Forecast, by Country 2020 & 2033
- Table 13: United States Outdoor Disconnector Revenue (billion) Forecast, by Application 2020 & 2033
- Table 14: United States Outdoor Disconnector Volume (K) Forecast, by Application 2020 & 2033
- Table 15: Canada Outdoor Disconnector Revenue (billion) Forecast, by Application 2020 & 2033
- Table 16: Canada Outdoor Disconnector Volume (K) Forecast, by Application 2020 & 2033
- Table 17: Mexico Outdoor Disconnector Revenue (billion) Forecast, by Application 2020 & 2033
- Table 18: Mexico Outdoor Disconnector Volume (K) Forecast, by Application 2020 & 2033
- Table 19: Global Outdoor Disconnector Revenue billion Forecast, by Application 2020 & 2033
- Table 20: Global Outdoor Disconnector Volume K Forecast, by Application 2020 & 2033
- Table 21: Global Outdoor Disconnector Revenue billion Forecast, by Types 2020 & 2033
- Table 22: Global Outdoor Disconnector Volume K Forecast, by Types 2020 & 2033
- Table 23: Global Outdoor Disconnector Revenue billion Forecast, by Country 2020 & 2033
- Table 24: Global Outdoor Disconnector Volume K Forecast, by Country 2020 & 2033
- Table 25: Brazil Outdoor Disconnector Revenue (billion) Forecast, by Application 2020 & 2033
- Table 26: Brazil Outdoor Disconnector Volume (K) Forecast, by Application 2020 & 2033
- Table 27: Argentina Outdoor Disconnector Revenue (billion) Forecast, by Application 2020 & 2033
- Table 28: Argentina Outdoor Disconnector Volume (K) Forecast, by Application 2020 & 2033
- Table 29: Rest of South America Outdoor Disconnector Revenue (billion) Forecast, by Application 2020 & 2033
- Table 30: Rest of South America Outdoor Disconnector Volume (K) Forecast, by Application 2020 & 2033
- Table 31: Global Outdoor Disconnector Revenue billion Forecast, by Application 2020 & 2033
- Table 32: Global Outdoor Disconnector Volume K Forecast, by Application 2020 & 2033
- Table 33: Global Outdoor Disconnector Revenue billion Forecast, by Types 2020 & 2033
- Table 34: Global Outdoor Disconnector Volume K Forecast, by Types 2020 & 2033
- Table 35: Global Outdoor Disconnector Revenue billion Forecast, by Country 2020 & 2033
- Table 36: Global Outdoor Disconnector Volume K Forecast, by Country 2020 & 2033
- Table 37: United Kingdom Outdoor Disconnector Revenue (billion) Forecast, by Application 2020 & 2033
- Table 38: United Kingdom Outdoor Disconnector Volume (K) Forecast, by Application 2020 & 2033
- Table 39: Germany Outdoor Disconnector Revenue (billion) Forecast, by Application 2020 & 2033
- Table 40: Germany Outdoor Disconnector Volume (K) Forecast, by Application 2020 & 2033
- Table 41: France Outdoor Disconnector Revenue (billion) Forecast, by Application 2020 & 2033
- Table 42: France Outdoor Disconnector Volume (K) Forecast, by Application 2020 & 2033
- Table 43: Italy Outdoor Disconnector Revenue (billion) Forecast, by Application 2020 & 2033
- Table 44: Italy Outdoor Disconnector Volume (K) Forecast, by Application 2020 & 2033
- Table 45: Spain Outdoor Disconnector Revenue (billion) Forecast, by Application 2020 & 2033
- Table 46: Spain Outdoor Disconnector Volume (K) Forecast, by Application 2020 & 2033
- Table 47: Russia Outdoor Disconnector Revenue (billion) Forecast, by Application 2020 & 2033
- Table 48: Russia Outdoor Disconnector Volume (K) Forecast, by Application 2020 & 2033
- Table 49: Benelux Outdoor Disconnector Revenue (billion) Forecast, by Application 2020 & 2033
- Table 50: Benelux Outdoor Disconnector Volume (K) Forecast, by Application 2020 & 2033
- Table 51: Nordics Outdoor Disconnector Revenue (billion) Forecast, by Application 2020 & 2033
- Table 52: Nordics Outdoor Disconnector Volume (K) Forecast, by Application 2020 & 2033
- Table 53: Rest of Europe Outdoor Disconnector Revenue (billion) Forecast, by Application 2020 & 2033
- Table 54: Rest of Europe Outdoor Disconnector Volume (K) Forecast, by Application 2020 & 2033
- Table 55: Global Outdoor Disconnector Revenue billion Forecast, by Application 2020 & 2033
- Table 56: Global Outdoor Disconnector Volume K Forecast, by Application 2020 & 2033
- Table 57: Global Outdoor Disconnector Revenue billion Forecast, by Types 2020 & 2033
- Table 58: Global Outdoor Disconnector Volume K Forecast, by Types 2020 & 2033
- Table 59: Global Outdoor Disconnector Revenue billion Forecast, by Country 2020 & 2033
- Table 60: Global Outdoor Disconnector Volume K Forecast, by Country 2020 & 2033
- Table 61: Turkey Outdoor Disconnector Revenue (billion) Forecast, by Application 2020 & 2033
- Table 62: Turkey Outdoor Disconnector Volume (K) Forecast, by Application 2020 & 2033
- Table 63: Israel Outdoor Disconnector Revenue (billion) Forecast, by Application 2020 & 2033
- Table 64: Israel Outdoor Disconnector Volume (K) Forecast, by Application 2020 & 2033
- Table 65: GCC Outdoor Disconnector Revenue (billion) Forecast, by Application 2020 & 2033
- Table 66: GCC Outdoor Disconnector Volume (K) Forecast, by Application 2020 & 2033
- Table 67: North Africa Outdoor Disconnector Revenue (billion) Forecast, by Application 2020 & 2033
- Table 68: North Africa Outdoor Disconnector Volume (K) Forecast, by Application 2020 & 2033
- Table 69: South Africa Outdoor Disconnector Revenue (billion) Forecast, by Application 2020 & 2033
- Table 70: South Africa Outdoor Disconnector Volume (K) Forecast, by Application 2020 & 2033
- Table 71: Rest of Middle East & Africa Outdoor Disconnector Revenue (billion) Forecast, by Application 2020 & 2033
- Table 72: Rest of Middle East & Africa Outdoor Disconnector Volume (K) Forecast, by Application 2020 & 2033
- Table 73: Global Outdoor Disconnector Revenue billion Forecast, by Application 2020 & 2033
- Table 74: Global Outdoor Disconnector Volume K Forecast, by Application 2020 & 2033
- Table 75: Global Outdoor Disconnector Revenue billion Forecast, by Types 2020 & 2033
- Table 76: Global Outdoor Disconnector Volume K Forecast, by Types 2020 & 2033
- Table 77: Global Outdoor Disconnector Revenue billion Forecast, by Country 2020 & 2033
- Table 78: Global Outdoor Disconnector Volume K Forecast, by Country 2020 & 2033
- Table 79: China Outdoor Disconnector Revenue (billion) Forecast, by Application 2020 & 2033
- Table 80: China Outdoor Disconnector Volume (K) Forecast, by Application 2020 & 2033
- Table 81: India Outdoor Disconnector Revenue (billion) Forecast, by Application 2020 & 2033
- Table 82: India Outdoor Disconnector Volume (K) Forecast, by Application 2020 & 2033
- Table 83: Japan Outdoor Disconnector Revenue (billion) Forecast, by Application 2020 & 2033
- Table 84: Japan Outdoor Disconnector Volume (K) Forecast, by Application 2020 & 2033
- Table 85: South Korea Outdoor Disconnector Revenue (billion) Forecast, by Application 2020 & 2033
- Table 86: South Korea Outdoor Disconnector Volume (K) Forecast, by Application 2020 & 2033
- Table 87: ASEAN Outdoor Disconnector Revenue (billion) Forecast, by Application 2020 & 2033
- Table 88: ASEAN Outdoor Disconnector Volume (K) Forecast, by Application 2020 & 2033
- Table 89: Oceania Outdoor Disconnector Revenue (billion) Forecast, by Application 2020 & 2033
- Table 90: Oceania Outdoor Disconnector Volume (K) Forecast, by Application 2020 & 2033
- Table 91: Rest of Asia Pacific Outdoor Disconnector Revenue (billion) Forecast, by Application 2020 & 2033
- Table 92: Rest of Asia Pacific Outdoor Disconnector Volume (K) Forecast, by Application 2020 & 2033
Frequently Asked Questions
1. What is the projected Compound Annual Growth Rate (CAGR) of the Outdoor Disconnector?
The projected CAGR is approximately 6.22%.
2. Which companies are prominent players in the Outdoor Disconnector?
Key companies in the market include Schneider Electric, ABB, Siemens, GE, Mitsubishi Electric Corporation, Eaton, Rockwell Automation, Inc., Legrand, Hager, Hubbell, Zhejiang CHINT Electrics Co., Ltd., Delixi, Shenglong Electric Group, Chinafato, Shanghai Liangxin Electrical Co., Ltd., Yunnan Yunkai Electrical.
3. What are the main segments of the Outdoor Disconnector?
The market segments include Application, Types.
4. Can you provide details about the market size?
The market size is estimated to be USD 16.17 billion as of 2022.
5. What are some drivers contributing to market growth?
N/A
6. What are the notable trends driving market growth?
N/A
7. Are there any restraints impacting market growth?
N/A
8. Can you provide examples of recent developments in the market?
N/A
9. What pricing options are available for accessing the report?
Pricing options include single-user, multi-user, and enterprise licenses priced at USD 3350.00, USD 5025.00, and USD 6700.00 respectively.
10. Is the market size provided in terms of value or volume?
The market size is provided in terms of value, measured in billion and volume, measured in K.
11. Are there any specific market keywords associated with the report?
Yes, the market keyword associated with the report is "Outdoor Disconnector," which aids in identifying and referencing the specific market segment covered.
12. How do I determine which pricing option suits my needs best?
The pricing options vary based on user requirements and access needs. Individual users may opt for single-user licenses, while businesses requiring broader access may choose multi-user or enterprise licenses for cost-effective access to the report.
13. Are there any additional resources or data provided in the Outdoor Disconnector report?
While the report offers comprehensive insights, it's advisable to review the specific contents or supplementary materials provided to ascertain if additional resources or data are available.
14. How can I stay updated on further developments or reports in the Outdoor Disconnector?
To stay informed about further developments, trends, and reports in the Outdoor Disconnector, consider subscribing to industry newsletters, following relevant companies and organizations, or regularly checking reputable industry news sources and publications.
Methodology
Step 1 - Identification of Relevant Samples Size from Population Database



Step 2 - Approaches for Defining Global Market Size (Value, Volume* & Price*)

Note*: In applicable scenarios
Step 3 - Data Sources
Primary Research
- Web Analytics
- Survey Reports
- Research Institute
- Latest Research Reports
- Opinion Leaders
Secondary Research
- Annual Reports
- White Paper
- Latest Press Release
- Industry Association
- Paid Database
- Investor Presentations

Step 4 - Data Triangulation
Involves using different sources of information in order to increase the validity of a study
These sources are likely to be stakeholders in a program - participants, other researchers, program staff, other community members, and so on.
Then we put all data in single framework & apply various statistical tools to find out the dynamic on the market.
During the analysis stage, feedback from the stakeholder groups would be compared to determine areas of agreement as well as areas of divergence