

Key Insights
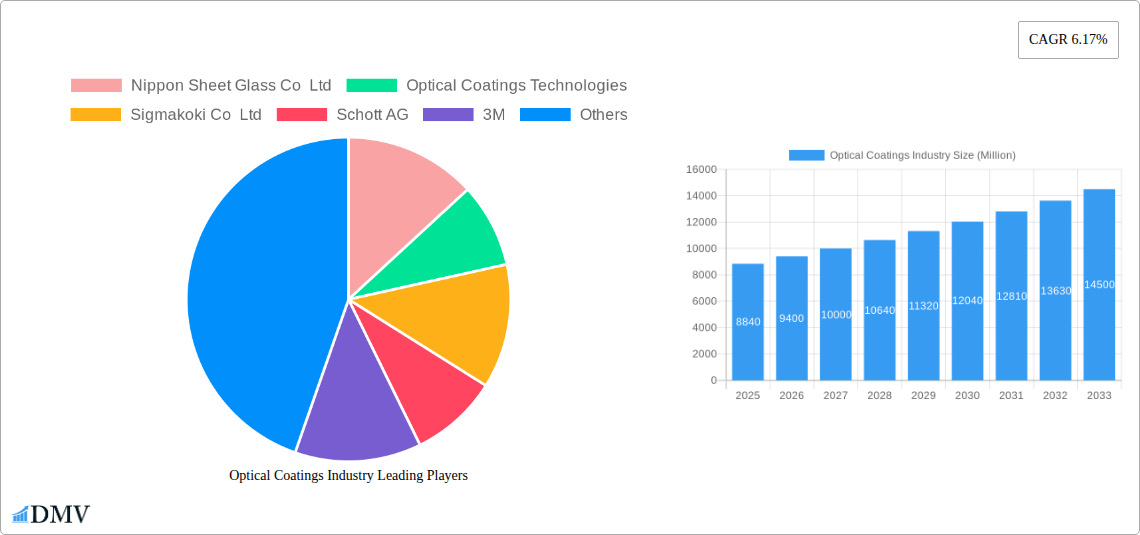
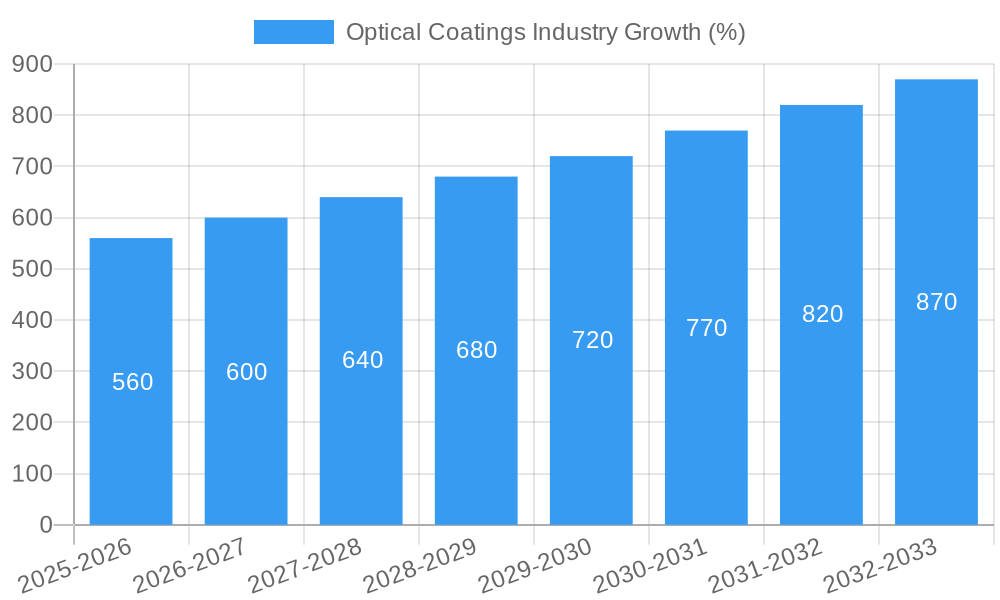
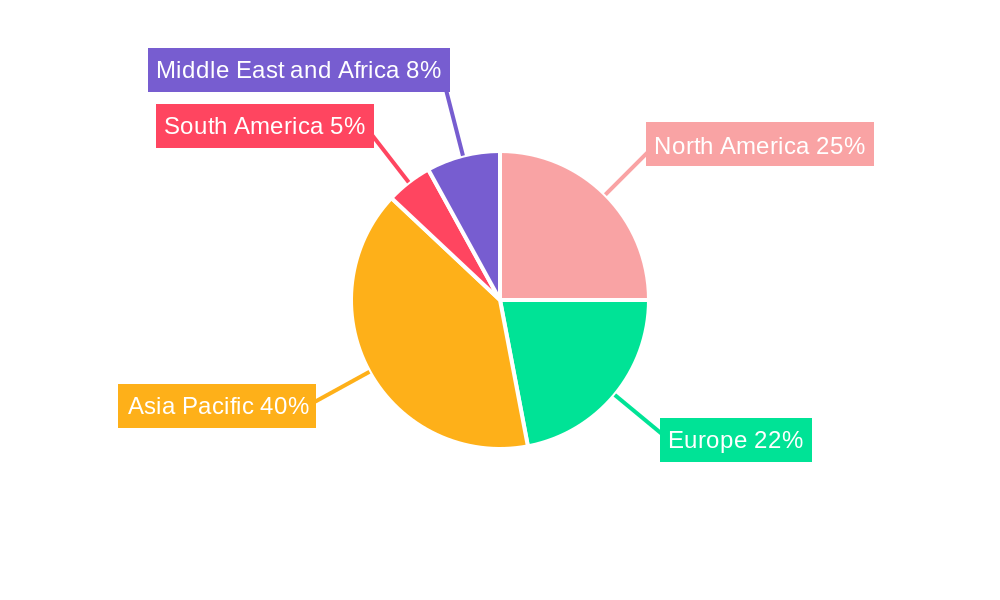
The global optical coatings market, valued at $8.84 billion in 2025, is projected to experience robust growth, driven by a Compound Annual Growth Rate (CAGR) of 6.17% from 2025 to 2033. This expansion is fueled by several key factors. The burgeoning electronics and semiconductor industries are major consumers of optical coatings, demanding advanced solutions for improved device performance and miniaturization. Similarly, the rapid growth of the automotive sector, particularly in areas like advanced driver-assistance systems (ADAS) and autonomous vehicles, necessitates high-performance optical coatings for improved sensor accuracy and safety features. Furthermore, increasing adoption of renewable energy technologies, such as solar panels, is driving demand for efficient anti-reflective and other specialized coatings. Technological advancements, including the development of novel coating materials and deposition techniques like atomic layer deposition, further contribute to market growth by enabling the production of more durable, efficient, and versatile optical coatings. The Asia-Pacific region, particularly China and India, is expected to dominate market share due to rapid industrialization and substantial investments in technological infrastructure.
Despite promising growth prospects, the market faces certain challenges. High initial investment costs associated with advanced coating technologies and the stringent quality control requirements for optical coatings could act as restraints for smaller players. Furthermore, fluctuations in raw material prices and increasing competition from established and emerging players necessitate strategic pricing and technological innovation for market success. The ongoing research and development in new materials and processes, focusing on enhancing durability, performance, and cost-effectiveness, will be crucial in addressing these challenges and unlocking the full potential of this rapidly expanding market. The segment analysis suggests that anti-reflective coatings and chemical vapor deposition technologies are currently the largest market shares, but technological advancements in other areas, like sub-wavelength structured surfaces, are poised for significant growth.
Optical Coatings Industry: A Comprehensive Market Report (2019-2033)
This insightful report provides a detailed analysis of the Optical Coatings industry, offering a comprehensive overview of market trends, technological advancements, and key players shaping its future. With a study period spanning 2019-2033, a base year of 2025, and a forecast period of 2025-2033, this report is an invaluable resource for stakeholders seeking to understand and capitalize on the opportunities within this dynamic sector. The global market size is estimated at xx Million in 2025, projected to reach xx Million by 2033.
Optical Coatings Industry Market Composition & Trends
The Optical Coatings market is characterized by a moderately concentrated landscape, with several key players holding significant market share. Companies such as Nippon Sheet Glass Co Ltd, 3M, PPG Industries Inc, and Zeiss International are major contributors, though the exact market share distribution fluctuates. Innovation is driven by the constant need for improved optical performance across various applications, fueled by advancements in materials science and deposition techniques. The regulatory landscape varies across regions, with some focusing on environmental regulations related to manufacturing processes, while others concentrate on product safety and performance standards. Substitute products are limited, primarily confined to alternative material choices for specific applications. Mergers and acquisitions (M&A) play a significant role in market consolidation and technological expansion, with recent deals valued at xx Million collectively.
- Market Concentration: Moderately concentrated with a few dominant players.
- Innovation Catalysts: Advancements in materials science and deposition techniques.
- Regulatory Landscape: Varies by region, focusing on environmental and product safety standards.
- Substitute Products: Limited options, mainly alternative materials.
- M&A Activity: Significant activity driving consolidation and technological integration (total value: xx Million).
- End-User Profiles: Diverse, including Aerospace & Defense, Electronics & Semiconductors, Telecommunications, Healthcare, Solar, and Automotive sectors.
Optical Coatings Industry Industry Evolution
The Optical Coatings industry has witnessed significant growth over the historical period (2019-2024), driven primarily by increased demand from the electronics and telecommunications sectors. The market experienced a Compound Annual Growth Rate (CAGR) of xx% during this period. Technological advancements such as Atomic Layer Deposition (ALD) and sub-wavelength structured surfaces have enhanced performance and enabled new applications. Shifting consumer demands, particularly in the areas of miniaturization and higher performance, have further accelerated growth. The forecast period (2025-2033) anticipates continued expansion, driven by the rising adoption of advanced technologies in various industries, with an estimated CAGR of xx%. The growing demand for high-performance optical components in emerging technologies like augmented and virtual reality is also a significant factor contributing to this projected growth. Adoption rates of new technologies like ALD are expected to reach xx% by 2033.
Leading Regions, Countries, or Segments in Optical Coatings Industry
The Electronics and Semiconductors end-user industry is currently the dominant segment, followed by the Aerospace and Defense sector. Within product types, Anti-reflective coatings and Optical Filter Coatings hold the largest market shares. In terms of technology, Ion-beam sputtering and Plasma sputtering are widely adopted, while Atomic Layer Deposition is experiencing rapid growth. North America and Asia currently lead in terms of regional market share due to the high concentration of key players and significant end-user demand, particularly in the electronics sector.
Key Drivers (North America & Asia):
- High concentration of major players.
- Robust investment in R&D.
- Strong government support for technological advancement.
- High demand from the electronics and telecommunications sectors.
Dominance Factors: Established manufacturing infrastructure, skilled workforce, and substantial R&D investments.
Optical Coatings Industry Product Innovations
Recent product innovations focus on enhancing durability, scratch resistance, and optical performance. The development of novel coating materials, combined with advanced deposition techniques, allows for the creation of coatings with higher refractive indices, improved transparency, and enhanced spectral control. These innovations are driving the adoption of optical coatings in diverse applications, including high-precision imaging systems, advanced displays, and energy-efficient solar cells. Unique selling propositions include improved efficiency, longer lifetimes, and superior optical performance compared to previous generations of coatings.
Propelling Factors for Optical Coatings Industry Growth
Several key factors are propelling the growth of the Optical Coatings industry. Technological advancements, such as the development of new deposition techniques and improved materials, are continuously enhancing product performance. Economic factors, including increasing demand from emerging economies and rising disposable incomes, drive market expansion. Additionally, supportive government policies and regulations, especially related to energy efficiency and environmental sustainability, are creating further opportunities for growth. For instance, the increasing adoption of renewable energy technologies is stimulating demand for high-performance coatings in solar panels.
Obstacles in the Optical Coatings Industry Market
The Optical Coatings industry faces challenges such as supply chain disruptions, impacting the availability and cost of raw materials. Competitive pressures, especially from low-cost manufacturers, are also impacting margins. Stringent regulatory compliance requirements in different regions can increase production costs. Finally, the development and adoption of new technologies often involve high initial investment costs, potentially limiting wider market penetration. These factors collectively could hinder the growth trajectory of the market, especially for smaller players.
Future Opportunities in Optical Coatings Industry
Future opportunities lie in expanding into new markets, such as wearable electronics and biomedical devices. Advancements in nanotechnology and photonics are opening avenues for developing next-generation coatings with exceptional properties. Emerging consumer trends towards high-performance and energy-efficient products are also driving demand. The development of sustainable and environmentally friendly coating materials presents a significant opportunity for differentiation and market expansion.
Major Players in the Optical Coatings Industry Ecosystem
- Nippon Sheet Glass Co Ltd
- Optical Coatings Technologies
- Sigmakoki Co Ltd
- Schott AG
- 3M
- PPG Industries Inc
- Quantum Coating
- Zeiss International
- Edmund Optics Inc
- DuPont
- Inrad Optics
- Artemis Optical Ltd
- Accucoat Inc
- Materion Corporation
- Abrisa Technologies
- Reynard Corporation
- Newport Corporation
- Zygo Corporation
Key Developments in Optical Coatings Industry Industry
- April 2022: Imatest partnered with Edmund Optics Inc., enhancing imaging performance evaluation tools accessibility.
- April 2022: Edmund Optics Inc. opened a new facility in New Jersey, boosting collaboration and service capabilities.
- April 2022: Carl Zeiss Meditec acquired Kogent Surgical and Katalyst Surgical, strengthening its surgical solutions portfolio.
Strategic Optical Coatings Industry Market Forecast
The Optical Coatings market is poised for substantial growth in the coming years, driven by increasing demand across various sectors and technological advancements. The expansion of the electronics and renewable energy industries will be key catalysts, alongside innovations in coating materials and deposition techniques. Opportunities in emerging applications, such as augmented reality and biomedical devices, present significant potential for market expansion, creating a positive outlook for the industry in the forecast period.
Optical Coatings Industry Segmentation
-
1. Product Type
- 1.1. Optical Filter Coatings
- 1.2. Anti-reflective Coatings
- 1.3. Transparent Conductive Coatings
- 1.4. Mirror Coatings (High Reflective)
- 1.5. Beam Splitter Coatings
- 1.6. Other Pr
-
2. Technology
- 2.1. Chemical Vapor Deposition
- 2.2. Ion-beam Sputtering
- 2.3. Plasma Sputtering
- 2.4. Atomic Layer Deposition
- 2.5. Sub-wavelength Structured Surfaces
-
3. End-user Industry
- 3.1. Aerospace and Defense
- 3.2. Electronics and Semiconductors
- 3.3. Telecommunications
- 3.4. Healthcare
- 3.5. Solar
- 3.6. Automotive
- 3.7. Other En
Optical Coatings Industry Segmentation By Geography
-
1. Asia Pacific
- 1.1. China
- 1.2. India
- 1.3. Japan
- 1.4. South Korea
- 1.5. Malaysia
- 1.6. Thailand
- 1.7. Indonesia
- 1.8. Vietnam
- 1.9. Rest of Asia Pacific
-
2. North America
- 2.1. United States
- 2.2. Canada
- 2.3. Mexico
-
3. Europe
- 3.1. Germany
- 3.2. United Kingdom
- 3.3. Italy
- 3.4. France
- 3.5. Spain
- 3.6. Nordic Countries
- 3.7. Turkey
- 3.8. Russia
- 3.9. Rest of Europe
-
4. South America
- 4.1. Brazil
- 4.2. Argentina
- 4.3. Colombia
- 4.4. Rest of South America
-
5. Middle East and Africa
- 5.1. Saudi Arabia
- 5.2. South Africa
- 5.3. Qatar
- 5.4. United Arab Emirates
- 5.5. Nigeria
- 5.6. Egypt
- 5.7. Rest of Middle East and Africa
Optical Coatings Industry REPORT HIGHLIGHTS
| Aspects | Details |
|---|---|
| Study Period | 2019-2033 |
| Base Year | 2024 |
| Estimated Year | 2025 |
| Forecast Period | 2025-2033 |
| Historical Period | 2019-2024 |
| Growth Rate | CAGR of 6.17% from 2019-2033 |
| Segmentation |
|
Table of Contents
- 1. Introduction
- 1.1. Research Scope
- 1.2. Market Segmentation
- 1.3. Research Methodology
- 1.4. Definitions and Assumptions
- 2. Executive Summary
- 2.1. Introduction
- 3. Market Dynamics
- 3.1. Introduction
- 3.2. Market Drivers
- 3.2.1. Growing Demand from the Solar Industry; Technological Advancements in the Optical Coatings Process
- 3.3. Market Restrains
- 3.3.1. High Costs and Some Limiting Properties of Optical Coatings
- 3.4. Market Trends
- 3.4.1. The Electronics and Semiconductors Segment is Expected to Dominate the Market
- 4. Market Factor Analysis
- 4.1. Porters Five Forces
- 4.2. Supply/Value Chain
- 4.3. PESTEL analysis
- 4.4. Market Entropy
- 4.5. Patent/Trademark Analysis
- 5. Global Optical Coatings Industry Analysis, Insights and Forecast, 2019-2031
- 5.1. Market Analysis, Insights and Forecast - by Product Type
- 5.1.1. Optical Filter Coatings
- 5.1.2. Anti-reflective Coatings
- 5.1.3. Transparent Conductive Coatings
- 5.1.4. Mirror Coatings (High Reflective)
- 5.1.5. Beam Splitter Coatings
- 5.1.6. Other Pr
- 5.2. Market Analysis, Insights and Forecast - by Technology
- 5.2.1. Chemical Vapor Deposition
- 5.2.2. Ion-beam Sputtering
- 5.2.3. Plasma Sputtering
- 5.2.4. Atomic Layer Deposition
- 5.2.5. Sub-wavelength Structured Surfaces
- 5.3. Market Analysis, Insights and Forecast - by End-user Industry
- 5.3.1. Aerospace and Defense
- 5.3.2. Electronics and Semiconductors
- 5.3.3. Telecommunications
- 5.3.4. Healthcare
- 5.3.5. Solar
- 5.3.6. Automotive
- 5.3.7. Other En
- 5.4. Market Analysis, Insights and Forecast - by Region
- 5.4.1. Asia Pacific
- 5.4.2. North America
- 5.4.3. Europe
- 5.4.4. South America
- 5.4.5. Middle East and Africa
- 5.1. Market Analysis, Insights and Forecast - by Product Type
- 6. Asia Pacific Optical Coatings Industry Analysis, Insights and Forecast, 2019-2031
- 6.1. Market Analysis, Insights and Forecast - by Product Type
- 6.1.1. Optical Filter Coatings
- 6.1.2. Anti-reflective Coatings
- 6.1.3. Transparent Conductive Coatings
- 6.1.4. Mirror Coatings (High Reflective)
- 6.1.5. Beam Splitter Coatings
- 6.1.6. Other Pr
- 6.2. Market Analysis, Insights and Forecast - by Technology
- 6.2.1. Chemical Vapor Deposition
- 6.2.2. Ion-beam Sputtering
- 6.2.3. Plasma Sputtering
- 6.2.4. Atomic Layer Deposition
- 6.2.5. Sub-wavelength Structured Surfaces
- 6.3. Market Analysis, Insights and Forecast - by End-user Industry
- 6.3.1. Aerospace and Defense
- 6.3.2. Electronics and Semiconductors
- 6.3.3. Telecommunications
- 6.3.4. Healthcare
- 6.3.5. Solar
- 6.3.6. Automotive
- 6.3.7. Other En
- 6.1. Market Analysis, Insights and Forecast - by Product Type
- 7. North America Optical Coatings Industry Analysis, Insights and Forecast, 2019-2031
- 7.1. Market Analysis, Insights and Forecast - by Product Type
- 7.1.1. Optical Filter Coatings
- 7.1.2. Anti-reflective Coatings
- 7.1.3. Transparent Conductive Coatings
- 7.1.4. Mirror Coatings (High Reflective)
- 7.1.5. Beam Splitter Coatings
- 7.1.6. Other Pr
- 7.2. Market Analysis, Insights and Forecast - by Technology
- 7.2.1. Chemical Vapor Deposition
- 7.2.2. Ion-beam Sputtering
- 7.2.3. Plasma Sputtering
- 7.2.4. Atomic Layer Deposition
- 7.2.5. Sub-wavelength Structured Surfaces
- 7.3. Market Analysis, Insights and Forecast - by End-user Industry
- 7.3.1. Aerospace and Defense
- 7.3.2. Electronics and Semiconductors
- 7.3.3. Telecommunications
- 7.3.4. Healthcare
- 7.3.5. Solar
- 7.3.6. Automotive
- 7.3.7. Other En
- 7.1. Market Analysis, Insights and Forecast - by Product Type
- 8. Europe Optical Coatings Industry Analysis, Insights and Forecast, 2019-2031
- 8.1. Market Analysis, Insights and Forecast - by Product Type
- 8.1.1. Optical Filter Coatings
- 8.1.2. Anti-reflective Coatings
- 8.1.3. Transparent Conductive Coatings
- 8.1.4. Mirror Coatings (High Reflective)
- 8.1.5. Beam Splitter Coatings
- 8.1.6. Other Pr
- 8.2. Market Analysis, Insights and Forecast - by Technology
- 8.2.1. Chemical Vapor Deposition
- 8.2.2. Ion-beam Sputtering
- 8.2.3. Plasma Sputtering
- 8.2.4. Atomic Layer Deposition
- 8.2.5. Sub-wavelength Structured Surfaces
- 8.3. Market Analysis, Insights and Forecast - by End-user Industry
- 8.3.1. Aerospace and Defense
- 8.3.2. Electronics and Semiconductors
- 8.3.3. Telecommunications
- 8.3.4. Healthcare
- 8.3.5. Solar
- 8.3.6. Automotive
- 8.3.7. Other En
- 8.1. Market Analysis, Insights and Forecast - by Product Type
- 9. South America Optical Coatings Industry Analysis, Insights and Forecast, 2019-2031
- 9.1. Market Analysis, Insights and Forecast - by Product Type
- 9.1.1. Optical Filter Coatings
- 9.1.2. Anti-reflective Coatings
- 9.1.3. Transparent Conductive Coatings
- 9.1.4. Mirror Coatings (High Reflective)
- 9.1.5. Beam Splitter Coatings
- 9.1.6. Other Pr
- 9.2. Market Analysis, Insights and Forecast - by Technology
- 9.2.1. Chemical Vapor Deposition
- 9.2.2. Ion-beam Sputtering
- 9.2.3. Plasma Sputtering
- 9.2.4. Atomic Layer Deposition
- 9.2.5. Sub-wavelength Structured Surfaces
- 9.3. Market Analysis, Insights and Forecast - by End-user Industry
- 9.3.1. Aerospace and Defense
- 9.3.2. Electronics and Semiconductors
- 9.3.3. Telecommunications
- 9.3.4. Healthcare
- 9.3.5. Solar
- 9.3.6. Automotive
- 9.3.7. Other En
- 9.1. Market Analysis, Insights and Forecast - by Product Type
- 10. Middle East and Africa Optical Coatings Industry Analysis, Insights and Forecast, 2019-2031
- 10.1. Market Analysis, Insights and Forecast - by Product Type
- 10.1.1. Optical Filter Coatings
- 10.1.2. Anti-reflective Coatings
- 10.1.3. Transparent Conductive Coatings
- 10.1.4. Mirror Coatings (High Reflective)
- 10.1.5. Beam Splitter Coatings
- 10.1.6. Other Pr
- 10.2. Market Analysis, Insights and Forecast - by Technology
- 10.2.1. Chemical Vapor Deposition
- 10.2.2. Ion-beam Sputtering
- 10.2.3. Plasma Sputtering
- 10.2.4. Atomic Layer Deposition
- 10.2.5. Sub-wavelength Structured Surfaces
- 10.3. Market Analysis, Insights and Forecast - by End-user Industry
- 10.3.1. Aerospace and Defense
- 10.3.2. Electronics and Semiconductors
- 10.3.3. Telecommunications
- 10.3.4. Healthcare
- 10.3.5. Solar
- 10.3.6. Automotive
- 10.3.7. Other En
- 10.1. Market Analysis, Insights and Forecast - by Product Type
- 11. Asia Pacific Optical Coatings Industry Analysis, Insights and Forecast, 2019-2031
- 11.1. Market Analysis, Insights and Forecast - By Country/Sub-region
- 11.1.1 China
- 11.1.2 India
- 11.1.3 Japan
- 11.1.4 South Korea
- 11.1.5 Rest of Asia Pacific
- 12. North America Optical Coatings Industry Analysis, Insights and Forecast, 2019-2031
- 12.1. Market Analysis, Insights and Forecast - By Country/Sub-region
- 12.1.1 United States
- 12.1.2 Canada
- 12.1.3 Mexico
- 13. Europe Optical Coatings Industry Analysis, Insights and Forecast, 2019-2031
- 13.1. Market Analysis, Insights and Forecast - By Country/Sub-region
- 13.1.1 Germany
- 13.1.2 United Kingdom
- 13.1.3 Italy
- 13.1.4 France
- 13.1.5 Rest of Europe
- 14. South America Optical Coatings Industry Analysis, Insights and Forecast, 2019-2031
- 14.1. Market Analysis, Insights and Forecast - By Country/Sub-region
- 14.1.1 Brazil
- 14.1.2 Argentina
- 14.1.3 Rest of South America
- 15. Middle East and Africa Optical Coatings Industry Analysis, Insights and Forecast, 2019-2031
- 15.1. Market Analysis, Insights and Forecast - By Country/Sub-region
- 15.1.1 Saudi Arabia
- 15.1.2 South Africa
- 15.1.3 Rest of Middle East and Africa
- 16. Competitive Analysis
- 16.1. Global Market Share Analysis 2024
- 16.2. Company Profiles
- 16.2.1 Nippon Sheet Glass Co Ltd
- 16.2.1.1. Overview
- 16.2.1.2. Products
- 16.2.1.3. SWOT Analysis
- 16.2.1.4. Recent Developments
- 16.2.1.5. Financials (Based on Availability)
- 16.2.2 Optical Coatings Technologies
- 16.2.2.1. Overview
- 16.2.2.2. Products
- 16.2.2.3. SWOT Analysis
- 16.2.2.4. Recent Developments
- 16.2.2.5. Financials (Based on Availability)
- 16.2.3 Sigmakoki Co Ltd
- 16.2.3.1. Overview
- 16.2.3.2. Products
- 16.2.3.3. SWOT Analysis
- 16.2.3.4. Recent Developments
- 16.2.3.5. Financials (Based on Availability)
- 16.2.4 Schott AG
- 16.2.4.1. Overview
- 16.2.4.2. Products
- 16.2.4.3. SWOT Analysis
- 16.2.4.4. Recent Developments
- 16.2.4.5. Financials (Based on Availability)
- 16.2.5 3M
- 16.2.5.1. Overview
- 16.2.5.2. Products
- 16.2.5.3. SWOT Analysis
- 16.2.5.4. Recent Developments
- 16.2.5.5. Financials (Based on Availability)
- 16.2.6 PPG Industries Inc
- 16.2.6.1. Overview
- 16.2.6.2. Products
- 16.2.6.3. SWOT Analysis
- 16.2.6.4. Recent Developments
- 16.2.6.5. Financials (Based on Availability)
- 16.2.7 Quantum Coating
- 16.2.7.1. Overview
- 16.2.7.2. Products
- 16.2.7.3. SWOT Analysis
- 16.2.7.4. Recent Developments
- 16.2.7.5. Financials (Based on Availability)
- 16.2.8 Zeiss International
- 16.2.8.1. Overview
- 16.2.8.2. Products
- 16.2.8.3. SWOT Analysis
- 16.2.8.4. Recent Developments
- 16.2.8.5. Financials (Based on Availability)
- 16.2.9 Edmund Optics Inc
- 16.2.9.1. Overview
- 16.2.9.2. Products
- 16.2.9.3. SWOT Analysis
- 16.2.9.4. Recent Developments
- 16.2.9.5. Financials (Based on Availability)
- 16.2.10 DuPont
- 16.2.10.1. Overview
- 16.2.10.2. Products
- 16.2.10.3. SWOT Analysis
- 16.2.10.4. Recent Developments
- 16.2.10.5. Financials (Based on Availability)
- 16.2.11 Inrad Optics
- 16.2.11.1. Overview
- 16.2.11.2. Products
- 16.2.11.3. SWOT Analysis
- 16.2.11.4. Recent Developments
- 16.2.11.5. Financials (Based on Availability)
- 16.2.12 Artemis Optical Ltd
- 16.2.12.1. Overview
- 16.2.12.2. Products
- 16.2.12.3. SWOT Analysis
- 16.2.12.4. Recent Developments
- 16.2.12.5. Financials (Based on Availability)
- 16.2.13 Accucoat Inc
- 16.2.13.1. Overview
- 16.2.13.2. Products
- 16.2.13.3. SWOT Analysis
- 16.2.13.4. Recent Developments
- 16.2.13.5. Financials (Based on Availability)
- 16.2.14 Materion Corporation
- 16.2.14.1. Overview
- 16.2.14.2. Products
- 16.2.14.3. SWOT Analysis
- 16.2.14.4. Recent Developments
- 16.2.14.5. Financials (Based on Availability)
- 16.2.15 Abrisa Technologies
- 16.2.15.1. Overview
- 16.2.15.2. Products
- 16.2.15.3. SWOT Analysis
- 16.2.15.4. Recent Developments
- 16.2.15.5. Financials (Based on Availability)
- 16.2.16 Reynard Corporation
- 16.2.16.1. Overview
- 16.2.16.2. Products
- 16.2.16.3. SWOT Analysis
- 16.2.16.4. Recent Developments
- 16.2.16.5. Financials (Based on Availability)
- 16.2.17 Newport Corporation
- 16.2.17.1. Overview
- 16.2.17.2. Products
- 16.2.17.3. SWOT Analysis
- 16.2.17.4. Recent Developments
- 16.2.17.5. Financials (Based on Availability)
- 16.2.18 Zygo Corporation*List Not Exhaustive
- 16.2.18.1. Overview
- 16.2.18.2. Products
- 16.2.18.3. SWOT Analysis
- 16.2.18.4. Recent Developments
- 16.2.18.5. Financials (Based on Availability)
- 16.2.1 Nippon Sheet Glass Co Ltd
List of Figures
- Figure 1: Global Optical Coatings Industry Revenue Breakdown (Million, %) by Region 2024 & 2032
- Figure 2: Asia Pacific Optical Coatings Industry Revenue (Million), by Country 2024 & 2032
- Figure 3: Asia Pacific Optical Coatings Industry Revenue Share (%), by Country 2024 & 2032
- Figure 4: North America Optical Coatings Industry Revenue (Million), by Country 2024 & 2032
- Figure 5: North America Optical Coatings Industry Revenue Share (%), by Country 2024 & 2032
- Figure 6: Europe Optical Coatings Industry Revenue (Million), by Country 2024 & 2032
- Figure 7: Europe Optical Coatings Industry Revenue Share (%), by Country 2024 & 2032
- Figure 8: South America Optical Coatings Industry Revenue (Million), by Country 2024 & 2032
- Figure 9: South America Optical Coatings Industry Revenue Share (%), by Country 2024 & 2032
- Figure 10: Middle East and Africa Optical Coatings Industry Revenue (Million), by Country 2024 & 2032
- Figure 11: Middle East and Africa Optical Coatings Industry Revenue Share (%), by Country 2024 & 2032
- Figure 12: Asia Pacific Optical Coatings Industry Revenue (Million), by Product Type 2024 & 2032
- Figure 13: Asia Pacific Optical Coatings Industry Revenue Share (%), by Product Type 2024 & 2032
- Figure 14: Asia Pacific Optical Coatings Industry Revenue (Million), by Technology 2024 & 2032
- Figure 15: Asia Pacific Optical Coatings Industry Revenue Share (%), by Technology 2024 & 2032
- Figure 16: Asia Pacific Optical Coatings Industry Revenue (Million), by End-user Industry 2024 & 2032
- Figure 17: Asia Pacific Optical Coatings Industry Revenue Share (%), by End-user Industry 2024 & 2032
- Figure 18: Asia Pacific Optical Coatings Industry Revenue (Million), by Country 2024 & 2032
- Figure 19: Asia Pacific Optical Coatings Industry Revenue Share (%), by Country 2024 & 2032
- Figure 20: North America Optical Coatings Industry Revenue (Million), by Product Type 2024 & 2032
- Figure 21: North America Optical Coatings Industry Revenue Share (%), by Product Type 2024 & 2032
- Figure 22: North America Optical Coatings Industry Revenue (Million), by Technology 2024 & 2032
- Figure 23: North America Optical Coatings Industry Revenue Share (%), by Technology 2024 & 2032
- Figure 24: North America Optical Coatings Industry Revenue (Million), by End-user Industry 2024 & 2032
- Figure 25: North America Optical Coatings Industry Revenue Share (%), by End-user Industry 2024 & 2032
- Figure 26: North America Optical Coatings Industry Revenue (Million), by Country 2024 & 2032
- Figure 27: North America Optical Coatings Industry Revenue Share (%), by Country 2024 & 2032
- Figure 28: Europe Optical Coatings Industry Revenue (Million), by Product Type 2024 & 2032
- Figure 29: Europe Optical Coatings Industry Revenue Share (%), by Product Type 2024 & 2032
- Figure 30: Europe Optical Coatings Industry Revenue (Million), by Technology 2024 & 2032
- Figure 31: Europe Optical Coatings Industry Revenue Share (%), by Technology 2024 & 2032
- Figure 32: Europe Optical Coatings Industry Revenue (Million), by End-user Industry 2024 & 2032
- Figure 33: Europe Optical Coatings Industry Revenue Share (%), by End-user Industry 2024 & 2032
- Figure 34: Europe Optical Coatings Industry Revenue (Million), by Country 2024 & 2032
- Figure 35: Europe Optical Coatings Industry Revenue Share (%), by Country 2024 & 2032
- Figure 36: South America Optical Coatings Industry Revenue (Million), by Product Type 2024 & 2032
- Figure 37: South America Optical Coatings Industry Revenue Share (%), by Product Type 2024 & 2032
- Figure 38: South America Optical Coatings Industry Revenue (Million), by Technology 2024 & 2032
- Figure 39: South America Optical Coatings Industry Revenue Share (%), by Technology 2024 & 2032
- Figure 40: South America Optical Coatings Industry Revenue (Million), by End-user Industry 2024 & 2032
- Figure 41: South America Optical Coatings Industry Revenue Share (%), by End-user Industry 2024 & 2032
- Figure 42: South America Optical Coatings Industry Revenue (Million), by Country 2024 & 2032
- Figure 43: South America Optical Coatings Industry Revenue Share (%), by Country 2024 & 2032
- Figure 44: Middle East and Africa Optical Coatings Industry Revenue (Million), by Product Type 2024 & 2032
- Figure 45: Middle East and Africa Optical Coatings Industry Revenue Share (%), by Product Type 2024 & 2032
- Figure 46: Middle East and Africa Optical Coatings Industry Revenue (Million), by Technology 2024 & 2032
- Figure 47: Middle East and Africa Optical Coatings Industry Revenue Share (%), by Technology 2024 & 2032
- Figure 48: Middle East and Africa Optical Coatings Industry Revenue (Million), by End-user Industry 2024 & 2032
- Figure 49: Middle East and Africa Optical Coatings Industry Revenue Share (%), by End-user Industry 2024 & 2032
- Figure 50: Middle East and Africa Optical Coatings Industry Revenue (Million), by Country 2024 & 2032
- Figure 51: Middle East and Africa Optical Coatings Industry Revenue Share (%), by Country 2024 & 2032
List of Tables
- Table 1: Global Optical Coatings Industry Revenue Million Forecast, by Region 2019 & 2032
- Table 2: Global Optical Coatings Industry Revenue Million Forecast, by Product Type 2019 & 2032
- Table 3: Global Optical Coatings Industry Revenue Million Forecast, by Technology 2019 & 2032
- Table 4: Global Optical Coatings Industry Revenue Million Forecast, by End-user Industry 2019 & 2032
- Table 5: Global Optical Coatings Industry Revenue Million Forecast, by Region 2019 & 2032
- Table 6: Global Optical Coatings Industry Revenue Million Forecast, by Country 2019 & 2032
- Table 7: China Optical Coatings Industry Revenue (Million) Forecast, by Application 2019 & 2032
- Table 8: India Optical Coatings Industry Revenue (Million) Forecast, by Application 2019 & 2032
- Table 9: Japan Optical Coatings Industry Revenue (Million) Forecast, by Application 2019 & 2032
- Table 10: South Korea Optical Coatings Industry Revenue (Million) Forecast, by Application 2019 & 2032
- Table 11: Rest of Asia Pacific Optical Coatings Industry Revenue (Million) Forecast, by Application 2019 & 2032
- Table 12: Global Optical Coatings Industry Revenue Million Forecast, by Country 2019 & 2032
- Table 13: United States Optical Coatings Industry Revenue (Million) Forecast, by Application 2019 & 2032
- Table 14: Canada Optical Coatings Industry Revenue (Million) Forecast, by Application 2019 & 2032
- Table 15: Mexico Optical Coatings Industry Revenue (Million) Forecast, by Application 2019 & 2032
- Table 16: Global Optical Coatings Industry Revenue Million Forecast, by Country 2019 & 2032
- Table 17: Germany Optical Coatings Industry Revenue (Million) Forecast, by Application 2019 & 2032
- Table 18: United Kingdom Optical Coatings Industry Revenue (Million) Forecast, by Application 2019 & 2032
- Table 19: Italy Optical Coatings Industry Revenue (Million) Forecast, by Application 2019 & 2032
- Table 20: France Optical Coatings Industry Revenue (Million) Forecast, by Application 2019 & 2032
- Table 21: Rest of Europe Optical Coatings Industry Revenue (Million) Forecast, by Application 2019 & 2032
- Table 22: Global Optical Coatings Industry Revenue Million Forecast, by Country 2019 & 2032
- Table 23: Brazil Optical Coatings Industry Revenue (Million) Forecast, by Application 2019 & 2032
- Table 24: Argentina Optical Coatings Industry Revenue (Million) Forecast, by Application 2019 & 2032
- Table 25: Rest of South America Optical Coatings Industry Revenue (Million) Forecast, by Application 2019 & 2032
- Table 26: Global Optical Coatings Industry Revenue Million Forecast, by Country 2019 & 2032
- Table 27: Saudi Arabia Optical Coatings Industry Revenue (Million) Forecast, by Application 2019 & 2032
- Table 28: South Africa Optical Coatings Industry Revenue (Million) Forecast, by Application 2019 & 2032
- Table 29: Rest of Middle East and Africa Optical Coatings Industry Revenue (Million) Forecast, by Application 2019 & 2032
- Table 30: Global Optical Coatings Industry Revenue Million Forecast, by Product Type 2019 & 2032
- Table 31: Global Optical Coatings Industry Revenue Million Forecast, by Technology 2019 & 2032
- Table 32: Global Optical Coatings Industry Revenue Million Forecast, by End-user Industry 2019 & 2032
- Table 33: Global Optical Coatings Industry Revenue Million Forecast, by Country 2019 & 2032
- Table 34: China Optical Coatings Industry Revenue (Million) Forecast, by Application 2019 & 2032
- Table 35: India Optical Coatings Industry Revenue (Million) Forecast, by Application 2019 & 2032
- Table 36: Japan Optical Coatings Industry Revenue (Million) Forecast, by Application 2019 & 2032
- Table 37: South Korea Optical Coatings Industry Revenue (Million) Forecast, by Application 2019 & 2032
- Table 38: Malaysia Optical Coatings Industry Revenue (Million) Forecast, by Application 2019 & 2032
- Table 39: Thailand Optical Coatings Industry Revenue (Million) Forecast, by Application 2019 & 2032
- Table 40: Indonesia Optical Coatings Industry Revenue (Million) Forecast, by Application 2019 & 2032
- Table 41: Vietnam Optical Coatings Industry Revenue (Million) Forecast, by Application 2019 & 2032
- Table 42: Rest of Asia Pacific Optical Coatings Industry Revenue (Million) Forecast, by Application 2019 & 2032
- Table 43: Global Optical Coatings Industry Revenue Million Forecast, by Product Type 2019 & 2032
- Table 44: Global Optical Coatings Industry Revenue Million Forecast, by Technology 2019 & 2032
- Table 45: Global Optical Coatings Industry Revenue Million Forecast, by End-user Industry 2019 & 2032
- Table 46: Global Optical Coatings Industry Revenue Million Forecast, by Country 2019 & 2032
- Table 47: United States Optical Coatings Industry Revenue (Million) Forecast, by Application 2019 & 2032
- Table 48: Canada Optical Coatings Industry Revenue (Million) Forecast, by Application 2019 & 2032
- Table 49: Mexico Optical Coatings Industry Revenue (Million) Forecast, by Application 2019 & 2032
- Table 50: Global Optical Coatings Industry Revenue Million Forecast, by Product Type 2019 & 2032
- Table 51: Global Optical Coatings Industry Revenue Million Forecast, by Technology 2019 & 2032
- Table 52: Global Optical Coatings Industry Revenue Million Forecast, by End-user Industry 2019 & 2032
- Table 53: Global Optical Coatings Industry Revenue Million Forecast, by Country 2019 & 2032
- Table 54: Germany Optical Coatings Industry Revenue (Million) Forecast, by Application 2019 & 2032
- Table 55: United Kingdom Optical Coatings Industry Revenue (Million) Forecast, by Application 2019 & 2032
- Table 56: Italy Optical Coatings Industry Revenue (Million) Forecast, by Application 2019 & 2032
- Table 57: France Optical Coatings Industry Revenue (Million) Forecast, by Application 2019 & 2032
- Table 58: Spain Optical Coatings Industry Revenue (Million) Forecast, by Application 2019 & 2032
- Table 59: Nordic Countries Optical Coatings Industry Revenue (Million) Forecast, by Application 2019 & 2032
- Table 60: Turkey Optical Coatings Industry Revenue (Million) Forecast, by Application 2019 & 2032
- Table 61: Russia Optical Coatings Industry Revenue (Million) Forecast, by Application 2019 & 2032
- Table 62: Rest of Europe Optical Coatings Industry Revenue (Million) Forecast, by Application 2019 & 2032
- Table 63: Global Optical Coatings Industry Revenue Million Forecast, by Product Type 2019 & 2032
- Table 64: Global Optical Coatings Industry Revenue Million Forecast, by Technology 2019 & 2032
- Table 65: Global Optical Coatings Industry Revenue Million Forecast, by End-user Industry 2019 & 2032
- Table 66: Global Optical Coatings Industry Revenue Million Forecast, by Country 2019 & 2032
- Table 67: Brazil Optical Coatings Industry Revenue (Million) Forecast, by Application 2019 & 2032
- Table 68: Argentina Optical Coatings Industry Revenue (Million) Forecast, by Application 2019 & 2032
- Table 69: Colombia Optical Coatings Industry Revenue (Million) Forecast, by Application 2019 & 2032
- Table 70: Rest of South America Optical Coatings Industry Revenue (Million) Forecast, by Application 2019 & 2032
- Table 71: Global Optical Coatings Industry Revenue Million Forecast, by Product Type 2019 & 2032
- Table 72: Global Optical Coatings Industry Revenue Million Forecast, by Technology 2019 & 2032
- Table 73: Global Optical Coatings Industry Revenue Million Forecast, by End-user Industry 2019 & 2032
- Table 74: Global Optical Coatings Industry Revenue Million Forecast, by Country 2019 & 2032
- Table 75: Saudi Arabia Optical Coatings Industry Revenue (Million) Forecast, by Application 2019 & 2032
- Table 76: South Africa Optical Coatings Industry Revenue (Million) Forecast, by Application 2019 & 2032
- Table 77: Qatar Optical Coatings Industry Revenue (Million) Forecast, by Application 2019 & 2032
- Table 78: United Arab Emirates Optical Coatings Industry Revenue (Million) Forecast, by Application 2019 & 2032
- Table 79: Nigeria Optical Coatings Industry Revenue (Million) Forecast, by Application 2019 & 2032
- Table 80: Egypt Optical Coatings Industry Revenue (Million) Forecast, by Application 2019 & 2032
- Table 81: Rest of Middle East and Africa Optical Coatings Industry Revenue (Million) Forecast, by Application 2019 & 2032
Frequently Asked Questions
1. What is the projected Compound Annual Growth Rate (CAGR) of the Optical Coatings Industry?
The projected CAGR is approximately 6.17%.
2. Which companies are prominent players in the Optical Coatings Industry?
Key companies in the market include Nippon Sheet Glass Co Ltd, Optical Coatings Technologies, Sigmakoki Co Ltd, Schott AG, 3M, PPG Industries Inc, Quantum Coating, Zeiss International, Edmund Optics Inc, DuPont, Inrad Optics, Artemis Optical Ltd, Accucoat Inc, Materion Corporation, Abrisa Technologies, Reynard Corporation, Newport Corporation, Zygo Corporation*List Not Exhaustive.
3. What are the main segments of the Optical Coatings Industry?
The market segments include Product Type, Technology, End-user Industry.
4. Can you provide details about the market size?
The market size is estimated to be USD 8.84 Million as of 2022.
5. What are some drivers contributing to market growth?
Growing Demand from the Solar Industry; Technological Advancements in the Optical Coatings Process.
6. What are the notable trends driving market growth?
The Electronics and Semiconductors Segment is Expected to Dominate the Market.
7. Are there any restraints impacting market growth?
High Costs and Some Limiting Properties of Optical Coatings.
8. Can you provide examples of recent developments in the market?
April 2022: Imatest announced a new partnership with Edmund Optics Inc. to enable its customers to buy Imatest software and charts via Edmund Optics' website seamlessly. Additionally, this partnership will allow Edmund Optics' imaging customers to easily acquire the tools needed to evaluate their imaging performance.
9. What pricing options are available for accessing the report?
Pricing options include single-user, multi-user, and enterprise licenses priced at USD 4750, USD 5250, and USD 8750 respectively.
10. Is the market size provided in terms of value or volume?
The market size is provided in terms of value, measured in Million.
11. Are there any specific market keywords associated with the report?
Yes, the market keyword associated with the report is "Optical Coatings Industry," which aids in identifying and referencing the specific market segment covered.
12. How do I determine which pricing option suits my needs best?
The pricing options vary based on user requirements and access needs. Individual users may opt for single-user licenses, while businesses requiring broader access may choose multi-user or enterprise licenses for cost-effective access to the report.
13. Are there any additional resources or data provided in the Optical Coatings Industry report?
While the report offers comprehensive insights, it's advisable to review the specific contents or supplementary materials provided to ascertain if additional resources or data are available.
14. How can I stay updated on further developments or reports in the Optical Coatings Industry?
To stay informed about further developments, trends, and reports in the Optical Coatings Industry, consider subscribing to industry newsletters, following relevant companies and organizations, or regularly checking reputable industry news sources and publications.
Methodology
Step 1 - Identification of Relevant Samples Size from Population Database


Step 2 - Approaches for Defining Global Market Size (Value, Volume* & Price*)

Note*: In applicable scenarios
Step 3 - Data Sources
Primary Research
- Web Analytics
- Survey Reports
- Research Institute
- Latest Research Reports
- Opinion Leaders
Secondary Research
- Annual Reports
- White Paper
- Latest Press Release
- Industry Association
- Paid Database
- Investor Presentations

Step 4 - Data Triangulation
Involves using different sources of information in order to increase the validity of a study
These sources are likely to be stakeholders in a program - participants, other researchers, program staff, other community members, and so on.
Then we put all data in single framework & apply various statistical tools to find out the dynamic on the market.
During the analysis stage, feedback from the stakeholder groups would be compared to determine areas of agreement as well as areas of divergence
