

Key Insights
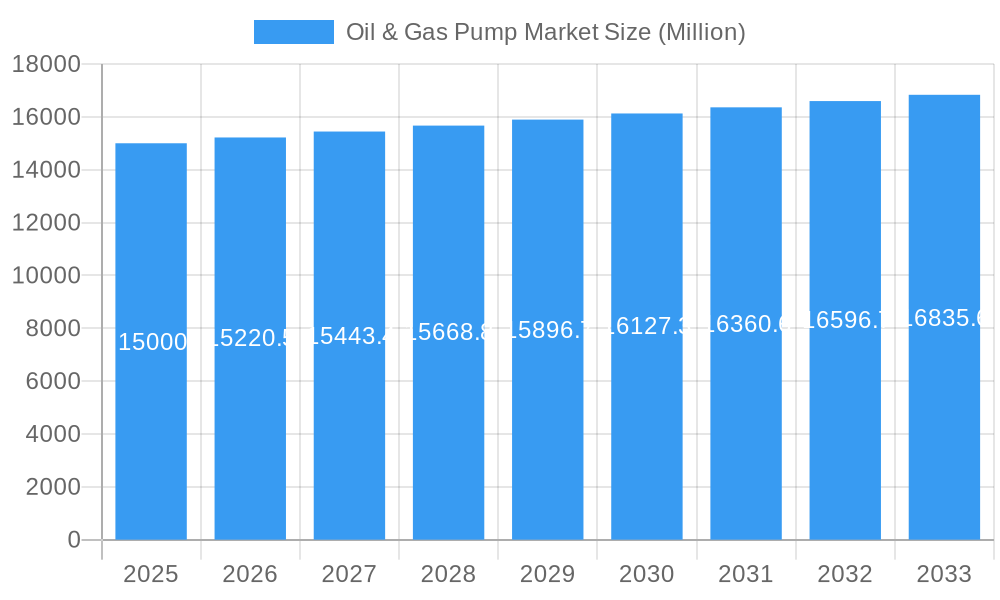
The global oil and gas pump market is poised for significant expansion, projected to reach $14.27 billion by 2025, with a Compound Annual Growth Rate (CAGR) of 8.8% through 2033. This robust growth is underpinned by escalating global energy demand, particularly in emerging economies, driving the need for advanced extraction and transportation solutions. Technological innovations, including energy-efficient pump designs and smart technologies for predictive maintenance, are key growth catalysts. While a gradual shift toward sustainability may influence long-term trends, current industry focus remains on operational efficiency. However, market expansion faces headwinds from volatile oil and gas prices and stringent environmental regulations, necessitating adaptable pump solutions.
Oil & Gas Pump Market Market Size (In Billion)
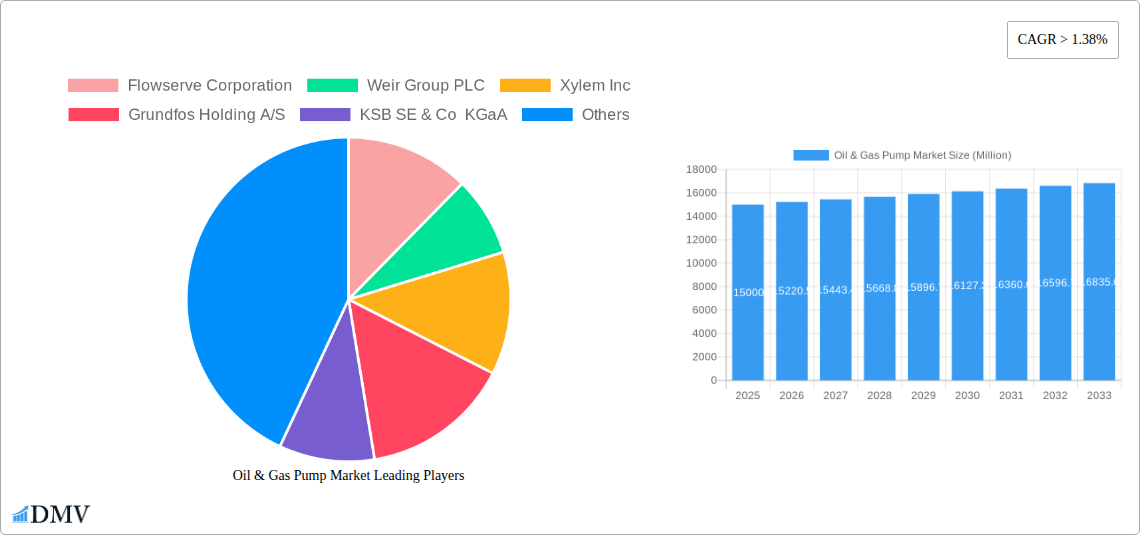
The market is segmented by pump type, with dynamic pumps currently leading due to their high-volume application in pipelines and refineries. Positive displacement pumps are seeing increased adoption for specialized, high-pressure requirements. Geographically, North America and Europe hold substantial market shares, while the Asia-Pacific region, driven by China and India, presents significant growth prospects. Leading companies such as Flowserve Corporation, Weir Group PLC, and Xylem Inc. are actively pursuing technological advancements and strategic alliances to capitalize on evolving market dynamics and emerging opportunities. The forecast period of 2025-2033 promises substantial potential for industry participants who can effectively navigate market challenges and meet the evolving demands of the energy sector.
Oil & Gas Pump Market Company Market Share
Oil & Gas Pump Market: A Comprehensive Market Analysis Report (2019-2033)
This insightful report provides a comprehensive analysis of the global Oil & Gas Pump market, offering a detailed examination of market trends, growth drivers, challenges, and future opportunities from 2019 to 2033. The study covers key segments including Dynamic Pumps and Positive Displacement Pumps, across various applications such as Upstream, Midstream, and Downstream operations. With a base year of 2025 and a forecast period extending to 2033, this report is an invaluable resource for stakeholders seeking to understand and capitalize on the evolving dynamics of this crucial industry sector. The market is estimated to be valued at xx Million in 2025 and projected to reach xx Million by 2033.
Oil & Gas Pump Market Composition & Trends
This section delves into the competitive landscape of the Oil & Gas Pump market, analyzing market concentration, innovation catalysts, regulatory landscapes, substitute products, end-user profiles, and M&A activities. The report examines the market share distribution among key players such as Flowserve Corporation, Weir Group PLC, Xylem Inc, Grundfos Holding A/S, KSB SE & Co KGaA, ITT Inc, Baker Hughes Co, Sulzer AG, Alfa Laval AB, and Gardner Denver Holdings Inc. We analyze the impact of recent mergers and acquisitions (M&A) on market dynamics, including deal values (xx Million) and their influence on market consolidation.
- Market Concentration: Analysis of market share held by top players and identification of dominant players.
- Innovation Catalysts: Discussion of technological advancements driving innovation, such as the integration of IoT sensors and advanced materials.
- Regulatory Landscape: Examination of prevailing regulations impacting market growth, including environmental regulations and safety standards.
- Substitute Products: Assessment of alternative technologies and their potential impact on market share.
- End-User Profiles: Detailed profiling of key end-users across Upstream, Midstream, and Downstream segments.
- M&A Activities: Analysis of recent M&A activities, including deal values and their impact on market structure.
Oil & Gas Pump Market Industry Evolution
This section provides a detailed analysis of the Oil & Gas Pump market's evolution over the study period (2019-2024) and its projected trajectory for the forecast period (2025-2033). We analyze market growth trajectories, technological advancements, and shifting consumer demands, providing specific data points such as compound annual growth rates (CAGR) and adoption rates for new technologies. The analysis accounts for factors such as fluctuating oil prices, increased environmental concerns, and the growing adoption of automation and digitalization technologies within the oil and gas industry. The report also examines the impact of industry 4.0 trends and the increasing importance of energy efficiency on market growth. The market is expected to experience a CAGR of xx% during the forecast period, driven primarily by increasing demand from the upstream sector and advancements in pump technology.
Leading Regions, Countries, or Segments in Oil & Gas Pump Market
This section identifies the dominant regions, countries, and segments within the Oil & Gas Pump market. A detailed analysis of market leadership in terms of type (Dynamic Pumps, Positive Displacement Pumps) and application (Upstream, Midstream, Downstream) is provided, identifying key drivers for growth in each segment.
- Dominant Region/Country: Analysis detailing the reasons for the dominance of specific regions/countries.
- Key Drivers (Upstream):
- Increased investment in exploration and production activities.
- Development of new oil and gas fields.
- Growing demand for higher capacity pumps in harsh environments.
- Key Drivers (Midstream):
- Expansion of pipeline networks and storage facilities.
- Growing demand for efficient and reliable pumps for crude oil and natural gas transportation.
- Key Drivers (Downstream):
- Increased refining capacity and petrochemical production.
- Rising demand for specialized pumps in downstream applications.
- Dominant Pump Type: Analysis of market share between Dynamic Pumps and Positive Displacement Pumps, highlighting the factors contributing to the dominance of one type over the other.
Oil & Gas Pump Market Product Innovations
This section highlights recent product innovations in the Oil & Gas Pump market, including advancements in materials, design, and functionality. We discuss the unique selling propositions (USPs) of new products and their impact on pump efficiency, reliability, and lifespan. Examples include the development of pumps with enhanced corrosion resistance, higher flow rates, and improved energy efficiency. These innovations are crucial for meeting the evolving needs of the oil and gas industry.
Propelling Factors for Oil & Gas Pump Market Growth
Several key factors are driving the growth of the Oil & Gas Pump market. These include technological advancements leading to higher efficiency and reliability, increasing demand from the oil and gas industry due to exploration and production activities, and favorable government policies and regulations supporting industry growth. Economic growth in key regions further fuels demand for these pumps. Technological advancements, particularly in areas like automation and digitalization, contribute significantly to market growth by increasing operational efficiency and reducing maintenance costs.
Obstacles in the Oil & Gas Pump Market
Despite significant growth potential, the Oil & Gas Pump market faces several challenges. Stringent environmental regulations and fluctuating oil prices impact market growth. Supply chain disruptions and increased competition from established and emerging players also pose significant obstacles. These factors can create price volatility and affect project timelines.
Future Opportunities in Oil & Gas Pump Market
The Oil & Gas Pump market presents several promising future opportunities. The growing demand for pumps in unconventional oil and gas extraction and the increasing adoption of renewable energy technologies offer significant growth potential. Emerging markets in developing countries also present lucrative opportunities. Moreover, advancements in pump technology, including smart pumps and predictive maintenance, are opening new avenues for growth.
Major Players in the Oil & Gas Pump Market Ecosystem
Key Developments in Oil & Gas Pump Market Industry
- [Month, Year]: Flowserve Corporation launches a new line of high-efficiency pumps for offshore applications.
- [Month, Year]: Weir Group PLC acquires a smaller pump manufacturer, expanding its market share in the upstream sector.
- [Month, Year]: Xylem Inc. announces a strategic partnership to develop smart pumps with advanced monitoring capabilities.
- [Month, Year]: New environmental regulations are implemented, affecting the design and manufacturing of oil and gas pumps.
- (Add more specific developments as available)
Strategic Oil & Gas Pump Market Forecast
The Oil & Gas Pump market is poised for continued growth, driven by technological advancements, increasing demand from the oil and gas industry, and favorable government policies. Future opportunities lie in the development of energy-efficient pumps, smart pumps, and pumps for unconventional oil and gas extraction. The market is expected to experience robust expansion in the coming years, presenting significant opportunities for both established and emerging players.
Oil & Gas Pump Market Segmentation
-
1. Type
- 1.1. Dynamic Pumps
- 1.2. Positive Displacement Pumps
-
2. Application
- 2.1. Upstream
- 2.2. Midstream
- 2.3. Downstream
Oil & Gas Pump Market Segmentation By Geography
- 1. North America
- 2. Europe
- 3. Asia Pacific
- 4. South America
- 5. Middle East and Africa
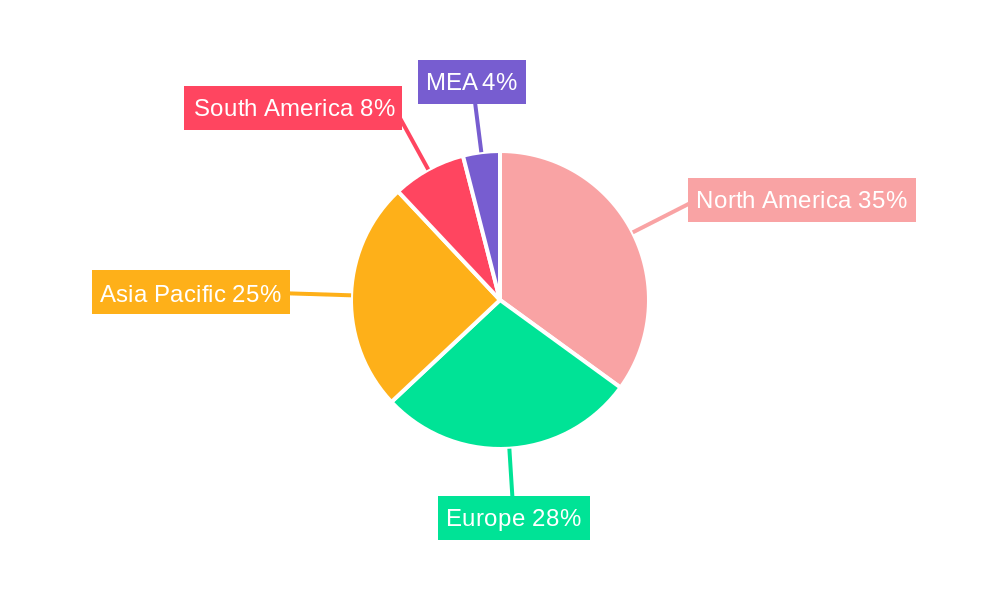
Oil & Gas Pump Market Regional Market Share
Geographic Coverage of Oil & Gas Pump Market
Oil & Gas Pump Market REPORT HIGHLIGHTS
| Aspects | Details |
|---|---|
| Study Period | 2020-2034 |
| Base Year | 2025 |
| Estimated Year | 2026 |
| Forecast Period | 2026-2034 |
| Historical Period | 2020-2025 |
| Growth Rate | CAGR of 8.8% from 2020-2034 |
| Segmentation |
|
Table of Contents
- 1. Introduction
- 1.1. Research Scope
- 1.2. Market Segmentation
- 1.3. Research Objective
- 1.4. Definitions and Assumptions
- 2. Executive Summary
- 2.1. Market Snapshot
- 3. Market Dynamics
- 3.1. Market Drivers
- 3.2. Market Restrains
- 3.3. Market Trends
- 3.4. Market Opportunities
- 4. Market Factor Analysis
- 4.1. Porters Five Forces
- 4.1.1. Bargaining Power of Suppliers
- 4.1.2. Bargaining Power of Buyers
- 4.1.3. Threat of New Entrants
- 4.1.4. Threat of Substitutes
- 4.1.5. Competitive Rivalry
- 4.2. PESTEL analysis
- 4.3. BCG Analysis
- 4.3.1. Stars (High Growth, High Market Share)
- 4.3.2. Cash Cows (Low Growth, High Market Share)
- 4.3.3. Question Mark (High Growth, Low Market Share)
- 4.3.4. Dogs (Low Growth, Low Market Share)
- 4.4. Ansoff Matrix Analysis
- 4.5. Supply Chain Analysis
- 4.6. Regulatory Landscape
- 4.7. Current Market Potential and Opportunity Assessment (TAM–SAM–SOM Framework)
- 4.8. DMV Analyst Note
- 4.1. Porters Five Forces
- 5. Market Analysis, Insights and Forecast 2021-2033
- 5.1. Market Analysis, Insights and Forecast - by Type
- 5.1.1. Dynamic Pumps
- 5.1.2. Positive Displacement Pumps
- 5.2. Market Analysis, Insights and Forecast - by Application
- 5.2.1. Upstream
- 5.2.2. Midstream
- 5.2.3. Downstream
- 5.3. Market Analysis, Insights and Forecast - by Region
- 5.3.1. North America
- 5.3.2. Europe
- 5.3.3. Asia Pacific
- 5.3.4. South America
- 5.3.5. Middle East and Africa
- 5.1. Market Analysis, Insights and Forecast - by Type
- 6. Global Oil & Gas Pump Market Analysis, Insights and Forecast, 2021-2033
- 6.1. Market Analysis, Insights and Forecast - by Type
- 6.1.1. Dynamic Pumps
- 6.1.2. Positive Displacement Pumps
- 6.2. Market Analysis, Insights and Forecast - by Application
- 6.2.1. Upstream
- 6.2.2. Midstream
- 6.2.3. Downstream
- 6.1. Market Analysis, Insights and Forecast - by Type
- 7. North America Oil & Gas Pump Market Analysis, Insights and Forecast, 2020-2032
- 7.1. Market Analysis, Insights and Forecast - by Type
- 7.1.1. Dynamic Pumps
- 7.1.2. Positive Displacement Pumps
- 7.2. Market Analysis, Insights and Forecast - by Application
- 7.2.1. Upstream
- 7.2.2. Midstream
- 7.2.3. Downstream
- 7.1. Market Analysis, Insights and Forecast - by Type
- 8. Europe Oil & Gas Pump Market Analysis, Insights and Forecast, 2020-2032
- 8.1. Market Analysis, Insights and Forecast - by Type
- 8.1.1. Dynamic Pumps
- 8.1.2. Positive Displacement Pumps
- 8.2. Market Analysis, Insights and Forecast - by Application
- 8.2.1. Upstream
- 8.2.2. Midstream
- 8.2.3. Downstream
- 8.1. Market Analysis, Insights and Forecast - by Type
- 9. Asia Pacific Oil & Gas Pump Market Analysis, Insights and Forecast, 2020-2032
- 9.1. Market Analysis, Insights and Forecast - by Type
- 9.1.1. Dynamic Pumps
- 9.1.2. Positive Displacement Pumps
- 9.2. Market Analysis, Insights and Forecast - by Application
- 9.2.1. Upstream
- 9.2.2. Midstream
- 9.2.3. Downstream
- 9.1. Market Analysis, Insights and Forecast - by Type
- 10. South America Oil & Gas Pump Market Analysis, Insights and Forecast, 2020-2032
- 10.1. Market Analysis, Insights and Forecast - by Type
- 10.1.1. Dynamic Pumps
- 10.1.2. Positive Displacement Pumps
- 10.2. Market Analysis, Insights and Forecast - by Application
- 10.2.1. Upstream
- 10.2.2. Midstream
- 10.2.3. Downstream
- 10.1. Market Analysis, Insights and Forecast - by Type
- 11. Middle East and Africa Oil & Gas Pump Market Analysis, Insights and Forecast, 2020-2032
- 11.1. Market Analysis, Insights and Forecast - by Type
- 11.1.1. Dynamic Pumps
- 11.1.2. Positive Displacement Pumps
- 11.2. Market Analysis, Insights and Forecast - by Application
- 11.2.1. Upstream
- 11.2.2. Midstream
- 11.2.3. Downstream
- 11.1. Market Analysis, Insights and Forecast - by Type
- 12. Competitive Analysis
- 12.1. Company Profiles
- 12.1.1 Flowserve Corporation
- 12.1.1.1. Company Overview
- 12.1.1.2. Products
- 12.1.1.3. Company Financials
- 12.1.1.4. SWOT Analysis
- 12.1.2 Weir Group PLC
- 12.1.2.1. Company Overview
- 12.1.2.2. Products
- 12.1.2.3. Company Financials
- 12.1.2.4. SWOT Analysis
- 12.1.3 Xylem Inc
- 12.1.3.1. Company Overview
- 12.1.3.2. Products
- 12.1.3.3. Company Financials
- 12.1.3.4. SWOT Analysis
- 12.1.4 Grundfos Holding A/S
- 12.1.4.1. Company Overview
- 12.1.4.2. Products
- 12.1.4.3. Company Financials
- 12.1.4.4. SWOT Analysis
- 12.1.5 KSB SE & Co KGaA
- 12.1.5.1. Company Overview
- 12.1.5.2. Products
- 12.1.5.3. Company Financials
- 12.1.5.4. SWOT Analysis
- 12.1.6 ITT Inc
- 12.1.6.1. Company Overview
- 12.1.6.2. Products
- 12.1.6.3. Company Financials
- 12.1.6.4. SWOT Analysis
- 12.1.7 Baker Hughes Co
- 12.1.7.1. Company Overview
- 12.1.7.2. Products
- 12.1.7.3. Company Financials
- 12.1.7.4. SWOT Analysis
- 12.1.8 Sulzer AG
- 12.1.8.1. Company Overview
- 12.1.8.2. Products
- 12.1.8.3. Company Financials
- 12.1.8.4. SWOT Analysis
- 12.1.9 Alfa Laval AB
- 12.1.9.1. Company Overview
- 12.1.9.2. Products
- 12.1.9.3. Company Financials
- 12.1.9.4. SWOT Analysis
- 12.1.10 Gardner Denver Holdings Inc
- 12.1.10.1. Company Overview
- 12.1.10.2. Products
- 12.1.10.3. Company Financials
- 12.1.10.4. SWOT Analysis
- 12.1.1 Flowserve Corporation
- 12.2. Market Entropy
- 12.2.1 Company's Key Areas Served
- 12.2.2 Recent Developments
- 12.3. Company Market Share Analysis 2025
- 12.3.1 Top 5 Companies Market Share Analysis
- 12.3.2 Top 3 Companies Market Share Analysis
- 12.4. List of Potential Customers
- 13. Research Methodology
List of Figures
- Figure 1: Global Oil & Gas Pump Market Revenue Breakdown (billion, %) by Region 2025 & 2033
- Figure 2: Global Oil & Gas Pump Market Volume Breakdown (K Units, %) by Region 2025 & 2033
- Figure 3: North America Oil & Gas Pump Market Revenue (billion), by Type 2025 & 2033
- Figure 4: North America Oil & Gas Pump Market Volume (K Units), by Type 2025 & 2033
- Figure 5: North America Oil & Gas Pump Market Revenue Share (%), by Type 2025 & 2033
- Figure 6: North America Oil & Gas Pump Market Volume Share (%), by Type 2025 & 2033
- Figure 7: North America Oil & Gas Pump Market Revenue (billion), by Application 2025 & 2033
- Figure 8: North America Oil & Gas Pump Market Volume (K Units), by Application 2025 & 2033
- Figure 9: North America Oil & Gas Pump Market Revenue Share (%), by Application 2025 & 2033
- Figure 10: North America Oil & Gas Pump Market Volume Share (%), by Application 2025 & 2033
- Figure 11: North America Oil & Gas Pump Market Revenue (billion), by Country 2025 & 2033
- Figure 12: North America Oil & Gas Pump Market Volume (K Units), by Country 2025 & 2033
- Figure 13: North America Oil & Gas Pump Market Revenue Share (%), by Country 2025 & 2033
- Figure 14: North America Oil & Gas Pump Market Volume Share (%), by Country 2025 & 2033
- Figure 15: Europe Oil & Gas Pump Market Revenue (billion), by Type 2025 & 2033
- Figure 16: Europe Oil & Gas Pump Market Volume (K Units), by Type 2025 & 2033
- Figure 17: Europe Oil & Gas Pump Market Revenue Share (%), by Type 2025 & 2033
- Figure 18: Europe Oil & Gas Pump Market Volume Share (%), by Type 2025 & 2033
- Figure 19: Europe Oil & Gas Pump Market Revenue (billion), by Application 2025 & 2033
- Figure 20: Europe Oil & Gas Pump Market Volume (K Units), by Application 2025 & 2033
- Figure 21: Europe Oil & Gas Pump Market Revenue Share (%), by Application 2025 & 2033
- Figure 22: Europe Oil & Gas Pump Market Volume Share (%), by Application 2025 & 2033
- Figure 23: Europe Oil & Gas Pump Market Revenue (billion), by Country 2025 & 2033
- Figure 24: Europe Oil & Gas Pump Market Volume (K Units), by Country 2025 & 2033
- Figure 25: Europe Oil & Gas Pump Market Revenue Share (%), by Country 2025 & 2033
- Figure 26: Europe Oil & Gas Pump Market Volume Share (%), by Country 2025 & 2033
- Figure 27: Asia Pacific Oil & Gas Pump Market Revenue (billion), by Type 2025 & 2033
- Figure 28: Asia Pacific Oil & Gas Pump Market Volume (K Units), by Type 2025 & 2033
- Figure 29: Asia Pacific Oil & Gas Pump Market Revenue Share (%), by Type 2025 & 2033
- Figure 30: Asia Pacific Oil & Gas Pump Market Volume Share (%), by Type 2025 & 2033
- Figure 31: Asia Pacific Oil & Gas Pump Market Revenue (billion), by Application 2025 & 2033
- Figure 32: Asia Pacific Oil & Gas Pump Market Volume (K Units), by Application 2025 & 2033
- Figure 33: Asia Pacific Oil & Gas Pump Market Revenue Share (%), by Application 2025 & 2033
- Figure 34: Asia Pacific Oil & Gas Pump Market Volume Share (%), by Application 2025 & 2033
- Figure 35: Asia Pacific Oil & Gas Pump Market Revenue (billion), by Country 2025 & 2033
- Figure 36: Asia Pacific Oil & Gas Pump Market Volume (K Units), by Country 2025 & 2033
- Figure 37: Asia Pacific Oil & Gas Pump Market Revenue Share (%), by Country 2025 & 2033
- Figure 38: Asia Pacific Oil & Gas Pump Market Volume Share (%), by Country 2025 & 2033
- Figure 39: South America Oil & Gas Pump Market Revenue (billion), by Type 2025 & 2033
- Figure 40: South America Oil & Gas Pump Market Volume (K Units), by Type 2025 & 2033
- Figure 41: South America Oil & Gas Pump Market Revenue Share (%), by Type 2025 & 2033
- Figure 42: South America Oil & Gas Pump Market Volume Share (%), by Type 2025 & 2033
- Figure 43: South America Oil & Gas Pump Market Revenue (billion), by Application 2025 & 2033
- Figure 44: South America Oil & Gas Pump Market Volume (K Units), by Application 2025 & 2033
- Figure 45: South America Oil & Gas Pump Market Revenue Share (%), by Application 2025 & 2033
- Figure 46: South America Oil & Gas Pump Market Volume Share (%), by Application 2025 & 2033
- Figure 47: South America Oil & Gas Pump Market Revenue (billion), by Country 2025 & 2033
- Figure 48: South America Oil & Gas Pump Market Volume (K Units), by Country 2025 & 2033
- Figure 49: South America Oil & Gas Pump Market Revenue Share (%), by Country 2025 & 2033
- Figure 50: South America Oil & Gas Pump Market Volume Share (%), by Country 2025 & 2033
- Figure 51: Middle East and Africa Oil & Gas Pump Market Revenue (billion), by Type 2025 & 2033
- Figure 52: Middle East and Africa Oil & Gas Pump Market Volume (K Units), by Type 2025 & 2033
- Figure 53: Middle East and Africa Oil & Gas Pump Market Revenue Share (%), by Type 2025 & 2033
- Figure 54: Middle East and Africa Oil & Gas Pump Market Volume Share (%), by Type 2025 & 2033
- Figure 55: Middle East and Africa Oil & Gas Pump Market Revenue (billion), by Application 2025 & 2033
- Figure 56: Middle East and Africa Oil & Gas Pump Market Volume (K Units), by Application 2025 & 2033
- Figure 57: Middle East and Africa Oil & Gas Pump Market Revenue Share (%), by Application 2025 & 2033
- Figure 58: Middle East and Africa Oil & Gas Pump Market Volume Share (%), by Application 2025 & 2033
- Figure 59: Middle East and Africa Oil & Gas Pump Market Revenue (billion), by Country 2025 & 2033
- Figure 60: Middle East and Africa Oil & Gas Pump Market Volume (K Units), by Country 2025 & 2033
- Figure 61: Middle East and Africa Oil & Gas Pump Market Revenue Share (%), by Country 2025 & 2033
- Figure 62: Middle East and Africa Oil & Gas Pump Market Volume Share (%), by Country 2025 & 2033
List of Tables
- Table 1: Global Oil & Gas Pump Market Revenue billion Forecast, by Type 2020 & 2033
- Table 2: Global Oil & Gas Pump Market Volume K Units Forecast, by Type 2020 & 2033
- Table 3: Global Oil & Gas Pump Market Revenue billion Forecast, by Application 2020 & 2033
- Table 4: Global Oil & Gas Pump Market Volume K Units Forecast, by Application 2020 & 2033
- Table 5: Global Oil & Gas Pump Market Revenue billion Forecast, by Region 2020 & 2033
- Table 6: Global Oil & Gas Pump Market Volume K Units Forecast, by Region 2020 & 2033
- Table 7: Global Oil & Gas Pump Market Revenue billion Forecast, by Type 2020 & 2033
- Table 8: Global Oil & Gas Pump Market Volume K Units Forecast, by Type 2020 & 2033
- Table 9: Global Oil & Gas Pump Market Revenue billion Forecast, by Application 2020 & 2033
- Table 10: Global Oil & Gas Pump Market Volume K Units Forecast, by Application 2020 & 2033
- Table 11: Global Oil & Gas Pump Market Revenue billion Forecast, by Country 2020 & 2033
- Table 12: Global Oil & Gas Pump Market Volume K Units Forecast, by Country 2020 & 2033
- Table 13: Global Oil & Gas Pump Market Revenue billion Forecast, by Type 2020 & 2033
- Table 14: Global Oil & Gas Pump Market Volume K Units Forecast, by Type 2020 & 2033
- Table 15: Global Oil & Gas Pump Market Revenue billion Forecast, by Application 2020 & 2033
- Table 16: Global Oil & Gas Pump Market Volume K Units Forecast, by Application 2020 & 2033
- Table 17: Global Oil & Gas Pump Market Revenue billion Forecast, by Country 2020 & 2033
- Table 18: Global Oil & Gas Pump Market Volume K Units Forecast, by Country 2020 & 2033
- Table 19: Global Oil & Gas Pump Market Revenue billion Forecast, by Type 2020 & 2033
- Table 20: Global Oil & Gas Pump Market Volume K Units Forecast, by Type 2020 & 2033
- Table 21: Global Oil & Gas Pump Market Revenue billion Forecast, by Application 2020 & 2033
- Table 22: Global Oil & Gas Pump Market Volume K Units Forecast, by Application 2020 & 2033
- Table 23: Global Oil & Gas Pump Market Revenue billion Forecast, by Country 2020 & 2033
- Table 24: Global Oil & Gas Pump Market Volume K Units Forecast, by Country 2020 & 2033
- Table 25: Global Oil & Gas Pump Market Revenue billion Forecast, by Type 2020 & 2033
- Table 26: Global Oil & Gas Pump Market Volume K Units Forecast, by Type 2020 & 2033
- Table 27: Global Oil & Gas Pump Market Revenue billion Forecast, by Application 2020 & 2033
- Table 28: Global Oil & Gas Pump Market Volume K Units Forecast, by Application 2020 & 2033
- Table 29: Global Oil & Gas Pump Market Revenue billion Forecast, by Country 2020 & 2033
- Table 30: Global Oil & Gas Pump Market Volume K Units Forecast, by Country 2020 & 2033
- Table 31: Global Oil & Gas Pump Market Revenue billion Forecast, by Type 2020 & 2033
- Table 32: Global Oil & Gas Pump Market Volume K Units Forecast, by Type 2020 & 2033
- Table 33: Global Oil & Gas Pump Market Revenue billion Forecast, by Application 2020 & 2033
- Table 34: Global Oil & Gas Pump Market Volume K Units Forecast, by Application 2020 & 2033
- Table 35: Global Oil & Gas Pump Market Revenue billion Forecast, by Country 2020 & 2033
- Table 36: Global Oil & Gas Pump Market Volume K Units Forecast, by Country 2020 & 2033
Frequently Asked Questions
1. What is the projected Compound Annual Growth Rate (CAGR) of the Oil & Gas Pump Market?
The projected CAGR is approximately 8.8%.
2. Which companies are prominent players in the Oil & Gas Pump Market?
Key companies in the market include Flowserve Corporation, Weir Group PLC, Xylem Inc, Grundfos Holding A/S, KSB SE & Co KGaA, ITT Inc, Baker Hughes Co, Sulzer AG, Alfa Laval AB, Gardner Denver Holdings Inc.
3. What are the main segments of the Oil & Gas Pump Market?
The market segments include Type, Application.
4. Can you provide details about the market size?
The market size is estimated to be USD 14.27 billion as of 2022.
5. What are some drivers contributing to market growth?
4.; Increasing Investments in Offshore Wind Power Projects4.; Supportive Government Policies.
6. What are the notable trends driving market growth?
Increasing Demand for Dynamic Pumps (Centrifugal pumps) from Refineries.
7. Are there any restraints impacting market growth?
4.; Increasing Adopting of Alternative Clean Energy Sources (Ex: Solar. Hydro).
8. Can you provide examples of recent developments in the market?
N/A
9. What pricing options are available for accessing the report?
Pricing options include single-user, multi-user, and enterprise licenses priced at USD 4750, USD 5250, and USD 8750 respectively.
10. Is the market size provided in terms of value or volume?
The market size is provided in terms of value, measured in billion and volume, measured in K Units.
11. Are there any specific market keywords associated with the report?
Yes, the market keyword associated with the report is "Oil & Gas Pump Market," which aids in identifying and referencing the specific market segment covered.
12. How do I determine which pricing option suits my needs best?
The pricing options vary based on user requirements and access needs. Individual users may opt for single-user licenses, while businesses requiring broader access may choose multi-user or enterprise licenses for cost-effective access to the report.
13. Are there any additional resources or data provided in the Oil & Gas Pump Market report?
While the report offers comprehensive insights, it's advisable to review the specific contents or supplementary materials provided to ascertain if additional resources or data are available.
14. How can I stay updated on further developments or reports in the Oil & Gas Pump Market?
To stay informed about further developments, trends, and reports in the Oil & Gas Pump Market, consider subscribing to industry newsletters, following relevant companies and organizations, or regularly checking reputable industry news sources and publications.
Methodology
Step 1 - Identification of Relevant Samples Size from Population Database


Step 2 - Approaches for Defining Global Market Size (Value, Volume* & Price*)

Note*: In applicable scenarios
Step 3 - Data Sources
Primary Research
- Web Analytics
- Survey Reports
- Research Institute
- Latest Research Reports
- Opinion Leaders
Secondary Research
- Annual Reports
- White Paper
- Latest Press Release
- Industry Association
- Paid Database
- Investor Presentations

Step 4 - Data Triangulation
Involves using different sources of information in order to increase the validity of a study
These sources are likely to be stakeholders in a program - participants, other researchers, program staff, other community members, and so on.
Then we put all data in single framework & apply various statistical tools to find out the dynamic on the market.
During the analysis stage, feedback from the stakeholder groups would be compared to determine areas of agreement as well as areas of divergence