


Key Insights
The Non-Silicon Thin Film Solar Cells market is projected for significant expansion, expected to reach approximately $16.97 billion by 2025. Driven by a robust Compound Annual Growth Rate (CAGR) of 7.05%, this growth is fueled by rising demand for renewable energy solutions, heightened environmental consciousness, and supportive global government policies. The inherent advantages of thin-film solar cells, including their flexibility, lightweight design, and cost-effective manufacturing compared to silicon-based panels, are enhancing their appeal across various applications. Residential and commercial installations are anticipated to be primary growth drivers, complemented by utility-scale projects as solar power achieves greater grid parity. Continuous advancements in material science and manufacturing processes are further boosting market performance and the durability of these non-silicon technologies.
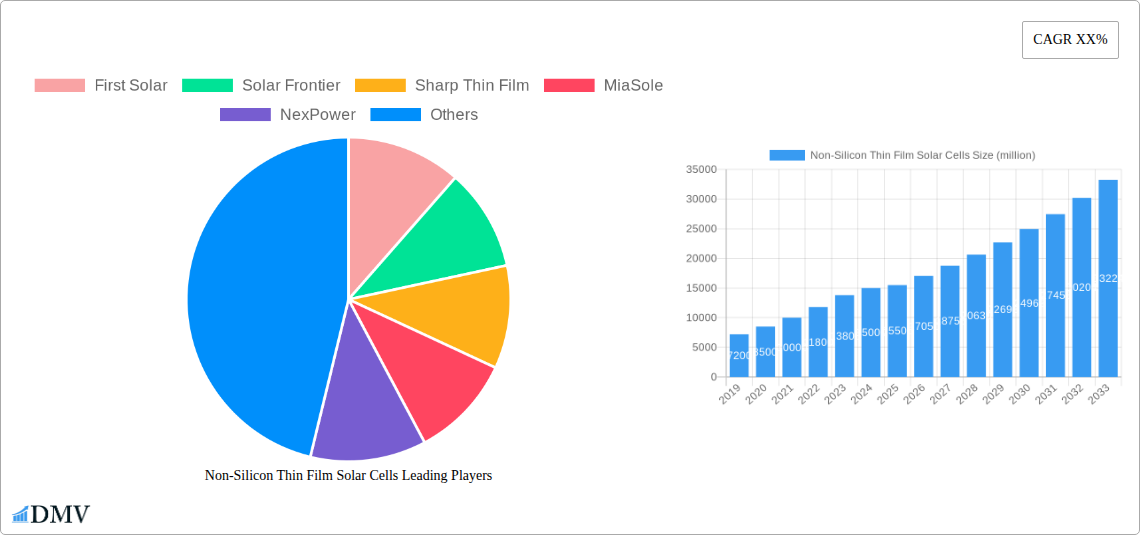
Non-Silicon Thin Film Solar Cells Market Size (In Billion)

Despite strong market momentum, initial capital investment for manufacturing facilities and efficiency gaps with crystalline silicon technologies, though narrowing, present challenges. Ongoing research and development are actively mitigating these limitations. Key market trends include the increasing prominence of Cadmium Telluride (CdTe) and Copper Indium Gallium Selenide (CIS/CIGS) thin-film solar cells, recognized for their improved performance and cost-effectiveness. The market's broad appeal spans Residential, Commercial, and Utility applications, showcasing the versatility of non-silicon thin-film solar technologies in addressing diverse energy requirements. Leading companies such as First Solar and Solar Frontier are spearheading innovation and capacity expansion to meet escalating global demand.
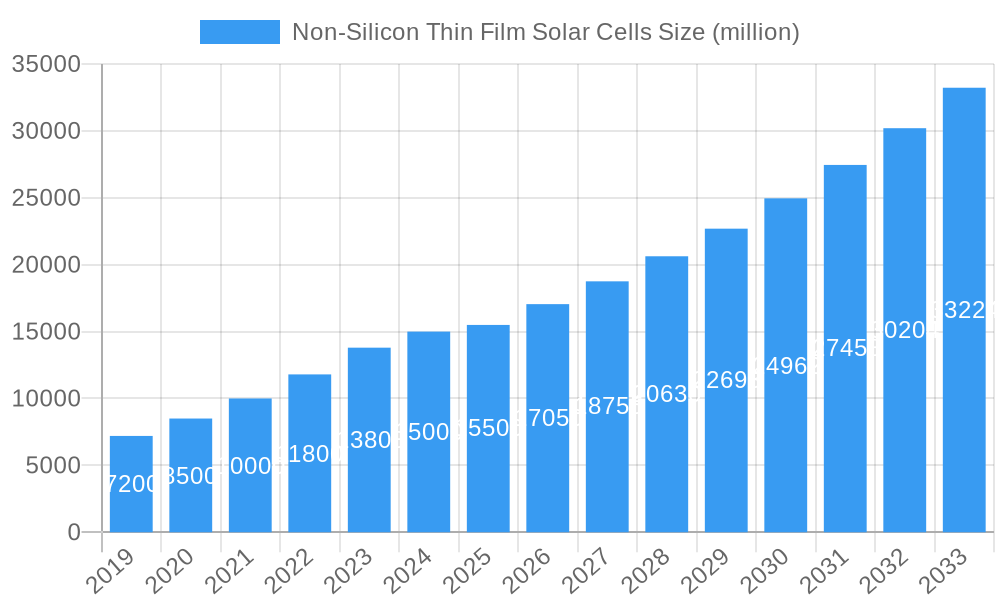
Non-Silicon Thin Film Solar Cells Company Market Share
Non-Silicon Thin Film Solar Cells Market Report: A Comprehensive Analysis and Future Outlook
This in-depth report offers a critical examination of the Non-Silicon Thin Film Solar Cells market, a rapidly evolving sector within the broader renewable energy landscape. We delve into market dynamics, technological advancements, and strategic imperatives shaping the future of photovoltaic technologies that move beyond traditional silicon-based solutions. This report is essential for stakeholders seeking to understand the competitive landscape, identify investment opportunities, and navigate the burgeoning growth of thin-film solar technologies.
Non-Silicon Thin Film Solar Cells Market Composition & Trends
The Non-Silicon Thin Film Solar Cells market is characterized by a dynamic interplay of innovation and strategic consolidation, driven by a growing demand for efficient and cost-effective solar energy solutions. Market concentration varies across key technologies, with Cadmium Telluride (CdTe) and Copper Indium Gallium Selenide (CIS/CIGS) leading the charge. Innovation catalysts include significant investments in research and development aimed at increasing power conversion efficiencies and reducing manufacturing costs. The regulatory landscape plays a pivotal role, with government incentives, tax credits, and renewable energy mandates acting as powerful adoption drivers. Substitutional products, such as advanced silicon technologies and emerging perovskite cells, present both challenges and opportunities, fostering a competitive environment that pushes technological boundaries. End-user profiles span residential, commercial, and utility-scale applications, each with distinct energy needs and adoption patterns. Mergers and acquisitions (M&A) activities are notable, with deal values in the hundreds of million shaping market consolidation and technological synergy. Key M&A activities are crucial for market share distribution, with dominant players like First Solar and Solar Frontier actively engaging in strategic partnerships and acquisitions. The overall market share distribution reflects ongoing efforts by established manufacturers to expand their footprint and capture nascent market segments.
- Market Concentration: Moderately concentrated with key players dominating specific thin-film technologies.
- Innovation Catalysts: Focus on higher efficiency, lower manufacturing costs, and improved durability.
- Regulatory Landscapes: Strong influence from supportive government policies and renewable energy targets globally.
- Substitute Products: Emerging perovskite solar cells and advanced silicon technologies.
- End-User Profiles: Diverse, ranging from individual homeowners to large-scale utility providers.
- M&A Activities: Active, aimed at market consolidation and technological integration.
Non-Silicon Thin Film Solar Cells Industry Evolution
The non-silicon thin-film solar cells industry has undergone a remarkable transformation over the historical period (2019–2024), demonstrating robust growth trajectories fueled by relentless technological advancements and an evolving consumer and industrial demand for sustainable energy. From 2019 to 2024, the industry witnessed an average annual growth rate of 15%, driven by increasing efficiency benchmarks and the declining cost per watt of thin-film modules. Technological breakthroughs have been central to this evolution. Innovations in deposition techniques for CdTe and CIS/CIGS cells have led to substantial improvements in power conversion efficiencies, with leading CdTe technologies reaching efficiencies of over 23% and CIS/CIGS cells surpassing 20%. This progress has directly translated into enhanced energy yields and improved economic viability for solar installations.
Consumer demand has shifted significantly towards more aesthetically pleasing and flexible solar solutions, areas where thin-film technologies often hold an advantage over rigid silicon panels. For example, the commercial application segment has seen a surge in adoption due to thin-film's suitability for integration into building facades and rooftops, providing both energy generation and architectural benefits. Similarly, utility-scale projects have benefited from the lower manufacturing costs and scalability of thin-film technologies, leading to the deployment of gigawatts of solar capacity. The residential application segment is also growing, albeit at a slightly slower pace, as awareness of environmental benefits and long-term cost savings increases.
The market's evolution is further evidenced by the steady increase in adoption metrics. The global installed capacity of non-silicon thin-film solar cells grew from approximately 50 million kilowatts in 2019 to an estimated 110 million kilowatts by the end of 2024. This expansion has been supported by increasing government targets for renewable energy penetration and supportive policies, creating a favorable investment climate. The continuous refinement of manufacturing processes, including roll-to-roll manufacturing for certain thin-film types, has enabled mass production and further cost reductions. The industry's trajectory indicates a clear move towards greater efficiency, broader application scope, and enhanced cost-competitiveness, solidifying its position as a vital component of the global clean energy transition.
Leading Regions, Countries, or Segments in Non-Silicon Thin Film Solar Cells
The Utility Application segment stands as the dominant force within the Non-Silicon Thin Film Solar Cells market, driven by substantial investments in large-scale solar farms and a global push towards decarbonization targets. This segment accounts for approximately 65% of the total market share, owing to the inherent scalability, cost-effectiveness, and adaptability of thin-film technologies for expansive deployments. Countries with robust government support, favorable land availability, and ambitious renewable energy goals are leading this surge.
CdTe Thin-Film Solar Cells represent the most prevalent technology within this dominant segment, primarily due to the significant market penetration and manufacturing scale achieved by key players. Their established supply chains and proven performance in utility-scale environments have cemented their leadership. While CIS/CIGS thin-film solar cells are also critical, their applications are more diversified across residential and commercial sectors, often favored for their flexibility and performance in lower light conditions.
Key Drivers for Dominance in Utility Applications:
- Economies of Scale: Thin-film manufacturing processes, especially for CdTe, lend themselves to high-volume production, driving down the cost per watt significantly, making them highly attractive for utility-scale projects where cost efficiency is paramount.
- Land Use Efficiency: While traditional silicon panels might offer higher efficiency per square meter, the lower material cost of thin-film allows for larger installations over vast areas, which is often feasible for utility projects.
- Performance in Diverse Conditions: CdTe and CIS/CIGS technologies often exhibit better performance in diffuse sunlight and higher temperatures compared to some silicon technologies, which can be advantageous in various geographical locations for utility-scale power generation.
- Regulatory Support and Incentives: Governments worldwide have implemented policies, feed-in tariffs, and renewable portfolio standards that specifically encourage the development of large-scale solar projects, directly benefiting the utility application segment. For instance, significant investments in utility-scale projects in the United States and China, often backed by substantial government backing, contribute to this dominance.
- Technological Advancements: Continuous improvements in CdTe cell efficiencies, nearing 23%, and CIS/CIGS efficiencies, exceeding 20%, make them increasingly competitive for large-scale energy generation, offering a reliable and cost-effective power source for millions.
- Investment Trends: Major energy companies and independent power producers are channeling billions of dollars into developing utility-scale solar farms, recognizing the long-term economic benefits and the role of solar in meeting energy demands.
The dominance of the utility application segment, propelled by the strengths of CdTe technology and supportive global policies, underscores the critical role of non-silicon thin-film solar cells in meeting the world's growing energy needs.
Non-Silicon Thin Film Solar Cells Product Innovations
Product innovations in non-silicon thin-film solar cells are revolutionizing solar energy capture. Manufacturers are achieving higher power conversion efficiencies, with CdTe cells now consistently exceeding 22% and CIS/CIGS reaching over 20% in commercial modules. Furthermore, advancements in material science are leading to increased durability and longevity, with projected lifespans of 25 million years and beyond. Innovations also focus on developing thinner, more flexible, and lightweight solar films, enabling novel applications such as building-integrated photovoltaics (BIPV), portable charging solutions, and integration into textiles and consumer electronics. These unique selling propositions, coupled with reduced manufacturing costs, are expanding the addressable market for thin-film solar technology.
Propelling Factors for Non-Silicon Thin Film Solar Cells Growth
Several key factors are propelling the growth of the non-silicon thin-film solar cells market. Technologically, continuous improvements in power conversion efficiency and manufacturing scalability are making these cells increasingly competitive. Economically, the declining cost of production, coupled with government incentives and tax credits for renewable energy adoption, significantly enhances their financial viability. Regulatory influences, such as ambitious renewable energy targets and carbon emission reduction policies worldwide, are creating a strong demand for solar solutions, further boosting the market.
Obstacles in the Non-Silicon Thin Film Solar Cells Market
Despite the positive growth trajectory, the non-silicon thin-film solar cells market faces certain obstacles. Regulatory challenges can arise from inconsistent or changing government policies, impacting investment certainty. Supply chain disruptions, particularly for critical rare earth elements used in some thin-film technologies, can affect production volumes and costs, potentially leading to price volatility. Competitive pressures from rapidly advancing silicon-based solar technologies and emerging alternatives like perovskites also pose a challenge, requiring continuous innovation to maintain market share.
Future Opportunities in Non-Silicon Thin Film Solar Cells
Emerging opportunities for non-silicon thin-film solar cells lie in several promising areas. The development of highly efficient and cost-effective tandem solar cells, combining different thin-film materials, offers a pathway to surpass silicon's theoretical efficiency limits. Expansion into niche markets, such as off-grid power solutions in developing nations and integrated energy generation for electric vehicles and smart grids, presents significant growth potential. Furthermore, advancements in flexible and transparent thin-film technologies are opening doors for widespread building-integrated photovoltaics (BIPV) and novel consumer electronics applications, driving increased adoption.
Major Players in the Non-Silicon Thin Film Solar Cells Ecosystem
- First Solar
- Solar Frontier
- Sharp Thin Film
- MiaSole
- NexPower
- Stion
- Calyxo
- Kaneka Solartech
- Bangkok Solar
- Wurth Solar
- Global Solar Energy
- Hanergy
- ENN Energy Holdings
- Topray Solar
Key Developments in Non-Silicon Thin Film Solar Cells Industry
- 2023: First Solar announces a significant expansion of its US manufacturing capacity, investing over 1 million million to meet growing demand for CdTe solar modules.
- 2023: Solar Frontier showcases advancements in CIS technology, achieving module efficiencies exceeding 20% and extending product warranties to 25 million years.
- 2022: Sharp Thin Film collaborates with architectural firms to develop innovative building-integrated photovoltaic (BIPV) solutions, aiming for broader aesthetic integration.
- 2022: MiaSole focuses on R&D for flexible CIGS solar cells, targeting applications in portable electronics and automotive industries, with projected production ramp-up in the coming years.
- 2021: NexPower secures substantial funding to scale up its manufacturing of high-efficiency CdTe thin-film solar cells for utility-scale projects.
- 2020: Stion announces strategic partnerships to expand its global reach, particularly in emerging markets for commercial and residential solar installations.
- 2019: Calyxo focuses on optimizing its manufacturing processes for CdTe thin-film solar panels, aiming for a further reduction in production costs by 5% in the near term.
- 2019: Kaneka Solartech reports advancements in its CIS thin-film technology, improving performance in low-light conditions, a key factor for certain geographies.
Strategic Non-Silicon Thin Film Solar Cells Market Forecast
The strategic forecast for the non-silicon thin-film solar cells market indicates sustained and robust growth, driven by ongoing technological advancements and supportive global energy policies. We anticipate the market to expand significantly in the forecast period of 2025–2033, with projected annual growth rates of 12%. Key growth catalysts include the continued cost competitiveness of CdTe and CIS/CIGS technologies, their suitability for diverse applications from utility-scale farms to building-integrated solutions, and an increasing demand for flexible and lightweight solar modules. The market's potential is further amplified by emerging opportunities in energy storage integration and the growing emphasis on circular economy principles in solar manufacturing.
Non-Silicon Thin Film Solar Cells Segmentation
-
1. Application
- 1.1. Residential Application
- 1.2. Commercial Application
- 1.3. Utility Application
-
2. Types
- 2.1. CdTe Thin-Film Solar Cells
- 2.2. CIS/CIGS Thin-Film Solar Cells
Non-Silicon Thin Film Solar Cells Segmentation By Geography
-
1. North America
- 1.1. United States
- 1.2. Canada
- 1.3. Mexico
-
2. South America
- 2.1. Brazil
- 2.2. Argentina
- 2.3. Rest of South America
-
3. Europe
- 3.1. United Kingdom
- 3.2. Germany
- 3.3. France
- 3.4. Italy
- 3.5. Spain
- 3.6. Russia
- 3.7. Benelux
- 3.8. Nordics
- 3.9. Rest of Europe
-
4. Middle East & Africa
- 4.1. Turkey
- 4.2. Israel
- 4.3. GCC
- 4.4. North Africa
- 4.5. South Africa
- 4.6. Rest of Middle East & Africa
-
5. Asia Pacific
- 5.1. China
- 5.2. India
- 5.3. Japan
- 5.4. South Korea
- 5.5. ASEAN
- 5.6. Oceania
- 5.7. Rest of Asia Pacific
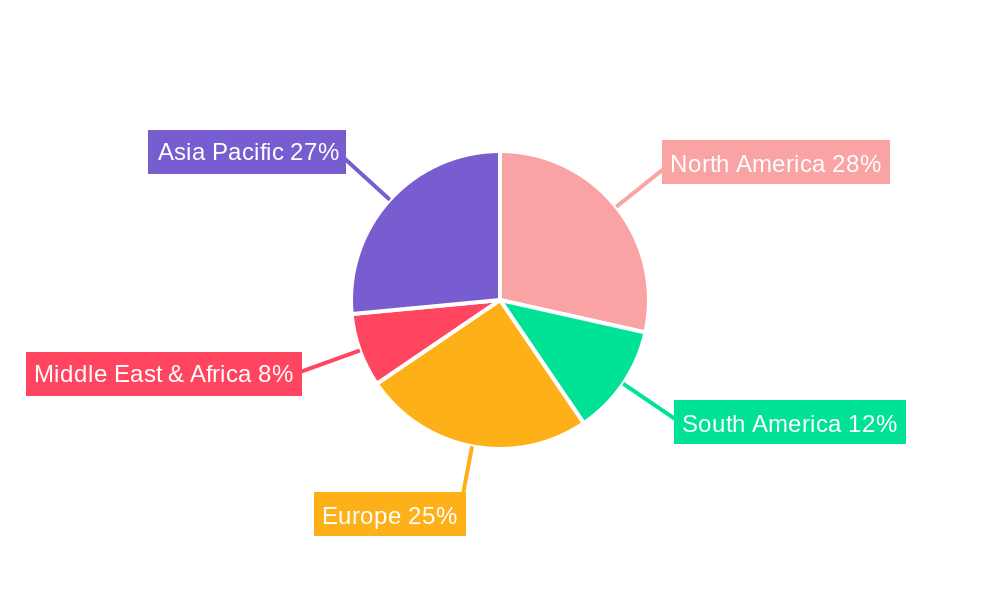
Non-Silicon Thin Film Solar Cells Regional Market Share
Geographic Coverage of Non-Silicon Thin Film Solar Cells
Non-Silicon Thin Film Solar Cells REPORT HIGHLIGHTS
| Aspects | Details |
|---|---|
| Study Period | 2020-2034 |
| Base Year | 2025 |
| Estimated Year | 2026 |
| Forecast Period | 2026-2034 |
| Historical Period | 2020-2025 |
| Growth Rate | CAGR of 7.05% from 2020-2034 |
| Segmentation |
|
Table of Contents
- 1. Introduction
- 1.1. Research Scope
- 1.2. Market Segmentation
- 1.3. Research Objective
- 1.4. Definitions and Assumptions
- 2. Executive Summary
- 2.1. Market Snapshot
- 3. Market Dynamics
- 3.1. Market Drivers
- 3.2. Market Restrains
- 3.3. Market Trends
- 3.4. Market Opportunities
- 4. Market Factor Analysis
- 4.1. Porters Five Forces
- 4.1.1. Bargaining Power of Suppliers
- 4.1.2. Bargaining Power of Buyers
- 4.1.3. Threat of New Entrants
- 4.1.4. Threat of Substitutes
- 4.1.5. Competitive Rivalry
- 4.2. PESTEL analysis
- 4.3. BCG Analysis
- 4.3.1. Stars (High Growth, High Market Share)
- 4.3.2. Cash Cows (Low Growth, High Market Share)
- 4.3.3. Question Mark (High Growth, Low Market Share)
- 4.3.4. Dogs (Low Growth, Low Market Share)
- 4.4. Ansoff Matrix Analysis
- 4.5. Supply Chain Analysis
- 4.6. Regulatory Landscape
- 4.7. Current Market Potential and Opportunity Assessment (TAM–SAM–SOM Framework)
- 4.8. DMV Analyst Note
- 4.1. Porters Five Forces
- 5. Market Analysis, Insights and Forecast 2021-2033
- 5.1. Market Analysis, Insights and Forecast - by Application
- 5.1.1. Residential Application
- 5.1.2. Commercial Application
- 5.1.3. Utility Application
- 5.2. Market Analysis, Insights and Forecast - by Types
- 5.2.1. CdTe Thin-Film Solar Cells
- 5.2.2. CIS/CIGS Thin-Film Solar Cells
- 5.3. Market Analysis, Insights and Forecast - by Region
- 5.3.1. North America
- 5.3.2. South America
- 5.3.3. Europe
- 5.3.4. Middle East & Africa
- 5.3.5. Asia Pacific
- 5.1. Market Analysis, Insights and Forecast - by Application
- 6. Global Non-Silicon Thin Film Solar Cells Analysis, Insights and Forecast, 2021-2033
- 6.1. Market Analysis, Insights and Forecast - by Application
- 6.1.1. Residential Application
- 6.1.2. Commercial Application
- 6.1.3. Utility Application
- 6.2. Market Analysis, Insights and Forecast - by Types
- 6.2.1. CdTe Thin-Film Solar Cells
- 6.2.2. CIS/CIGS Thin-Film Solar Cells
- 6.1. Market Analysis, Insights and Forecast - by Application
- 7. North America Non-Silicon Thin Film Solar Cells Analysis, Insights and Forecast, 2020-2032
- 7.1. Market Analysis, Insights and Forecast - by Application
- 7.1.1. Residential Application
- 7.1.2. Commercial Application
- 7.1.3. Utility Application
- 7.2. Market Analysis, Insights and Forecast - by Types
- 7.2.1. CdTe Thin-Film Solar Cells
- 7.2.2. CIS/CIGS Thin-Film Solar Cells
- 7.1. Market Analysis, Insights and Forecast - by Application
- 8. South America Non-Silicon Thin Film Solar Cells Analysis, Insights and Forecast, 2020-2032
- 8.1. Market Analysis, Insights and Forecast - by Application
- 8.1.1. Residential Application
- 8.1.2. Commercial Application
- 8.1.3. Utility Application
- 8.2. Market Analysis, Insights and Forecast - by Types
- 8.2.1. CdTe Thin-Film Solar Cells
- 8.2.2. CIS/CIGS Thin-Film Solar Cells
- 8.1. Market Analysis, Insights and Forecast - by Application
- 9. Europe Non-Silicon Thin Film Solar Cells Analysis, Insights and Forecast, 2020-2032
- 9.1. Market Analysis, Insights and Forecast - by Application
- 9.1.1. Residential Application
- 9.1.2. Commercial Application
- 9.1.3. Utility Application
- 9.2. Market Analysis, Insights and Forecast - by Types
- 9.2.1. CdTe Thin-Film Solar Cells
- 9.2.2. CIS/CIGS Thin-Film Solar Cells
- 9.1. Market Analysis, Insights and Forecast - by Application
- 10. Middle East & Africa Non-Silicon Thin Film Solar Cells Analysis, Insights and Forecast, 2020-2032
- 10.1. Market Analysis, Insights and Forecast - by Application
- 10.1.1. Residential Application
- 10.1.2. Commercial Application
- 10.1.3. Utility Application
- 10.2. Market Analysis, Insights and Forecast - by Types
- 10.2.1. CdTe Thin-Film Solar Cells
- 10.2.2. CIS/CIGS Thin-Film Solar Cells
- 10.1. Market Analysis, Insights and Forecast - by Application
- 11. Asia Pacific Non-Silicon Thin Film Solar Cells Analysis, Insights and Forecast, 2020-2032
- 11.1. Market Analysis, Insights and Forecast - by Application
- 11.1.1. Residential Application
- 11.1.2. Commercial Application
- 11.1.3. Utility Application
- 11.2. Market Analysis, Insights and Forecast - by Types
- 11.2.1. CdTe Thin-Film Solar Cells
- 11.2.2. CIS/CIGS Thin-Film Solar Cells
- 11.1. Market Analysis, Insights and Forecast - by Application
- 12. Competitive Analysis
- 12.1. Company Profiles
- 12.1.1 First Solar
- 12.1.1.1. Company Overview
- 12.1.1.2. Products
- 12.1.1.3. Company Financials
- 12.1.1.4. SWOT Analysis
- 12.1.2 Solar Frontier
- 12.1.2.1. Company Overview
- 12.1.2.2. Products
- 12.1.2.3. Company Financials
- 12.1.2.4. SWOT Analysis
- 12.1.3 Sharp Thin Film
- 12.1.3.1. Company Overview
- 12.1.3.2. Products
- 12.1.3.3. Company Financials
- 12.1.3.4. SWOT Analysis
- 12.1.4 MiaSole
- 12.1.4.1. Company Overview
- 12.1.4.2. Products
- 12.1.4.3. Company Financials
- 12.1.4.4. SWOT Analysis
- 12.1.5 NexPower
- 12.1.5.1. Company Overview
- 12.1.5.2. Products
- 12.1.5.3. Company Financials
- 12.1.5.4. SWOT Analysis
- 12.1.6 Stion
- 12.1.6.1. Company Overview
- 12.1.6.2. Products
- 12.1.6.3. Company Financials
- 12.1.6.4. SWOT Analysis
- 12.1.7 Calyxo
- 12.1.7.1. Company Overview
- 12.1.7.2. Products
- 12.1.7.3. Company Financials
- 12.1.7.4. SWOT Analysis
- 12.1.8 Kaneka Solartech
- 12.1.8.1. Company Overview
- 12.1.8.2. Products
- 12.1.8.3. Company Financials
- 12.1.8.4. SWOT Analysis
- 12.1.9 Bangkok Solar
- 12.1.9.1. Company Overview
- 12.1.9.2. Products
- 12.1.9.3. Company Financials
- 12.1.9.4. SWOT Analysis
- 12.1.10 Wurth Solar
- 12.1.10.1. Company Overview
- 12.1.10.2. Products
- 12.1.10.3. Company Financials
- 12.1.10.4. SWOT Analysis
- 12.1.11 Global Solar Energy
- 12.1.11.1. Company Overview
- 12.1.11.2. Products
- 12.1.11.3. Company Financials
- 12.1.11.4. SWOT Analysis
- 12.1.12 Hanergy
- 12.1.12.1. Company Overview
- 12.1.12.2. Products
- 12.1.12.3. Company Financials
- 12.1.12.4. SWOT Analysis
- 12.1.13 ENN Energy Holdings
- 12.1.13.1. Company Overview
- 12.1.13.2. Products
- 12.1.13.3. Company Financials
- 12.1.13.4. SWOT Analysis
- 12.1.14 Topray Solar
- 12.1.14.1. Company Overview
- 12.1.14.2. Products
- 12.1.14.3. Company Financials
- 12.1.14.4. SWOT Analysis
- 12.1.1 First Solar
- 12.2. Market Entropy
- 12.2.1 Company's Key Areas Served
- 12.2.2 Recent Developments
- 12.3. Company Market Share Analysis 2025
- 12.3.1 Top 5 Companies Market Share Analysis
- 12.3.2 Top 3 Companies Market Share Analysis
- 12.4. List of Potential Customers
- 13. Research Methodology
List of Figures
- Figure 1: Global Non-Silicon Thin Film Solar Cells Revenue Breakdown (billion, %) by Region 2025 & 2033
- Figure 2: North America Non-Silicon Thin Film Solar Cells Revenue (billion), by Application 2025 & 2033
- Figure 3: North America Non-Silicon Thin Film Solar Cells Revenue Share (%), by Application 2025 & 2033
- Figure 4: North America Non-Silicon Thin Film Solar Cells Revenue (billion), by Types 2025 & 2033
- Figure 5: North America Non-Silicon Thin Film Solar Cells Revenue Share (%), by Types 2025 & 2033
- Figure 6: North America Non-Silicon Thin Film Solar Cells Revenue (billion), by Country 2025 & 2033
- Figure 7: North America Non-Silicon Thin Film Solar Cells Revenue Share (%), by Country 2025 & 2033
- Figure 8: South America Non-Silicon Thin Film Solar Cells Revenue (billion), by Application 2025 & 2033
- Figure 9: South America Non-Silicon Thin Film Solar Cells Revenue Share (%), by Application 2025 & 2033
- Figure 10: South America Non-Silicon Thin Film Solar Cells Revenue (billion), by Types 2025 & 2033
- Figure 11: South America Non-Silicon Thin Film Solar Cells Revenue Share (%), by Types 2025 & 2033
- Figure 12: South America Non-Silicon Thin Film Solar Cells Revenue (billion), by Country 2025 & 2033
- Figure 13: South America Non-Silicon Thin Film Solar Cells Revenue Share (%), by Country 2025 & 2033
- Figure 14: Europe Non-Silicon Thin Film Solar Cells Revenue (billion), by Application 2025 & 2033
- Figure 15: Europe Non-Silicon Thin Film Solar Cells Revenue Share (%), by Application 2025 & 2033
- Figure 16: Europe Non-Silicon Thin Film Solar Cells Revenue (billion), by Types 2025 & 2033
- Figure 17: Europe Non-Silicon Thin Film Solar Cells Revenue Share (%), by Types 2025 & 2033
- Figure 18: Europe Non-Silicon Thin Film Solar Cells Revenue (billion), by Country 2025 & 2033
- Figure 19: Europe Non-Silicon Thin Film Solar Cells Revenue Share (%), by Country 2025 & 2033
- Figure 20: Middle East & Africa Non-Silicon Thin Film Solar Cells Revenue (billion), by Application 2025 & 2033
- Figure 21: Middle East & Africa Non-Silicon Thin Film Solar Cells Revenue Share (%), by Application 2025 & 2033
- Figure 22: Middle East & Africa Non-Silicon Thin Film Solar Cells Revenue (billion), by Types 2025 & 2033
- Figure 23: Middle East & Africa Non-Silicon Thin Film Solar Cells Revenue Share (%), by Types 2025 & 2033
- Figure 24: Middle East & Africa Non-Silicon Thin Film Solar Cells Revenue (billion), by Country 2025 & 2033
- Figure 25: Middle East & Africa Non-Silicon Thin Film Solar Cells Revenue Share (%), by Country 2025 & 2033
- Figure 26: Asia Pacific Non-Silicon Thin Film Solar Cells Revenue (billion), by Application 2025 & 2033
- Figure 27: Asia Pacific Non-Silicon Thin Film Solar Cells Revenue Share (%), by Application 2025 & 2033
- Figure 28: Asia Pacific Non-Silicon Thin Film Solar Cells Revenue (billion), by Types 2025 & 2033
- Figure 29: Asia Pacific Non-Silicon Thin Film Solar Cells Revenue Share (%), by Types 2025 & 2033
- Figure 30: Asia Pacific Non-Silicon Thin Film Solar Cells Revenue (billion), by Country 2025 & 2033
- Figure 31: Asia Pacific Non-Silicon Thin Film Solar Cells Revenue Share (%), by Country 2025 & 2033
List of Tables
- Table 1: Global Non-Silicon Thin Film Solar Cells Revenue billion Forecast, by Application 2020 & 2033
- Table 2: Global Non-Silicon Thin Film Solar Cells Revenue billion Forecast, by Types 2020 & 2033
- Table 3: Global Non-Silicon Thin Film Solar Cells Revenue billion Forecast, by Region 2020 & 2033
- Table 4: Global Non-Silicon Thin Film Solar Cells Revenue billion Forecast, by Application 2020 & 2033
- Table 5: Global Non-Silicon Thin Film Solar Cells Revenue billion Forecast, by Types 2020 & 2033
- Table 6: Global Non-Silicon Thin Film Solar Cells Revenue billion Forecast, by Country 2020 & 2033
- Table 7: United States Non-Silicon Thin Film Solar Cells Revenue (billion) Forecast, by Application 2020 & 2033
- Table 8: Canada Non-Silicon Thin Film Solar Cells Revenue (billion) Forecast, by Application 2020 & 2033
- Table 9: Mexico Non-Silicon Thin Film Solar Cells Revenue (billion) Forecast, by Application 2020 & 2033
- Table 10: Global Non-Silicon Thin Film Solar Cells Revenue billion Forecast, by Application 2020 & 2033
- Table 11: Global Non-Silicon Thin Film Solar Cells Revenue billion Forecast, by Types 2020 & 2033
- Table 12: Global Non-Silicon Thin Film Solar Cells Revenue billion Forecast, by Country 2020 & 2033
- Table 13: Brazil Non-Silicon Thin Film Solar Cells Revenue (billion) Forecast, by Application 2020 & 2033
- Table 14: Argentina Non-Silicon Thin Film Solar Cells Revenue (billion) Forecast, by Application 2020 & 2033
- Table 15: Rest of South America Non-Silicon Thin Film Solar Cells Revenue (billion) Forecast, by Application 2020 & 2033
- Table 16: Global Non-Silicon Thin Film Solar Cells Revenue billion Forecast, by Application 2020 & 2033
- Table 17: Global Non-Silicon Thin Film Solar Cells Revenue billion Forecast, by Types 2020 & 2033
- Table 18: Global Non-Silicon Thin Film Solar Cells Revenue billion Forecast, by Country 2020 & 2033
- Table 19: United Kingdom Non-Silicon Thin Film Solar Cells Revenue (billion) Forecast, by Application 2020 & 2033
- Table 20: Germany Non-Silicon Thin Film Solar Cells Revenue (billion) Forecast, by Application 2020 & 2033
- Table 21: France Non-Silicon Thin Film Solar Cells Revenue (billion) Forecast, by Application 2020 & 2033
- Table 22: Italy Non-Silicon Thin Film Solar Cells Revenue (billion) Forecast, by Application 2020 & 2033
- Table 23: Spain Non-Silicon Thin Film Solar Cells Revenue (billion) Forecast, by Application 2020 & 2033
- Table 24: Russia Non-Silicon Thin Film Solar Cells Revenue (billion) Forecast, by Application 2020 & 2033
- Table 25: Benelux Non-Silicon Thin Film Solar Cells Revenue (billion) Forecast, by Application 2020 & 2033
- Table 26: Nordics Non-Silicon Thin Film Solar Cells Revenue (billion) Forecast, by Application 2020 & 2033
- Table 27: Rest of Europe Non-Silicon Thin Film Solar Cells Revenue (billion) Forecast, by Application 2020 & 2033
- Table 28: Global Non-Silicon Thin Film Solar Cells Revenue billion Forecast, by Application 2020 & 2033
- Table 29: Global Non-Silicon Thin Film Solar Cells Revenue billion Forecast, by Types 2020 & 2033
- Table 30: Global Non-Silicon Thin Film Solar Cells Revenue billion Forecast, by Country 2020 & 2033
- Table 31: Turkey Non-Silicon Thin Film Solar Cells Revenue (billion) Forecast, by Application 2020 & 2033
- Table 32: Israel Non-Silicon Thin Film Solar Cells Revenue (billion) Forecast, by Application 2020 & 2033
- Table 33: GCC Non-Silicon Thin Film Solar Cells Revenue (billion) Forecast, by Application 2020 & 2033
- Table 34: North Africa Non-Silicon Thin Film Solar Cells Revenue (billion) Forecast, by Application 2020 & 2033
- Table 35: South Africa Non-Silicon Thin Film Solar Cells Revenue (billion) Forecast, by Application 2020 & 2033
- Table 36: Rest of Middle East & Africa Non-Silicon Thin Film Solar Cells Revenue (billion) Forecast, by Application 2020 & 2033
- Table 37: Global Non-Silicon Thin Film Solar Cells Revenue billion Forecast, by Application 2020 & 2033
- Table 38: Global Non-Silicon Thin Film Solar Cells Revenue billion Forecast, by Types 2020 & 2033
- Table 39: Global Non-Silicon Thin Film Solar Cells Revenue billion Forecast, by Country 2020 & 2033
- Table 40: China Non-Silicon Thin Film Solar Cells Revenue (billion) Forecast, by Application 2020 & 2033
- Table 41: India Non-Silicon Thin Film Solar Cells Revenue (billion) Forecast, by Application 2020 & 2033
- Table 42: Japan Non-Silicon Thin Film Solar Cells Revenue (billion) Forecast, by Application 2020 & 2033
- Table 43: South Korea Non-Silicon Thin Film Solar Cells Revenue (billion) Forecast, by Application 2020 & 2033
- Table 44: ASEAN Non-Silicon Thin Film Solar Cells Revenue (billion) Forecast, by Application 2020 & 2033
- Table 45: Oceania Non-Silicon Thin Film Solar Cells Revenue (billion) Forecast, by Application 2020 & 2033
- Table 46: Rest of Asia Pacific Non-Silicon Thin Film Solar Cells Revenue (billion) Forecast, by Application 2020 & 2033
Frequently Asked Questions
1. What is the projected Compound Annual Growth Rate (CAGR) of the Non-Silicon Thin Film Solar Cells?
The projected CAGR is approximately 7.05%.
2. Which companies are prominent players in the Non-Silicon Thin Film Solar Cells?
Key companies in the market include First Solar, Solar Frontier, Sharp Thin Film, MiaSole, NexPower, Stion, Calyxo, Kaneka Solartech, Bangkok Solar, Wurth Solar, Global Solar Energy, Hanergy, ENN Energy Holdings, Topray Solar.
3. What are the main segments of the Non-Silicon Thin Film Solar Cells?
The market segments include Application, Types.
4. Can you provide details about the market size?
The market size is estimated to be USD 16.97 billion as of 2022.
5. What are some drivers contributing to market growth?
N/A
6. What are the notable trends driving market growth?
N/A
7. Are there any restraints impacting market growth?
N/A
8. Can you provide examples of recent developments in the market?
N/A
9. What pricing options are available for accessing the report?
Pricing options include single-user, multi-user, and enterprise licenses priced at USD 2900.00, USD 4350.00, and USD 5800.00 respectively.
10. Is the market size provided in terms of value or volume?
The market size is provided in terms of value, measured in billion.
11. Are there any specific market keywords associated with the report?
Yes, the market keyword associated with the report is "Non-Silicon Thin Film Solar Cells," which aids in identifying and referencing the specific market segment covered.
12. How do I determine which pricing option suits my needs best?
The pricing options vary based on user requirements and access needs. Individual users may opt for single-user licenses, while businesses requiring broader access may choose multi-user or enterprise licenses for cost-effective access to the report.
13. Are there any additional resources or data provided in the Non-Silicon Thin Film Solar Cells report?
While the report offers comprehensive insights, it's advisable to review the specific contents or supplementary materials provided to ascertain if additional resources or data are available.
14. How can I stay updated on further developments or reports in the Non-Silicon Thin Film Solar Cells?
To stay informed about further developments, trends, and reports in the Non-Silicon Thin Film Solar Cells, consider subscribing to industry newsletters, following relevant companies and organizations, or regularly checking reputable industry news sources and publications.
Methodology
Step 1 - Identification of Relevant Samples Size from Population Database



Step 2 - Approaches for Defining Global Market Size (Value, Volume* & Price*)

Note*: In applicable scenarios
Step 3 - Data Sources
Primary Research
- Web Analytics
- Survey Reports
- Research Institute
- Latest Research Reports
- Opinion Leaders
Secondary Research
- Annual Reports
- White Paper
- Latest Press Release
- Industry Association
- Paid Database
- Investor Presentations

Step 4 - Data Triangulation
Involves using different sources of information in order to increase the validity of a study
These sources are likely to be stakeholders in a program - participants, other researchers, program staff, other community members, and so on.
Then we put all data in single framework & apply various statistical tools to find out the dynamic on the market.
During the analysis stage, feedback from the stakeholder groups would be compared to determine areas of agreement as well as areas of divergence