


Key Insights
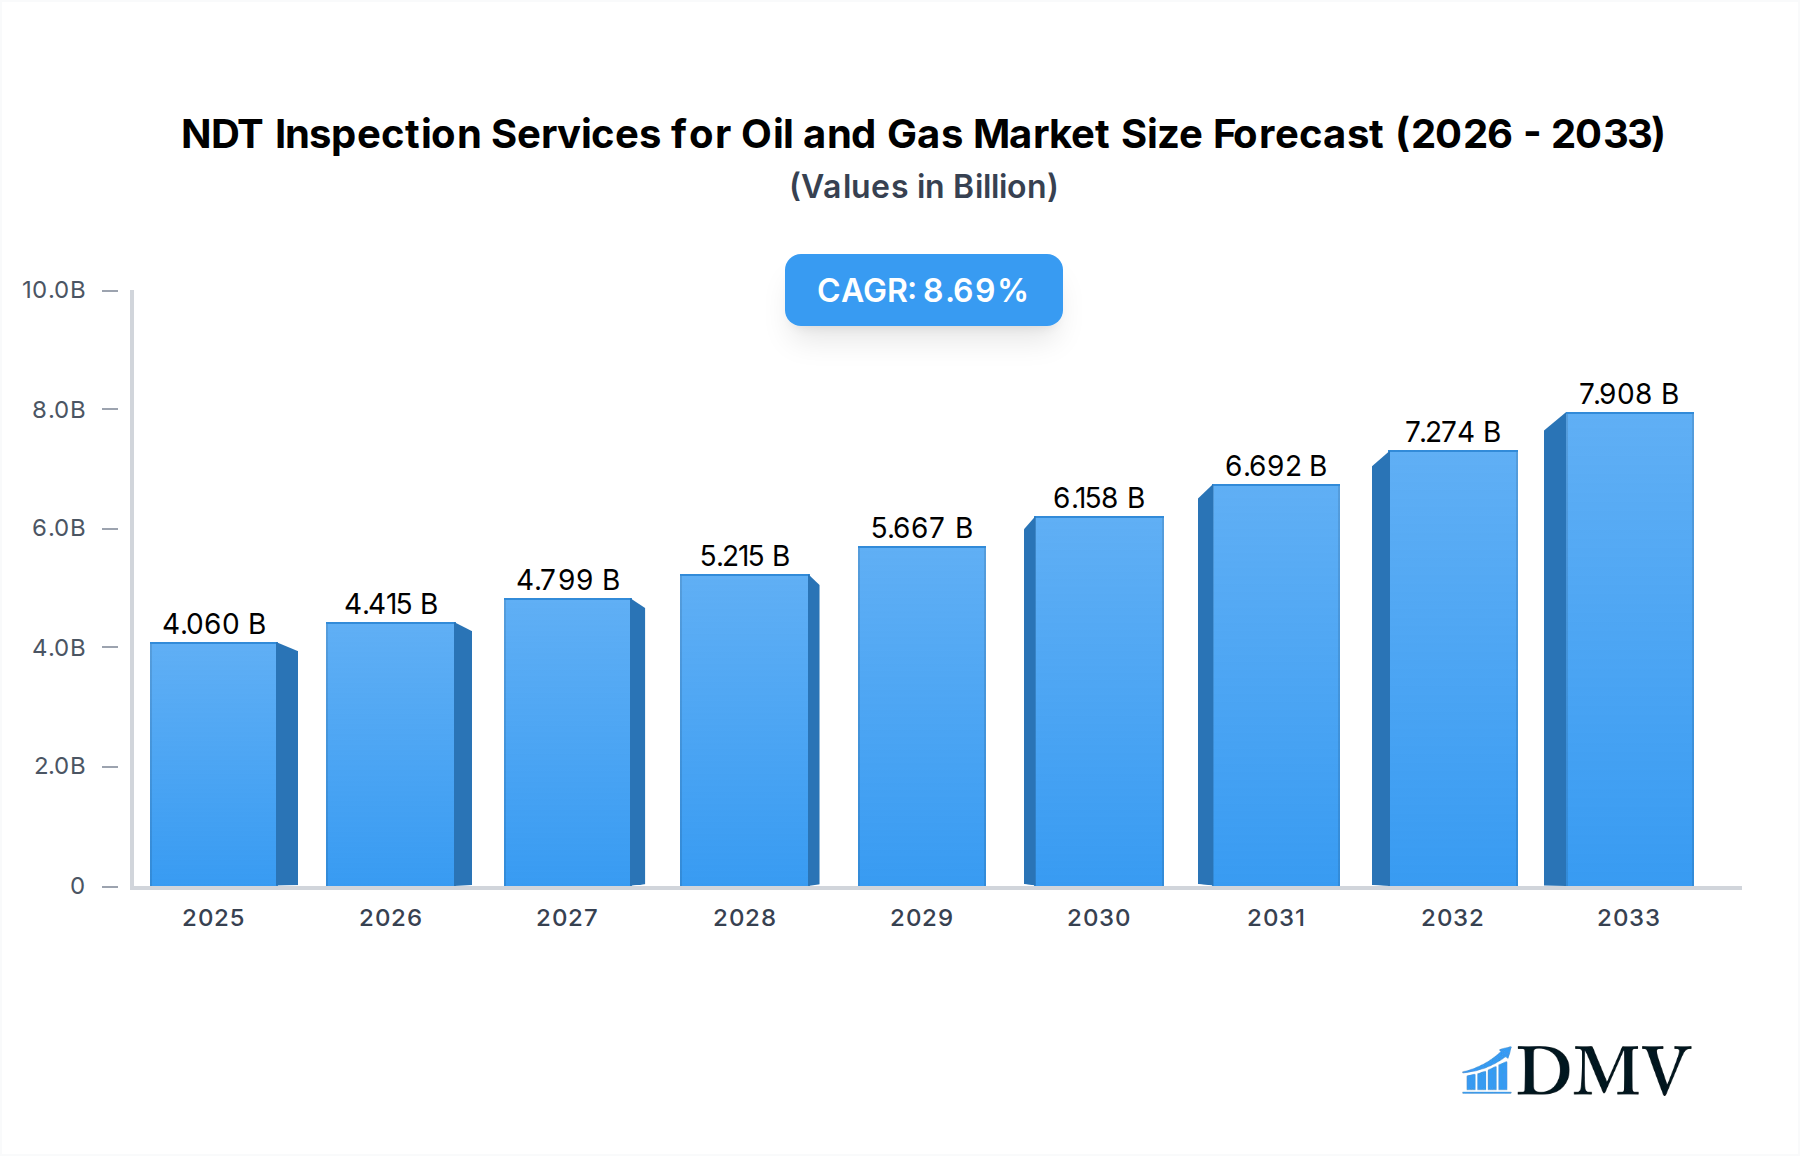
The global NDT Inspection Services for Oil and Gas market is poised for significant expansion, projected to reach an estimated $4.06 billion in 2025, and is expected to witness a robust Compound Annual Growth Rate (CAGR) of 8.8% through 2033. This upward trajectory is primarily driven by the increasing demand for enhanced safety regulations and operational efficiency across the oil and gas value chain. The industry faces stringent compliance mandates aimed at preventing critical failures in exploration, production, and transportation infrastructure, making non-destructive testing (NDT) services indispensable for asset integrity management. Furthermore, the growing complexity of offshore and unconventional oil and gas exploration, coupled with the aging infrastructure requiring continuous monitoring and maintenance, are key factors propelling market growth. Technological advancements in NDT methods, such as the integration of artificial intelligence and robotics for automated inspections, are also contributing to the market's dynamism by offering faster, more accurate, and cost-effective solutions.
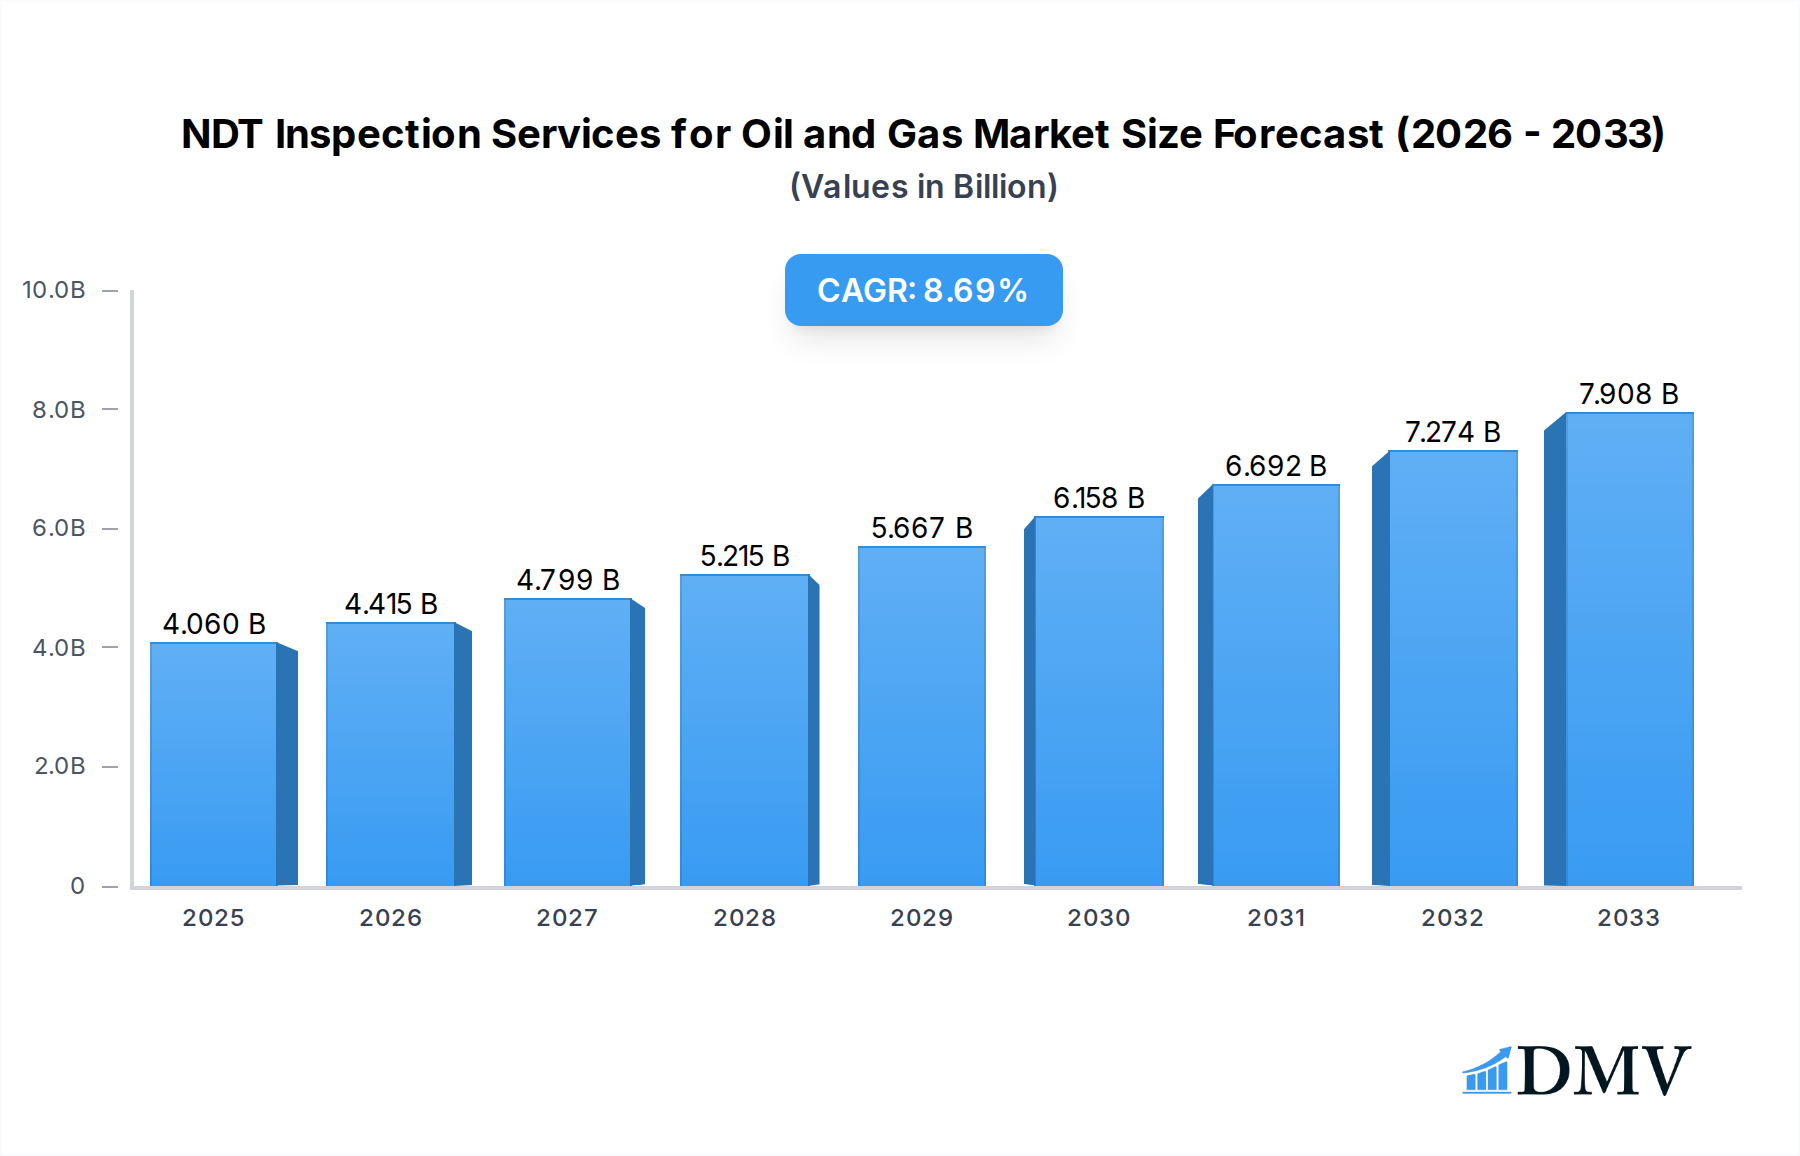
NDT Inspection Services for Oil and Gas Market Size (In Billion)

The market is segmented by application into the Petroleum Industry and Natural Gas Industry, with both showing consistent demand for comprehensive inspection services. Types of NDT methods, including Electromagnetic Testing (ET), Laser Test Method (LM), Radiographic Testing (RT), and Ultrasonic Testing (UT), are integral to ensuring the integrity of pipelines, storage tanks, and drilling equipment. Geographically, North America and Europe are anticipated to remain dominant markets due to established oil and gas infrastructure and stringent safety standards. However, the Asia Pacific region, with its burgeoning energy demand and increasing investment in exploration and production, presents substantial growth opportunities. Key restraints include the high initial investment costs associated with advanced NDT equipment and the availability of skilled personnel to operate sophisticated technologies. Despite these challenges, the overarching need for risk mitigation and operational reliability in the oil and gas sector ensures a strong and sustained demand for NDT inspection services.
NDT Inspection Services for Oil and Gas Company Market Share
This comprehensive NDT Inspection Services for Oil and Gas Market Report provides an in-depth analysis of the global industry, encompassing the Petroleum Industry, Natural Gas Industry, and other related sectors. Spanning a Study Period of 2019–2033, with a Base Year of 2025 and a Forecast Period of 2025–2033, this report offers critical insights for stakeholders seeking to understand market dynamics, technological advancements, and growth opportunities. We cover leading NDT methods, including Electromagnetic Testing (ET), Laser Test Method (LM), Radiographic Testing (RT), and Ultrasonic Testing (UT). Our analysis is supported by an extensive Historical Period of 2019–2024, detailing market trends and evolution. This report is designed for immediate use, requiring no further modification, and offers precise data for strategic decision-making within the oil and gas inspection services landscape.
NDT Inspection Services for Oil and Gas Market Composition & Trends
The NDT inspection services for oil and gas market is characterized by a moderate level of concentration, with key players investing heavily in innovation and research and development to maintain a competitive edge. Catalysts for this innovation include the increasing demand for enhanced safety protocols, the need for proactive asset integrity management, and the drive towards operational efficiency in the upstream, midstream, and downstream sectors. Regulatory landscapes are continuously evolving, with stricter environmental and safety compliance mandates shaping service offerings and market entry barriers. While substitute products exist, the specialized nature and critical importance of NDT services in ensuring the reliability and safety of oil and gas infrastructure significantly limit their widespread adoption. End-user profiles vary from large integrated oil companies to independent exploration and production firms, all requiring tailored inspection solutions. Mergers and acquisitions (M&A) activity is a significant trend, with companies like Applus+ and SGS actively consolidating market share. The total value of M&A deals in this sector is estimated to reach XXX billion over the forecast period, reflecting strategic moves to expand service portfolios and geographical reach.
- Market Share Distribution: Dominated by a few key players, with a gradual increase in market share for specialized service providers.
- Innovation Catalysts: Stricter regulations, asset lifecycle management, and efficiency demands.
- Regulatory Landscapes: Growing emphasis on environmental protection and operational safety standards.
- Substitute Products: Limited impact due to the highly specialized and critical nature of NDT.
- End-User Profiles: Integrated oil majors, national oil companies, independent E&P, and midstream operators.
- M&A Activities: Strategic acquisitions to enhance capabilities and market presence.
NDT Inspection Services for Oil and Gas Industry Evolution
The NDT inspection services for oil and gas industry has witnessed a dynamic evolution driven by a confluence of technological advancements, stringent safety regulations, and the ever-present need for efficient asset integrity management. Over the historical period of 2019–2024, the market experienced a steady growth trajectory, fueled by increased exploration and production activities globally, particularly in regions with aging infrastructure requiring frequent and advanced inspection. The adoption of digital technologies has been a significant disruptor and enabler, with the integration of Artificial Intelligence (AI) and Machine Learning (ML) in data analysis and interpretation enhancing the precision and speed of NDT assessments. Remote sensing technologies, drone-based inspections, and the Internet of Things (IoT) have revolutionized how inspections are conducted, enabling safer, more cost-effective, and less intrusive assessments. The shift towards predictive maintenance strategies, moving away from traditional time-based inspections, has further propelled the demand for sophisticated NDT solutions capable of identifying potential failures before they occur.
The forecast period (2025–2033) is poised for accelerated growth, with an anticipated compound annual growth rate (CAGR) of XX.XX%. This growth will be underpinned by substantial investments in renewable energy infrastructure, including pipelines for hydrogen and carbon capture technologies, which will necessitate specialized NDT services. The increasing complexity of oil and gas extraction processes, such as deep-water exploration and unconventional resource development, also demands advanced NDT techniques to ensure operational safety and environmental compliance. Furthermore, evolving industry standards and certifications by bodies like API and ASME are continuously raising the bar for inspection quality, driving demand for cutting-edge NDT equipment and expertise. Companies are increasingly focusing on integrated solutions that combine various NDT methods with advanced analytics, offering a holistic approach to asset integrity. The market for advanced NDT techniques like phased array ultrasonic testing (PAUT), eddy current array (ECA), and guided wave testing (GWT) is expected to grow robustly. The digitalization of NDT, including cloud-based data management and reporting, will also play a pivotal role in shaping the industry's future, improving workflow efficiency and data accessibility. The commitment to sustainability and reducing the environmental footprint of oil and gas operations will further incentivize the adoption of NDT services that minimize downtime and prevent leaks or failures. The market is projected to reach a valuation of XXX billion by 2033.
Leading Regions, Countries, or Segments in NDT Inspection Services for Oil and Gas
The Petroleum Industry segment stands as the dominant force within the NDT inspection services for oil and gas market, driven by its extensive infrastructure, continuous exploration and production activities, and the critical need for ensuring the integrity of complex operational assets. Within this segment, Ultrasonic Testing (UT) emerges as the most widely adopted and crucial NDT method, accounting for an estimated XX% of the total market share. Its versatility, accuracy, and suitability for detecting internal flaws in pipelines, vessels, and structural components make it indispensable. The United States is projected to be the leading country, propelled by its vast and mature oil and gas industry, significant investment in infrastructure upgrades, and a robust regulatory framework mandating stringent safety and environmental standards.
The dominance of the Petroleum Industry is further amplified by:
- Extensive Pipeline Networks: The sheer volume of oil and gas pipelines requiring regular inspection and integrity monitoring is unparalleled, making UT and RT essential.
- Offshore Exploration and Production: The demanding environment of offshore operations necessitates highly reliable and advanced NDT methods to ensure the safety of personnel and the environment.
- Refinery and Petrochemical Operations: These facilities operate under high pressure and temperature conditions, demanding continuous monitoring and inspection of critical equipment.
Ultrasonic Testing (UT) leads due to:
- Versatility: Applicable to a wide range of materials and flaw types, including corrosion, erosion, and cracks.
- Accuracy and Sensitivity: Capable of detecting very small flaws with high precision.
- Portability and Ease of Use: Equipment is relatively portable, allowing for efficient inspections in various operational settings.
- Cost-Effectiveness: Offers a good balance of performance and cost compared to some other advanced methods.
While the Petroleum Industry and UT lead, the Natural Gas Industry is a significant and growing contributor, particularly with the expansion of LNG infrastructure and the increasing demand for natural gas as a transitional fuel. Electromagnetic Testing (ET) is also gaining traction, especially in the inspection of coated pipelines and for surface defect detection, projected to capture XX% of the market. Regions like the Middle East and Asia-Pacific are showing substantial growth, driven by new exploration projects and the development of energy infrastructure.
NDT Inspection Services for Oil and Gas Product Innovations
Recent product innovations in NDT inspection services for oil and gas are significantly enhancing efficiency and safety. The introduction of advanced phased array ultrasonic units with improved imaging capabilities and faster data acquisition is a key development. These systems, offered by companies like Zetec, enable more comprehensive volumetric inspection of complex geometries. Furthermore, the integration of AI-powered software for automated defect recognition and data analysis is revolutionizing the interpretation of inspection results, reducing human error and accelerating reporting. Laser-based inspection methods are also emerging for high-precision surface metrology and deformation analysis. These innovations offer unique selling propositions by providing deeper insights into asset integrity, reducing inspection time, and ultimately lowering operational costs.
Propelling Factors for NDT Inspection Services for Oil and Gas Growth
Several key factors are propelling the growth of the NDT inspection services for oil and gas market. The increasing global demand for oil and gas necessitates the maintenance and expansion of existing infrastructure, driving the need for regular and advanced inspections. Stricter governmental regulations and environmental mandates concerning safety and leak prevention are compelling companies to invest more in NDT services. Technological advancements, such as the development of more sophisticated and portable inspection equipment, alongside the adoption of digital solutions like AI and drone technology, are enhancing inspection efficiency and effectiveness. Furthermore, the aging global oil and gas infrastructure requires constant monitoring and maintenance to prevent failures, creating a sustained demand for comprehensive NDT solutions.
- Growing Energy Demand: Sustained global consumption of oil and gas requires robust infrastructure maintenance.
- Stringent Regulatory Compliance: Enhanced safety and environmental standards mandate frequent and thorough inspections.
- Technological Advancements: Innovations in NDT equipment and digital integration improve performance and cost-efficiency.
- Aging Infrastructure: The need to manage and extend the life of existing oil and gas assets fuels demand.
Obstacles in the NDT Inspection Services for Oil and Gas Market
Despite robust growth prospects, the NDT inspection services for oil and gas market faces several obstacles. The high initial cost of advanced NDT equipment and training can be a significant barrier for smaller companies. Geopolitical instability in key oil-producing regions can disrupt operations and investments, impacting service demand. Furthermore, the availability of skilled NDT technicians remains a challenge, with a persistent shortage of qualified personnel. Supply chain disruptions, particularly for specialized components and equipment, can lead to project delays and increased costs. The complex and ever-evolving regulatory landscape can also pose compliance challenges, requiring continuous adaptation and investment.
- High Capital Investment: The cost of sophisticated NDT equipment can be prohibitive for some.
- Skilled Workforce Shortage: A global lack of certified and experienced NDT professionals.
- Geopolitical Instability: Disruptions in oil-producing regions can impact market demand.
- Regulatory Complexity: Navigating diverse and changing international regulations.
Future Opportunities in NDT Inspection Services for Oil and Gas
Emerging opportunities in the NDT inspection services for oil and gas market are abundant, particularly in the realm of digital transformation and sustainability. The increasing focus on renewable energy sources and the transition to cleaner fuels present new avenues for NDT services, such as inspecting infrastructure for hydrogen transport and carbon capture facilities. The continued adoption of AI, machine learning, and big data analytics offers opportunities for predictive maintenance solutions, moving beyond reactive inspections to proactive asset management. Furthermore, the development of novel NDT techniques and miniaturized, drone-deployable inspection tools will open up new markets and enhance accessibility to previously hard-to-reach areas. Expansion into emerging economies with developing oil and gas sectors also presents significant growth potential.
- Renewable Energy Infrastructure: Inspection needs for hydrogen pipelines and CCS facilities.
- Digital NDT Solutions: AI-driven analytics and predictive maintenance.
- Emerging Markets: Growth opportunities in developing oil and gas regions.
- Advanced NDT Technologies: Innovations in automated and miniaturized inspection tools.
Major Players in the NDT Inspection Services for Oil and Gas Ecosystem
- Applus+
- SGS
- Zetec
- U.S. Inspection & NDT, LLC
- Amerapex
- NDT Global Inc
- Advantage NDT Supplies Ltd
- TesTex NDT India Pvt Ltd
- Morgan Ward
- Nikham Offshore
- BNN Oil and Gas Limited
Key Developments in NDT Inspection Services for Oil and Gas Industry
- 2023: NDT Global Inc. launched a new advanced ultrasonic testing system for long-range pipeline inspection.
- 2023: Applus+ acquired a leading NDT service provider in the Middle East to expand its regional footprint.
- 2024: Zetec introduced an AI-powered software solution for automated analysis of phased array ultrasonic data.
- 2024: U.S. Inspection & NDT, LLC expanded its service offerings to include advanced drone-based inspection for offshore platforms.
- 2024: SGS partnered with a technology firm to develop real-time, IoT-enabled NDT monitoring solutions.
- 2025: Amerapex announced significant investment in R&D for new Eddy Current Array technologies.
- 2025: Advantage NDT Supplies Ltd reported a surge in demand for portable RT equipment for field inspections.
- 2025: TesTex NDT India Pvt Ltd received certification for its advanced magnetic flux leakage (MFL) inspection services.
- 2025: Morgan Ward expanded its training programs to address the growing demand for skilled NDT technicians.
- 2025: Nikham Offshore introduced specialized NDT solutions for subsea pipeline integrity.
- 2025: BNN Oil and Gas Limited reported a substantial increase in demand for comprehensive inspection packages.
Strategic NDT Inspection Services for Oil and Gas Market Forecast
The strategic outlook for the NDT inspection services for oil and gas market is highly positive, fueled by an increasing emphasis on asset integrity, safety, and environmental stewardship. The ongoing digital transformation, incorporating AI and IoT, will drive significant growth in predictive maintenance and automated inspection solutions, enhancing operational efficiency and cost savings. The transition towards cleaner energy sources and the development of new energy infrastructure will create novel demand for specialized NDT services. Furthermore, a growing global awareness of the importance of reliable energy infrastructure will ensure sustained investment in robust inspection programs, making this market a critical component of the future energy landscape.
NDT Inspection Services for Oil and Gas Segmentation
-
1. Application
- 1.1. Petroleum Industry
- 1.2. Natural Gas Industry
- 1.3. Others
-
2. Types
- 2.1. Electromagnetic Testing (ET)
- 2.2. Laser Test Method (LM)
- 2.3. Radiographic Testing (RT)
- 2.4. Ultrasonic Testing (UT)
NDT Inspection Services for Oil and Gas Segmentation By Geography
-
1. North America
- 1.1. United States
- 1.2. Canada
- 1.3. Mexico
-
2. South America
- 2.1. Brazil
- 2.2. Argentina
- 2.3. Rest of South America
-
3. Europe
- 3.1. United Kingdom
- 3.2. Germany
- 3.3. France
- 3.4. Italy
- 3.5. Spain
- 3.6. Russia
- 3.7. Benelux
- 3.8. Nordics
- 3.9. Rest of Europe
-
4. Middle East & Africa
- 4.1. Turkey
- 4.2. Israel
- 4.3. GCC
- 4.4. North Africa
- 4.5. South Africa
- 4.6. Rest of Middle East & Africa
-
5. Asia Pacific
- 5.1. China
- 5.2. India
- 5.3. Japan
- 5.4. South Korea
- 5.5. ASEAN
- 5.6. Oceania
- 5.7. Rest of Asia Pacific
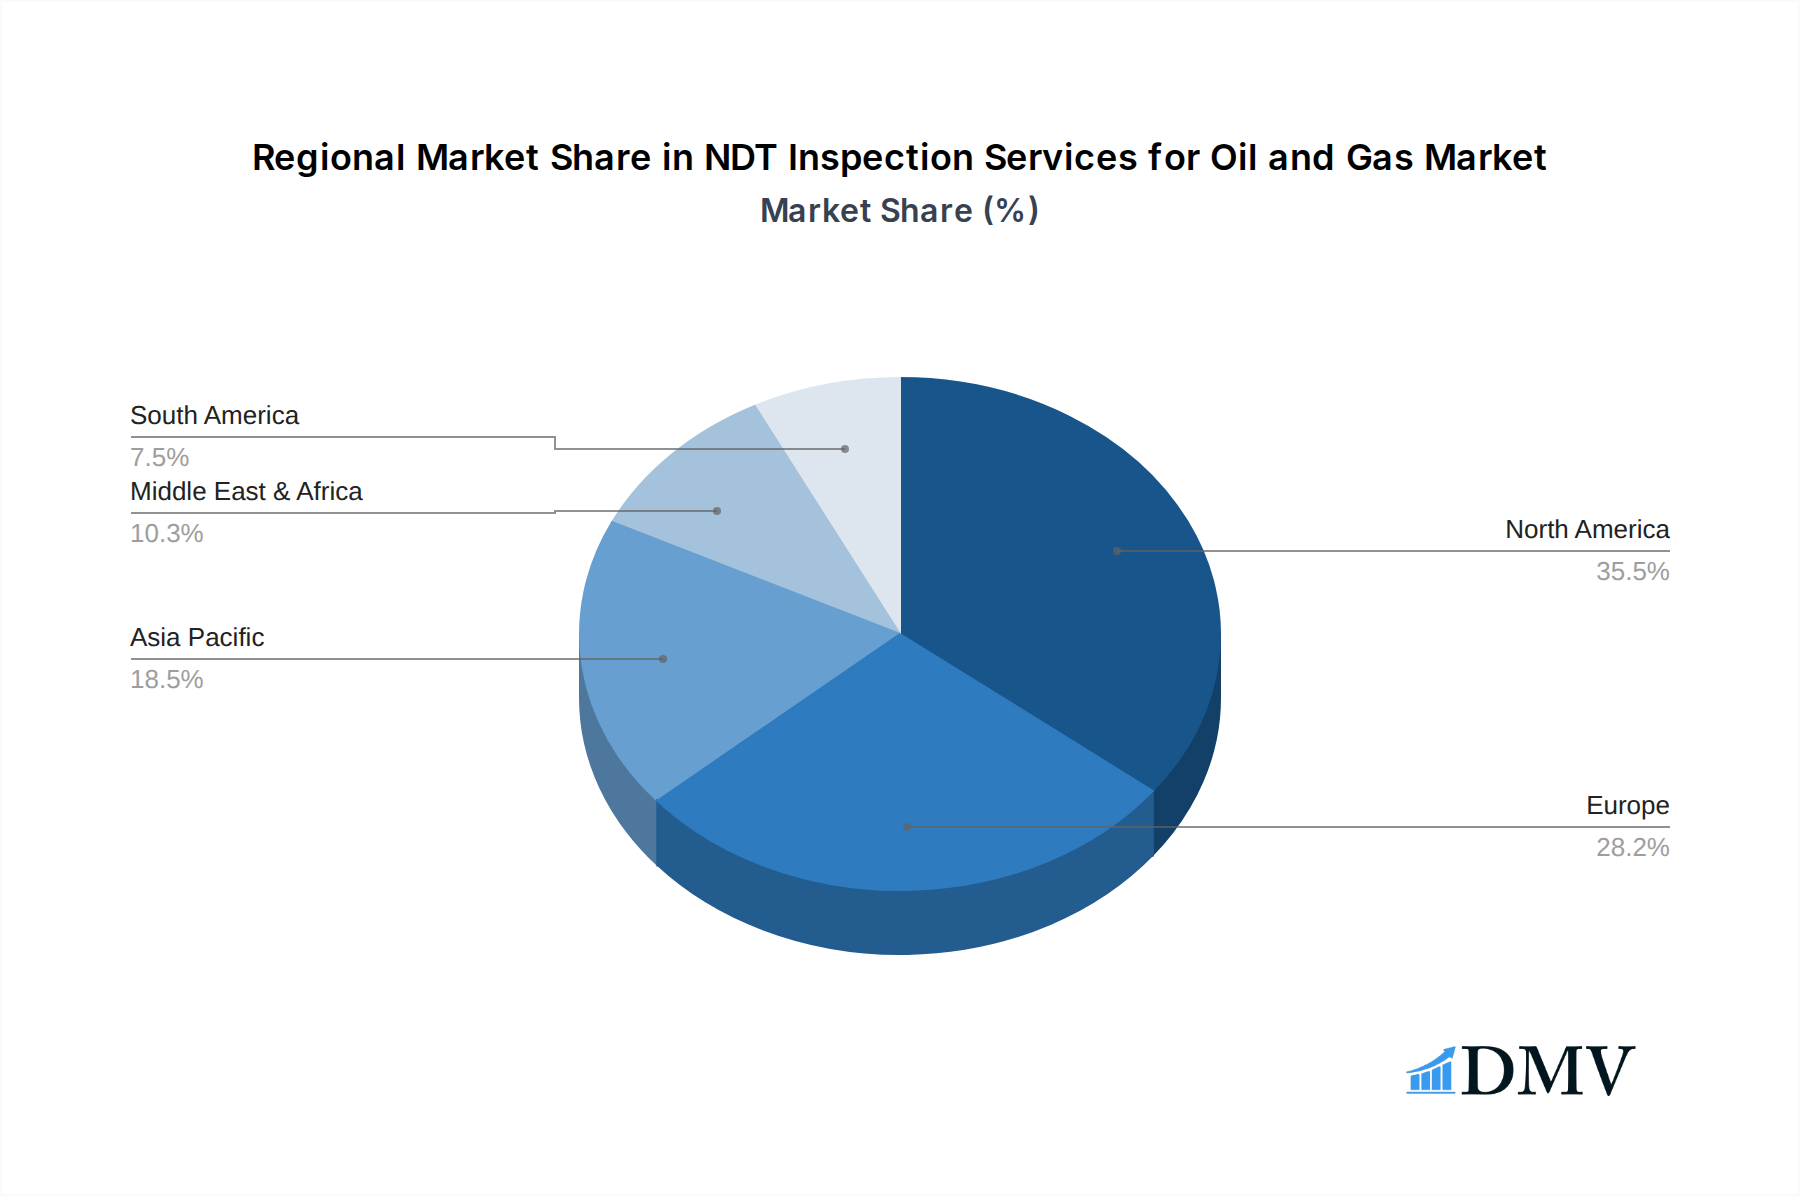
NDT Inspection Services for Oil and Gas Regional Market Share
Geographic Coverage of NDT Inspection Services for Oil and Gas
NDT Inspection Services for Oil and Gas REPORT HIGHLIGHTS
| Aspects | Details |
|---|---|
| Study Period | 2020-2034 |
| Base Year | 2025 |
| Estimated Year | 2026 |
| Forecast Period | 2026-2034 |
| Historical Period | 2020-2025 |
| Growth Rate | CAGR of 8.8% from 2020-2034 |
| Segmentation |
|
Table of Contents
- 1. Introduction
- 1.1. Research Scope
- 1.2. Market Segmentation
- 1.3. Research Objective
- 1.4. Definitions and Assumptions
- 2. Executive Summary
- 2.1. Market Snapshot
- 3. Market Dynamics
- 3.1. Market Drivers
- 3.2. Market Restrains
- 3.3. Market Trends
- 3.4. Market Opportunities
- 4. Market Factor Analysis
- 4.1. Porters Five Forces
- 4.1.1. Bargaining Power of Suppliers
- 4.1.2. Bargaining Power of Buyers
- 4.1.3. Threat of New Entrants
- 4.1.4. Threat of Substitutes
- 4.1.5. Competitive Rivalry
- 4.2. PESTEL analysis
- 4.3. BCG Analysis
- 4.3.1. Stars (High Growth, High Market Share)
- 4.3.2. Cash Cows (Low Growth, High Market Share)
- 4.3.3. Question Mark (High Growth, Low Market Share)
- 4.3.4. Dogs (Low Growth, Low Market Share)
- 4.4. Ansoff Matrix Analysis
- 4.5. Supply Chain Analysis
- 4.6. Regulatory Landscape
- 4.7. Current Market Potential and Opportunity Assessment (TAM–SAM–SOM Framework)
- 4.8. DMV Analyst Note
- 4.1. Porters Five Forces
- 5. Market Analysis, Insights and Forecast 2021-2033
- 5.1. Market Analysis, Insights and Forecast - by Application
- 5.1.1. Petroleum Industry
- 5.1.2. Natural Gas Industry
- 5.1.3. Others
- 5.2. Market Analysis, Insights and Forecast - by Types
- 5.2.1. Electromagnetic Testing (ET)
- 5.2.2. Laser Test Method (LM)
- 5.2.3. Radiographic Testing (RT)
- 5.2.4. Ultrasonic Testing (UT)
- 5.3. Market Analysis, Insights and Forecast - by Region
- 5.3.1. North America
- 5.3.2. South America
- 5.3.3. Europe
- 5.3.4. Middle East & Africa
- 5.3.5. Asia Pacific
- 5.1. Market Analysis, Insights and Forecast - by Application
- 6. Global NDT Inspection Services for Oil and Gas Analysis, Insights and Forecast, 2021-2033
- 6.1. Market Analysis, Insights and Forecast - by Application
- 6.1.1. Petroleum Industry
- 6.1.2. Natural Gas Industry
- 6.1.3. Others
- 6.2. Market Analysis, Insights and Forecast - by Types
- 6.2.1. Electromagnetic Testing (ET)
- 6.2.2. Laser Test Method (LM)
- 6.2.3. Radiographic Testing (RT)
- 6.2.4. Ultrasonic Testing (UT)
- 6.1. Market Analysis, Insights and Forecast - by Application
- 7. North America NDT Inspection Services for Oil and Gas Analysis, Insights and Forecast, 2020-2032
- 7.1. Market Analysis, Insights and Forecast - by Application
- 7.1.1. Petroleum Industry
- 7.1.2. Natural Gas Industry
- 7.1.3. Others
- 7.2. Market Analysis, Insights and Forecast - by Types
- 7.2.1. Electromagnetic Testing (ET)
- 7.2.2. Laser Test Method (LM)
- 7.2.3. Radiographic Testing (RT)
- 7.2.4. Ultrasonic Testing (UT)
- 7.1. Market Analysis, Insights and Forecast - by Application
- 8. South America NDT Inspection Services for Oil and Gas Analysis, Insights and Forecast, 2020-2032
- 8.1. Market Analysis, Insights and Forecast - by Application
- 8.1.1. Petroleum Industry
- 8.1.2. Natural Gas Industry
- 8.1.3. Others
- 8.2. Market Analysis, Insights and Forecast - by Types
- 8.2.1. Electromagnetic Testing (ET)
- 8.2.2. Laser Test Method (LM)
- 8.2.3. Radiographic Testing (RT)
- 8.2.4. Ultrasonic Testing (UT)
- 8.1. Market Analysis, Insights and Forecast - by Application
- 9. Europe NDT Inspection Services for Oil and Gas Analysis, Insights and Forecast, 2020-2032
- 9.1. Market Analysis, Insights and Forecast - by Application
- 9.1.1. Petroleum Industry
- 9.1.2. Natural Gas Industry
- 9.1.3. Others
- 9.2. Market Analysis, Insights and Forecast - by Types
- 9.2.1. Electromagnetic Testing (ET)
- 9.2.2. Laser Test Method (LM)
- 9.2.3. Radiographic Testing (RT)
- 9.2.4. Ultrasonic Testing (UT)
- 9.1. Market Analysis, Insights and Forecast - by Application
- 10. Middle East & Africa NDT Inspection Services for Oil and Gas Analysis, Insights and Forecast, 2020-2032
- 10.1. Market Analysis, Insights and Forecast - by Application
- 10.1.1. Petroleum Industry
- 10.1.2. Natural Gas Industry
- 10.1.3. Others
- 10.2. Market Analysis, Insights and Forecast - by Types
- 10.2.1. Electromagnetic Testing (ET)
- 10.2.2. Laser Test Method (LM)
- 10.2.3. Radiographic Testing (RT)
- 10.2.4. Ultrasonic Testing (UT)
- 10.1. Market Analysis, Insights and Forecast - by Application
- 11. Asia Pacific NDT Inspection Services for Oil and Gas Analysis, Insights and Forecast, 2020-2032
- 11.1. Market Analysis, Insights and Forecast - by Application
- 11.1.1. Petroleum Industry
- 11.1.2. Natural Gas Industry
- 11.1.3. Others
- 11.2. Market Analysis, Insights and Forecast - by Types
- 11.2.1. Electromagnetic Testing (ET)
- 11.2.2. Laser Test Method (LM)
- 11.2.3. Radiographic Testing (RT)
- 11.2.4. Ultrasonic Testing (UT)
- 11.1. Market Analysis, Insights and Forecast - by Application
- 12. Competitive Analysis
- 12.1. Company Profiles
- 12.1.1 Applus+
- 12.1.1.1. Company Overview
- 12.1.1.2. Products
- 12.1.1.3. Company Financials
- 12.1.1.4. SWOT Analysis
- 12.1.2 SGS
- 12.1.2.1. Company Overview
- 12.1.2.2. Products
- 12.1.2.3. Company Financials
- 12.1.2.4. SWOT Analysis
- 12.1.3 Zetec
- 12.1.3.1. Company Overview
- 12.1.3.2. Products
- 12.1.3.3. Company Financials
- 12.1.3.4. SWOT Analysis
- 12.1.4 U.S. Inspection & NDT
- 12.1.4.1. Company Overview
- 12.1.4.2. Products
- 12.1.4.3. Company Financials
- 12.1.4.4. SWOT Analysis
- 12.1.5 LLC
- 12.1.5.1. Company Overview
- 12.1.5.2. Products
- 12.1.5.3. Company Financials
- 12.1.5.4. SWOT Analysis
- 12.1.6 Amerapex
- 12.1.6.1. Company Overview
- 12.1.6.2. Products
- 12.1.6.3. Company Financials
- 12.1.6.4. SWOT Analysis
- 12.1.7 NDT Global Inc
- 12.1.7.1. Company Overview
- 12.1.7.2. Products
- 12.1.7.3. Company Financials
- 12.1.7.4. SWOT Analysis
- 12.1.8 Advantage NDT Supplies Ltd
- 12.1.8.1. Company Overview
- 12.1.8.2. Products
- 12.1.8.3. Company Financials
- 12.1.8.4. SWOT Analysis
- 12.1.9 TesTex NDT India Pvt Ltd
- 12.1.9.1. Company Overview
- 12.1.9.2. Products
- 12.1.9.3. Company Financials
- 12.1.9.4. SWOT Analysis
- 12.1.10 Morgan Ward
- 12.1.10.1. Company Overview
- 12.1.10.2. Products
- 12.1.10.3. Company Financials
- 12.1.10.4. SWOT Analysis
- 12.1.11 Nikham Offshore
- 12.1.11.1. Company Overview
- 12.1.11.2. Products
- 12.1.11.3. Company Financials
- 12.1.11.4. SWOT Analysis
- 12.1.12 BNN Oil and Gas Limited
- 12.1.12.1. Company Overview
- 12.1.12.2. Products
- 12.1.12.3. Company Financials
- 12.1.12.4. SWOT Analysis
- 12.1.1 Applus+
- 12.2. Market Entropy
- 12.2.1 Company's Key Areas Served
- 12.2.2 Recent Developments
- 12.3. Company Market Share Analysis 2025
- 12.3.1 Top 5 Companies Market Share Analysis
- 12.3.2 Top 3 Companies Market Share Analysis
- 12.4. List of Potential Customers
- 13. Research Methodology
List of Figures
- Figure 1: Global NDT Inspection Services for Oil and Gas Revenue Breakdown (billion, %) by Region 2025 & 2033
- Figure 2: North America NDT Inspection Services for Oil and Gas Revenue (billion), by Application 2025 & 2033
- Figure 3: North America NDT Inspection Services for Oil and Gas Revenue Share (%), by Application 2025 & 2033
- Figure 4: North America NDT Inspection Services for Oil and Gas Revenue (billion), by Types 2025 & 2033
- Figure 5: North America NDT Inspection Services for Oil and Gas Revenue Share (%), by Types 2025 & 2033
- Figure 6: North America NDT Inspection Services for Oil and Gas Revenue (billion), by Country 2025 & 2033
- Figure 7: North America NDT Inspection Services for Oil and Gas Revenue Share (%), by Country 2025 & 2033
- Figure 8: South America NDT Inspection Services for Oil and Gas Revenue (billion), by Application 2025 & 2033
- Figure 9: South America NDT Inspection Services for Oil and Gas Revenue Share (%), by Application 2025 & 2033
- Figure 10: South America NDT Inspection Services for Oil and Gas Revenue (billion), by Types 2025 & 2033
- Figure 11: South America NDT Inspection Services for Oil and Gas Revenue Share (%), by Types 2025 & 2033
- Figure 12: South America NDT Inspection Services for Oil and Gas Revenue (billion), by Country 2025 & 2033
- Figure 13: South America NDT Inspection Services for Oil and Gas Revenue Share (%), by Country 2025 & 2033
- Figure 14: Europe NDT Inspection Services for Oil and Gas Revenue (billion), by Application 2025 & 2033
- Figure 15: Europe NDT Inspection Services for Oil and Gas Revenue Share (%), by Application 2025 & 2033
- Figure 16: Europe NDT Inspection Services for Oil and Gas Revenue (billion), by Types 2025 & 2033
- Figure 17: Europe NDT Inspection Services for Oil and Gas Revenue Share (%), by Types 2025 & 2033
- Figure 18: Europe NDT Inspection Services for Oil and Gas Revenue (billion), by Country 2025 & 2033
- Figure 19: Europe NDT Inspection Services for Oil and Gas Revenue Share (%), by Country 2025 & 2033
- Figure 20: Middle East & Africa NDT Inspection Services for Oil and Gas Revenue (billion), by Application 2025 & 2033
- Figure 21: Middle East & Africa NDT Inspection Services for Oil and Gas Revenue Share (%), by Application 2025 & 2033
- Figure 22: Middle East & Africa NDT Inspection Services for Oil and Gas Revenue (billion), by Types 2025 & 2033
- Figure 23: Middle East & Africa NDT Inspection Services for Oil and Gas Revenue Share (%), by Types 2025 & 2033
- Figure 24: Middle East & Africa NDT Inspection Services for Oil and Gas Revenue (billion), by Country 2025 & 2033
- Figure 25: Middle East & Africa NDT Inspection Services for Oil and Gas Revenue Share (%), by Country 2025 & 2033
- Figure 26: Asia Pacific NDT Inspection Services for Oil and Gas Revenue (billion), by Application 2025 & 2033
- Figure 27: Asia Pacific NDT Inspection Services for Oil and Gas Revenue Share (%), by Application 2025 & 2033
- Figure 28: Asia Pacific NDT Inspection Services for Oil and Gas Revenue (billion), by Types 2025 & 2033
- Figure 29: Asia Pacific NDT Inspection Services for Oil and Gas Revenue Share (%), by Types 2025 & 2033
- Figure 30: Asia Pacific NDT Inspection Services for Oil and Gas Revenue (billion), by Country 2025 & 2033
- Figure 31: Asia Pacific NDT Inspection Services for Oil and Gas Revenue Share (%), by Country 2025 & 2033
List of Tables
- Table 1: Global NDT Inspection Services for Oil and Gas Revenue billion Forecast, by Application 2020 & 2033
- Table 2: Global NDT Inspection Services for Oil and Gas Revenue billion Forecast, by Types 2020 & 2033
- Table 3: Global NDT Inspection Services for Oil and Gas Revenue billion Forecast, by Region 2020 & 2033
- Table 4: Global NDT Inspection Services for Oil and Gas Revenue billion Forecast, by Application 2020 & 2033
- Table 5: Global NDT Inspection Services for Oil and Gas Revenue billion Forecast, by Types 2020 & 2033
- Table 6: Global NDT Inspection Services for Oil and Gas Revenue billion Forecast, by Country 2020 & 2033
- Table 7: United States NDT Inspection Services for Oil and Gas Revenue (billion) Forecast, by Application 2020 & 2033
- Table 8: Canada NDT Inspection Services for Oil and Gas Revenue (billion) Forecast, by Application 2020 & 2033
- Table 9: Mexico NDT Inspection Services for Oil and Gas Revenue (billion) Forecast, by Application 2020 & 2033
- Table 10: Global NDT Inspection Services for Oil and Gas Revenue billion Forecast, by Application 2020 & 2033
- Table 11: Global NDT Inspection Services for Oil and Gas Revenue billion Forecast, by Types 2020 & 2033
- Table 12: Global NDT Inspection Services for Oil and Gas Revenue billion Forecast, by Country 2020 & 2033
- Table 13: Brazil NDT Inspection Services for Oil and Gas Revenue (billion) Forecast, by Application 2020 & 2033
- Table 14: Argentina NDT Inspection Services for Oil and Gas Revenue (billion) Forecast, by Application 2020 & 2033
- Table 15: Rest of South America NDT Inspection Services for Oil and Gas Revenue (billion) Forecast, by Application 2020 & 2033
- Table 16: Global NDT Inspection Services for Oil and Gas Revenue billion Forecast, by Application 2020 & 2033
- Table 17: Global NDT Inspection Services for Oil and Gas Revenue billion Forecast, by Types 2020 & 2033
- Table 18: Global NDT Inspection Services for Oil and Gas Revenue billion Forecast, by Country 2020 & 2033
- Table 19: United Kingdom NDT Inspection Services for Oil and Gas Revenue (billion) Forecast, by Application 2020 & 2033
- Table 20: Germany NDT Inspection Services for Oil and Gas Revenue (billion) Forecast, by Application 2020 & 2033
- Table 21: France NDT Inspection Services for Oil and Gas Revenue (billion) Forecast, by Application 2020 & 2033
- Table 22: Italy NDT Inspection Services for Oil and Gas Revenue (billion) Forecast, by Application 2020 & 2033
- Table 23: Spain NDT Inspection Services for Oil and Gas Revenue (billion) Forecast, by Application 2020 & 2033
- Table 24: Russia NDT Inspection Services for Oil and Gas Revenue (billion) Forecast, by Application 2020 & 2033
- Table 25: Benelux NDT Inspection Services for Oil and Gas Revenue (billion) Forecast, by Application 2020 & 2033
- Table 26: Nordics NDT Inspection Services for Oil and Gas Revenue (billion) Forecast, by Application 2020 & 2033
- Table 27: Rest of Europe NDT Inspection Services for Oil and Gas Revenue (billion) Forecast, by Application 2020 & 2033
- Table 28: Global NDT Inspection Services for Oil and Gas Revenue billion Forecast, by Application 2020 & 2033
- Table 29: Global NDT Inspection Services for Oil and Gas Revenue billion Forecast, by Types 2020 & 2033
- Table 30: Global NDT Inspection Services for Oil and Gas Revenue billion Forecast, by Country 2020 & 2033
- Table 31: Turkey NDT Inspection Services for Oil and Gas Revenue (billion) Forecast, by Application 2020 & 2033
- Table 32: Israel NDT Inspection Services for Oil and Gas Revenue (billion) Forecast, by Application 2020 & 2033
- Table 33: GCC NDT Inspection Services for Oil and Gas Revenue (billion) Forecast, by Application 2020 & 2033
- Table 34: North Africa NDT Inspection Services for Oil and Gas Revenue (billion) Forecast, by Application 2020 & 2033
- Table 35: South Africa NDT Inspection Services for Oil and Gas Revenue (billion) Forecast, by Application 2020 & 2033
- Table 36: Rest of Middle East & Africa NDT Inspection Services for Oil and Gas Revenue (billion) Forecast, by Application 2020 & 2033
- Table 37: Global NDT Inspection Services for Oil and Gas Revenue billion Forecast, by Application 2020 & 2033
- Table 38: Global NDT Inspection Services for Oil and Gas Revenue billion Forecast, by Types 2020 & 2033
- Table 39: Global NDT Inspection Services for Oil and Gas Revenue billion Forecast, by Country 2020 & 2033
- Table 40: China NDT Inspection Services for Oil and Gas Revenue (billion) Forecast, by Application 2020 & 2033
- Table 41: India NDT Inspection Services for Oil and Gas Revenue (billion) Forecast, by Application 2020 & 2033
- Table 42: Japan NDT Inspection Services for Oil and Gas Revenue (billion) Forecast, by Application 2020 & 2033
- Table 43: South Korea NDT Inspection Services for Oil and Gas Revenue (billion) Forecast, by Application 2020 & 2033
- Table 44: ASEAN NDT Inspection Services for Oil and Gas Revenue (billion) Forecast, by Application 2020 & 2033
- Table 45: Oceania NDT Inspection Services for Oil and Gas Revenue (billion) Forecast, by Application 2020 & 2033
- Table 46: Rest of Asia Pacific NDT Inspection Services for Oil and Gas Revenue (billion) Forecast, by Application 2020 & 2033
Frequently Asked Questions
1. What is the projected Compound Annual Growth Rate (CAGR) of the NDT Inspection Services for Oil and Gas?
The projected CAGR is approximately 8.8%.
2. Which companies are prominent players in the NDT Inspection Services for Oil and Gas?
Key companies in the market include Applus+, SGS, Zetec, U.S. Inspection & NDT, LLC, Amerapex, NDT Global Inc, Advantage NDT Supplies Ltd, TesTex NDT India Pvt Ltd, Morgan Ward, Nikham Offshore, BNN Oil and Gas Limited.
3. What are the main segments of the NDT Inspection Services for Oil and Gas?
The market segments include Application, Types.
4. Can you provide details about the market size?
The market size is estimated to be USD 4.06 billion as of 2022.
5. What are some drivers contributing to market growth?
N/A
6. What are the notable trends driving market growth?
N/A
7. Are there any restraints impacting market growth?
N/A
8. Can you provide examples of recent developments in the market?
N/A
9. What pricing options are available for accessing the report?
Pricing options include single-user, multi-user, and enterprise licenses priced at USD 4350.00, USD 6525.00, and USD 8700.00 respectively.
10. Is the market size provided in terms of value or volume?
The market size is provided in terms of value, measured in billion.
11. Are there any specific market keywords associated with the report?
Yes, the market keyword associated with the report is "NDT Inspection Services for Oil and Gas," which aids in identifying and referencing the specific market segment covered.
12. How do I determine which pricing option suits my needs best?
The pricing options vary based on user requirements and access needs. Individual users may opt for single-user licenses, while businesses requiring broader access may choose multi-user or enterprise licenses for cost-effective access to the report.
13. Are there any additional resources or data provided in the NDT Inspection Services for Oil and Gas report?
While the report offers comprehensive insights, it's advisable to review the specific contents or supplementary materials provided to ascertain if additional resources or data are available.
14. How can I stay updated on further developments or reports in the NDT Inspection Services for Oil and Gas?
To stay informed about further developments, trends, and reports in the NDT Inspection Services for Oil and Gas, consider subscribing to industry newsletters, following relevant companies and organizations, or regularly checking reputable industry news sources and publications.
Methodology
Step 1 - Identification of Relevant Samples Size from Population Database



Step 2 - Approaches for Defining Global Market Size (Value, Volume* & Price*)

Note*: In applicable scenarios
Step 3 - Data Sources
Primary Research
- Web Analytics
- Survey Reports
- Research Institute
- Latest Research Reports
- Opinion Leaders
Secondary Research
- Annual Reports
- White Paper
- Latest Press Release
- Industry Association
- Paid Database
- Investor Presentations

Step 4 - Data Triangulation
Involves using different sources of information in order to increase the validity of a study
These sources are likely to be stakeholders in a program - participants, other researchers, program staff, other community members, and so on.
Then we put all data in single framework & apply various statistical tools to find out the dynamic on the market.
During the analysis stage, feedback from the stakeholder groups would be compared to determine areas of agreement as well as areas of divergence