

Key Insights
The marine gas oil (MGO) market is experiencing robust growth, driven by the increasing global demand for marine fuels and a sustained expansion in maritime trade. The market's compound annual growth rate (CAGR) exceeding 4% indicates a positive trajectory, projected to continue through 2033. Key growth drivers include the rising global shipping volumes, particularly in Asia-Pacific and increasing adoption of stricter emission regulations by the International Maritime Organization (IMO), pushing the industry toward cleaner fuel options like low-sulfur MGO. The segmentation of the market by fuel type (Air Turbine Fuel, Renewable Aviation Fuel) and end-user (Shipping, Aviation, Others) highlights the diverse applications and potential for further specialization. While the dominance of traditional MGO is undeniable, the emergence and gradual adoption of renewable aviation fuels represent a significant future trend, albeit currently a smaller segment. However, factors such as fluctuating crude oil prices, geopolitical instability impacting fuel supply chains, and the considerable upfront investment required for adopting cleaner fuel technologies represent potential restraints on market growth.
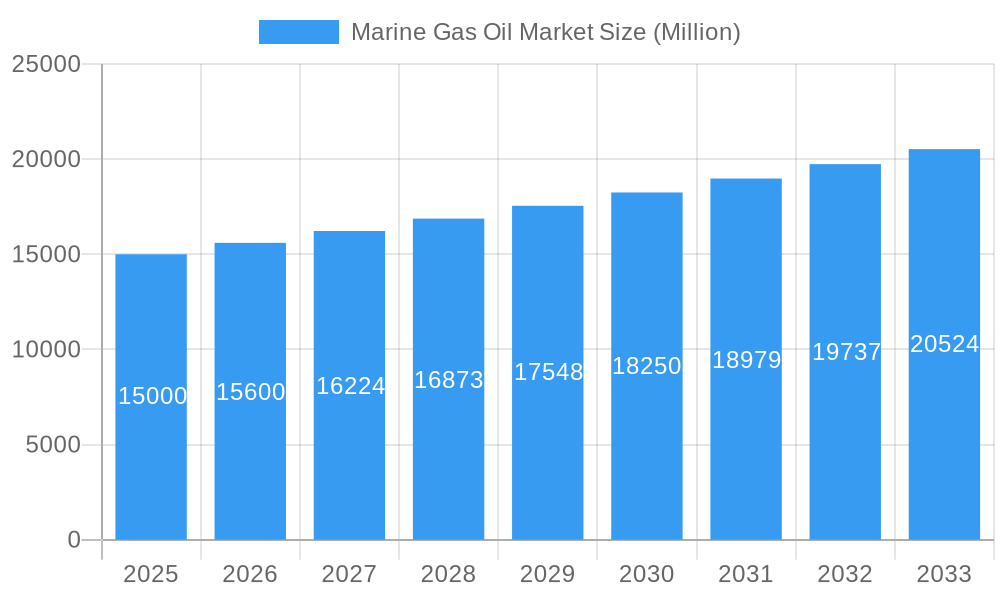
Marine Gas Oil Market Market Size (In Billion)
The regional breakdown reveals a geographically diverse market, with North America, Europe, and Asia-Pacific emerging as key players. Asia-Pacific's significant contribution stems from its booming maritime activity and economic growth. However, the market's future growth hinges on several interconnected factors. Further regulatory advancements related to emissions standards will significantly impact the adoption of cleaner fuel alternatives. Moreover, technological innovations in renewable fuel production and the development of efficient bunkering infrastructure are crucial to unlocking the full potential of this market. The competitive landscape features major players like ExxonMobil, Shell, and Chevron, alongside regional players, indicating a mix of global and local market dynamics. The market's future depends on balancing economic growth with environmental sustainability, leading to a projected continued, albeit potentially moderated, expansion in the coming years.
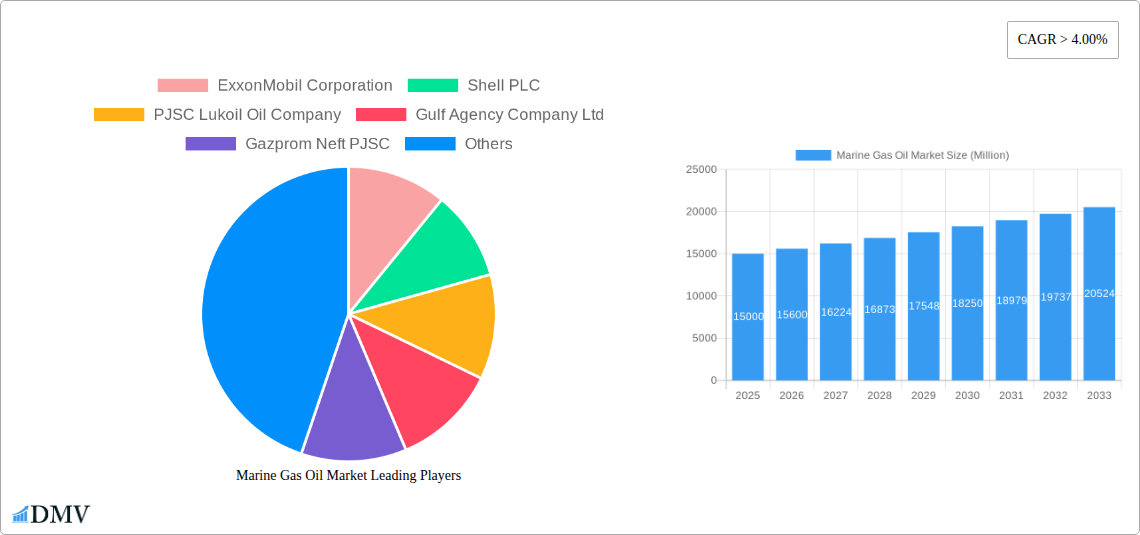
Marine Gas Oil Market Company Market Share
Marine Gas Oil (MGO) Market Report: A Comprehensive Analysis (2019-2033)
This insightful report provides a comprehensive analysis of the global Marine Gas Oil (MGO) market, offering a detailed understanding of its current state, future trajectory, and key players. Spanning the period from 2019 to 2033, with a base year of 2025, this report equips stakeholders with crucial data-driven insights for informed decision-making. The report delves into market segmentation by fuel type (Air Turbine Fuel, Renewable Aviation Fuel) and end-user (Shipping, Aviation, Others), analyzing market dynamics, growth drivers, and challenges. With a focus on key players like ExxonMobil Corporation, Shell PLC, and others, this report is essential for anyone involved in the MGO industry. The market is projected to reach xx Million by 2033.
Marine Gas Oil Market Market Composition & Trends
This section offers a detailed overview of the competitive landscape, including market share distribution among key players like ExxonMobil Corporation, Shell PLC, PJSC Lukoil Oil Company, Gulf Agency Company Ltd, Gazprom Neft PJSC, Chevron Corporation, Clipper Oil, TotalEnergies SE, BP PLC, and Bomin Bunker Fuel Holding GMBH & Co KG. We analyze the level of market concentration, identifying major players and their respective strengths. The report further explores innovation catalysts driving market growth, including technological advancements in fuel efficiency and emission reduction. It examines the regulatory landscape and its impact on market dynamics, considering evolving environmental regulations and international maritime standards. A detailed analysis of substitute products and their competitive pressures is also included. Finally, we analyze M&A activities within the MGO sector, providing insights into deal values and their implications for market consolidation.
- Market Concentration: Analysis of market share distribution among top players (estimated percentages included).
- Innovation Catalysts: Discussion of technological advancements in fuel formulations and emission control technologies.
- Regulatory Landscape: Assessment of the impact of IMO 2020 and other relevant environmental regulations.
- Substitute Products: Evaluation of alternative marine fuels and their market penetration.
- End-User Profiles: Detailed analysis of the end-user segments (shipping, aviation, others), including their consumption patterns and future demand projections.
- M&A Activities: Overview of significant mergers and acquisitions in the MGO market, including deal values and strategic implications.
Marine Gas Oil Market Industry Evolution
This section presents a comprehensive analysis of the MGO market's historical and projected growth trajectories, exploring market size, growth rates, and key factors driving the evolution of the industry. We examine technological advancements, such as the development of low-sulfur fuels and biofuels, and their impact on market adoption. We also analyze shifting consumer demands, including the growing preference for sustainable and environmentally friendly fuels, and the resulting impact on product development and market segmentation. The report further investigates the influence of macroeconomic factors, such as global trade and economic growth, on market dynamics. We incorporate relevant data points such as annual growth rates and adoption metrics to paint a complete picture. The MGO market experienced a xx% CAGR during the historical period (2019-2024) and is projected to grow at a xx% CAGR during the forecast period (2025-2033).
Leading Regions, Countries, or Segments in Marine Gas Oil Market
This section identifies the dominant regions, countries, and segments within the MGO market, analyzing the key factors contributing to their leadership positions.
- Dominant Region/Country: [Detailed analysis of the leading region/country, explaining market dominance through specific data points and in-depth analysis.]
- Dominant Segment (Fuel Type): [Detailed analysis of the dominant fuel type (Air Turbine Fuel or Renewable Aviation Fuel), including market size, growth drivers and challenges.]
- Dominant Segment (End-User): [Detailed analysis of the dominant end-user segment (Shipping, Aviation, or Others), including market size, growth drivers and challenges. We will examine the specific needs of each segment and how they drive MGO consumption.]
Key Drivers:
- Investment Trends: Analysis of investment patterns in infrastructure and technological advancements related to MGO.
- Regulatory Support: Assessment of governmental policies promoting the adoption and use of MGO, or similar fuels.
- [Further bullet points describing other relevant drivers]
Marine Gas Oil Market Product Innovations
This section explores recent innovations in MGO products, highlighting key features and performance metrics. The analysis focuses on unique selling propositions, technological advancements, and how these innovations address evolving market demands, including the need for cleaner and more efficient fuels. Specific examples of improved fuel formulations, enhanced additives, and innovative blending techniques are provided, along with their performance benefits in terms of reduced emissions and improved engine efficiency.
Propelling Factors for Marine Gas Oil Market Growth
Several factors contribute to the growth of the Marine Gas Oil market. Technological advancements, particularly in fuel efficiency and emission reduction technologies, are a primary driver. Economic growth, especially in the shipping and aviation sectors, significantly influences demand. Furthermore, supportive governmental policies and regulations promoting cleaner fuels play a crucial role in market expansion. Specific examples of these trends, including investments in renewable energy sources and stricter emission standards, are analyzed in detail.
Obstacles in the Marine Gas Oil Market Market
Despite its growth potential, the Marine Gas Oil market faces several challenges. Stringent environmental regulations, while beneficial in the long term, can impose immediate costs and complexities for producers and consumers. Supply chain disruptions, particularly in volatile geopolitical environments, can lead to price fluctuations and shortages. Finally, intense competition among major players can limit profitability.
Future Opportunities in Marine Gas Oil Market
The Marine Gas Oil market presents significant opportunities for growth. Expanding into new markets with high growth potential, particularly in developing economies, offers substantial untapped demand. Advancements in biofuels and other alternative fuels provide avenues for innovation and sustainability. Changes in consumer preferences and environmental concerns present opportunities for developing and marketing more eco-friendly products.
Major Players in the Marine Gas Oil Market Ecosystem
- ExxonMobil Corporation (ExxonMobil)
- Shell PLC (Shell)
- PJSC Lukoil Oil Company (Lukoil)
- Gulf Agency Company Ltd
- Gazprom Neft PJSC (Gazprom Neft)
- Chevron Corporation (Chevron)
- Clipper Oil
- TotalEnergies SE (TotalEnergies)
- BP PLC (BP)
- Bomin Bunker Fuel Holding GMBH & Co KG
Key Developments in Marine Gas Oil Market Industry
- May 2022: Neste OYJ and Nordic Marine Oil pilot a new Neste Marine 0.1 co-processed marine fuel in Scandinavia, aiming to reduce greenhouse gas emissions. This signifies a significant step towards sustainable marine fuels.
- January 2022: Sri Lanka's Hambantota port commences MGO bunkering operations, complying with ISO 8271 standards and expanding bunkering services to regions like the Maldives. This development indicates the expansion of the MGO bunkering infrastructure globally.
Strategic Marine Gas Oil Market Market Forecast
The future of the Marine Gas Oil market is bright, driven by sustained growth in global shipping and aviation, coupled with ongoing technological advancements in fuel efficiency and emission reduction. Opportunities abound in emerging markets and the increasing demand for sustainable marine fuels. The market is poised for significant expansion in the coming years, propelled by favorable regulatory environments and a focus on environmental sustainability.
Marine Gas Oil Market Segmentation
- 1. Production Analysis
- 2. Consumption Analysis
- 3. Import Market Analysis (Value & Volume)
- 4. Export Market Analysis (Value & Volume)
- 5. Price Trend Analysis
Marine Gas Oil Market Segmentation By Geography
-
1. North America
- 1.1. United States
- 1.2. Canada
- 1.3. Rest of North America
-
2. Europe
- 2.1. United Kingdom
- 2.2. France
- 2.3. Germany
- 2.4. Italy
- 2.5. Russian Federation
- 2.6. Rest of Europe
-
3. Asia Pacific
- 3.1. China
- 3.2. India
- 3.3. Malaysia
- 3.4. Japan
- 3.5. Australia
- 3.6. Rest of Asia Pacific
-
4. Middle East and Africa
- 4.1. Saudi Arabia
- 4.2. United Arab Emirates
- 4.3. Egypt
- 4.4. South America
- 4.5. Morocco
- 4.6. Rest of Middle East and Africa
-
5. South America
- 5.1. Brazil
- 5.2. Argentina
- 5.3. Rest of South America
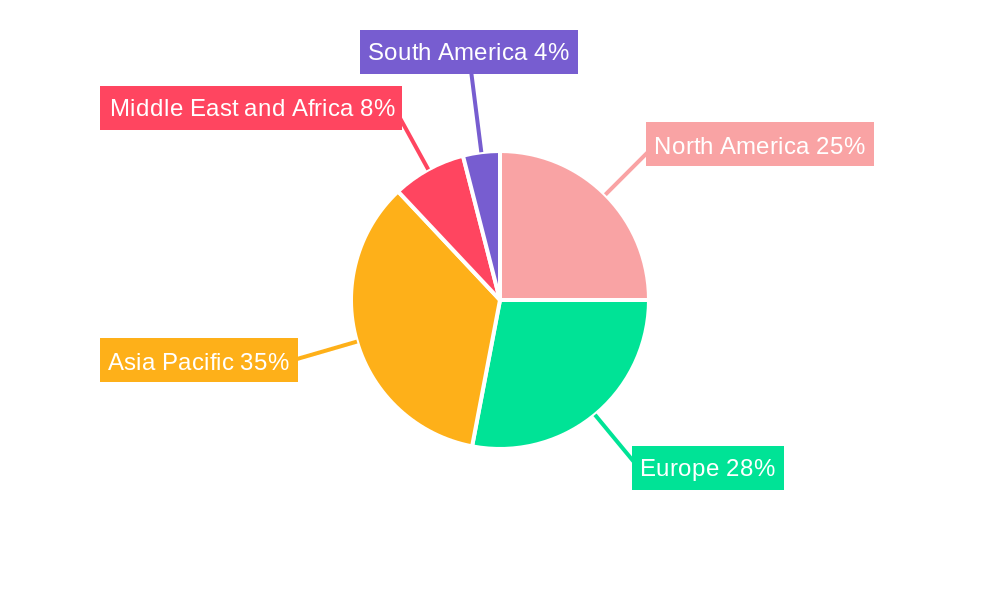
Marine Gas Oil Market Regional Market Share
Geographic Coverage of Marine Gas Oil Market
Marine Gas Oil Market REPORT HIGHLIGHTS
| Aspects | Details |
|---|---|
| Study Period | 2020-2034 |
| Base Year | 2025 |
| Estimated Year | 2026 |
| Forecast Period | 2026-2034 |
| Historical Period | 2020-2025 |
| Growth Rate | CAGR of 5.5% from 2020-2034 |
| Segmentation |
|
Table of Contents
- 1. Introduction
- 1.1. Research Scope
- 1.2. Market Segmentation
- 1.3. Research Objective
- 1.4. Definitions and Assumptions
- 2. Executive Summary
- 2.1. Market Snapshot
- 3. Market Dynamics
- 3.1. Market Drivers
- 3.2. Market Restrains
- 3.3. Market Trends
- 3.4. Market Opportunities
- 4. Market Factor Analysis
- 4.1. Porters Five Forces
- 4.1.1. Bargaining Power of Suppliers
- 4.1.2. Bargaining Power of Buyers
- 4.1.3. Threat of New Entrants
- 4.1.4. Threat of Substitutes
- 4.1.5. Competitive Rivalry
- 4.2. PESTEL analysis
- 4.3. BCG Analysis
- 4.3.1. Stars (High Growth, High Market Share)
- 4.3.2. Cash Cows (Low Growth, High Market Share)
- 4.3.3. Question Mark (High Growth, Low Market Share)
- 4.3.4. Dogs (Low Growth, Low Market Share)
- 4.4. Ansoff Matrix Analysis
- 4.5. Supply Chain Analysis
- 4.6. Regulatory Landscape
- 4.7. Current Market Potential and Opportunity Assessment (TAM–SAM–SOM Framework)
- 4.8. DMV Analyst Note
- 4.1. Porters Five Forces
- 5. Market Analysis, Insights and Forecast 2021-2033
- 5.1. Market Analysis, Insights and Forecast - by Production Analysis
- 5.2. Market Analysis, Insights and Forecast - by Consumption Analysis
- 5.3. Market Analysis, Insights and Forecast - by Import Market Analysis (Value & Volume)
- 5.4. Market Analysis, Insights and Forecast - by Export Market Analysis (Value & Volume)
- 5.5. Market Analysis, Insights and Forecast - by Price Trend Analysis
- 5.6. Market Analysis, Insights and Forecast - by Region
- 5.6.1. North America
- 5.6.2. Europe
- 5.6.3. Asia Pacific
- 5.6.4. Middle East and Africa
- 5.6.5. South America
- 6. Global Marine Gas Oil Market Analysis, Insights and Forecast, 2021-2033
- 6.1. Market Analysis, Insights and Forecast - by Production Analysis
- 6.2. Market Analysis, Insights and Forecast - by Consumption Analysis
- 6.3. Market Analysis, Insights and Forecast - by Import Market Analysis (Value & Volume)
- 6.4. Market Analysis, Insights and Forecast - by Export Market Analysis (Value & Volume)
- 6.5. Market Analysis, Insights and Forecast - by Price Trend Analysis
- 7. North America Marine Gas Oil Market Analysis, Insights and Forecast, 2020-2032
- 7.1. Market Analysis, Insights and Forecast - by Production Analysis
- 7.2. Market Analysis, Insights and Forecast - by Consumption Analysis
- 7.3. Market Analysis, Insights and Forecast - by Import Market Analysis (Value & Volume)
- 7.4. Market Analysis, Insights and Forecast - by Export Market Analysis (Value & Volume)
- 7.5. Market Analysis, Insights and Forecast - by Price Trend Analysis
- 8. Europe Marine Gas Oil Market Analysis, Insights and Forecast, 2020-2032
- 8.1. Market Analysis, Insights and Forecast - by Production Analysis
- 8.2. Market Analysis, Insights and Forecast - by Consumption Analysis
- 8.3. Market Analysis, Insights and Forecast - by Import Market Analysis (Value & Volume)
- 8.4. Market Analysis, Insights and Forecast - by Export Market Analysis (Value & Volume)
- 8.5. Market Analysis, Insights and Forecast - by Price Trend Analysis
- 9. Asia Pacific Marine Gas Oil Market Analysis, Insights and Forecast, 2020-2032
- 9.1. Market Analysis, Insights and Forecast - by Production Analysis
- 9.2. Market Analysis, Insights and Forecast - by Consumption Analysis
- 9.3. Market Analysis, Insights and Forecast - by Import Market Analysis (Value & Volume)
- 9.4. Market Analysis, Insights and Forecast - by Export Market Analysis (Value & Volume)
- 9.5. Market Analysis, Insights and Forecast - by Price Trend Analysis
- 10. Middle East and Africa Marine Gas Oil Market Analysis, Insights and Forecast, 2020-2032
- 10.1. Market Analysis, Insights and Forecast - by Production Analysis
- 10.2. Market Analysis, Insights and Forecast - by Consumption Analysis
- 10.3. Market Analysis, Insights and Forecast - by Import Market Analysis (Value & Volume)
- 10.4. Market Analysis, Insights and Forecast - by Export Market Analysis (Value & Volume)
- 10.5. Market Analysis, Insights and Forecast - by Price Trend Analysis
- 11. South America Marine Gas Oil Market Analysis, Insights and Forecast, 2020-2032
- 11.1. Market Analysis, Insights and Forecast - by Production Analysis
- 11.2. Market Analysis, Insights and Forecast - by Consumption Analysis
- 11.3. Market Analysis, Insights and Forecast - by Import Market Analysis (Value & Volume)
- 11.4. Market Analysis, Insights and Forecast - by Export Market Analysis (Value & Volume)
- 11.5. Market Analysis, Insights and Forecast - by Price Trend Analysis
- 12. Competitive Analysis
- 12.1. Company Profiles
- 12.1.1 ExxonMobil Corporation
- 12.1.1.1. Company Overview
- 12.1.1.2. Products
- 12.1.1.3. Company Financials
- 12.1.1.4. SWOT Analysis
- 12.1.2 Shell PLC
- 12.1.2.1. Company Overview
- 12.1.2.2. Products
- 12.1.2.3. Company Financials
- 12.1.2.4. SWOT Analysis
- 12.1.3 PJSC Lukoil Oil Company
- 12.1.3.1. Company Overview
- 12.1.3.2. Products
- 12.1.3.3. Company Financials
- 12.1.3.4. SWOT Analysis
- 12.1.4 Gulf Agency Company Ltd
- 12.1.4.1. Company Overview
- 12.1.4.2. Products
- 12.1.4.3. Company Financials
- 12.1.4.4. SWOT Analysis
- 12.1.5 Gazprom Neft PJSC
- 12.1.5.1. Company Overview
- 12.1.5.2. Products
- 12.1.5.3. Company Financials
- 12.1.5.4. SWOT Analysis
- 12.1.6 Chevron Corporation
- 12.1.6.1. Company Overview
- 12.1.6.2. Products
- 12.1.6.3. Company Financials
- 12.1.6.4. SWOT Analysis
- 12.1.7 Clipper Oil
- 12.1.7.1. Company Overview
- 12.1.7.2. Products
- 12.1.7.3. Company Financials
- 12.1.7.4. SWOT Analysis
- 12.1.8 TotalEnergies SE
- 12.1.8.1. Company Overview
- 12.1.8.2. Products
- 12.1.8.3. Company Financials
- 12.1.8.4. SWOT Analysis
- 12.1.9 BP PLC
- 12.1.9.1. Company Overview
- 12.1.9.2. Products
- 12.1.9.3. Company Financials
- 12.1.9.4. SWOT Analysis
- 12.1.10 Bomin Bunker Fuel Holding GMBH & Co KG
- 12.1.10.1. Company Overview
- 12.1.10.2. Products
- 12.1.10.3. Company Financials
- 12.1.10.4. SWOT Analysis
- 12.1.1 ExxonMobil Corporation
- 12.2. Market Entropy
- 12.2.1 Company's Key Areas Served
- 12.2.2 Recent Developments
- 12.3. Company Market Share Analysis 2025
- 12.3.1 Top 5 Companies Market Share Analysis
- 12.3.2 Top 3 Companies Market Share Analysis
- 12.4. List of Potential Customers
- 13. Research Methodology
List of Figures
- Figure 1: Global Marine Gas Oil Market Revenue Breakdown (billion, %) by Region 2025 & 2033
- Figure 2: Global Marine Gas Oil Market Volume Breakdown (Litre, %) by Region 2025 & 2033
- Figure 3: North America Marine Gas Oil Market Revenue (billion), by Production Analysis 2025 & 2033
- Figure 4: North America Marine Gas Oil Market Volume (Litre), by Production Analysis 2025 & 2033
- Figure 5: North America Marine Gas Oil Market Revenue Share (%), by Production Analysis 2025 & 2033
- Figure 6: North America Marine Gas Oil Market Volume Share (%), by Production Analysis 2025 & 2033
- Figure 7: North America Marine Gas Oil Market Revenue (billion), by Consumption Analysis 2025 & 2033
- Figure 8: North America Marine Gas Oil Market Volume (Litre), by Consumption Analysis 2025 & 2033
- Figure 9: North America Marine Gas Oil Market Revenue Share (%), by Consumption Analysis 2025 & 2033
- Figure 10: North America Marine Gas Oil Market Volume Share (%), by Consumption Analysis 2025 & 2033
- Figure 11: North America Marine Gas Oil Market Revenue (billion), by Import Market Analysis (Value & Volume) 2025 & 2033
- Figure 12: North America Marine Gas Oil Market Volume (Litre), by Import Market Analysis (Value & Volume) 2025 & 2033
- Figure 13: North America Marine Gas Oil Market Revenue Share (%), by Import Market Analysis (Value & Volume) 2025 & 2033
- Figure 14: North America Marine Gas Oil Market Volume Share (%), by Import Market Analysis (Value & Volume) 2025 & 2033
- Figure 15: North America Marine Gas Oil Market Revenue (billion), by Export Market Analysis (Value & Volume) 2025 & 2033
- Figure 16: North America Marine Gas Oil Market Volume (Litre), by Export Market Analysis (Value & Volume) 2025 & 2033
- Figure 17: North America Marine Gas Oil Market Revenue Share (%), by Export Market Analysis (Value & Volume) 2025 & 2033
- Figure 18: North America Marine Gas Oil Market Volume Share (%), by Export Market Analysis (Value & Volume) 2025 & 2033
- Figure 19: North America Marine Gas Oil Market Revenue (billion), by Price Trend Analysis 2025 & 2033
- Figure 20: North America Marine Gas Oil Market Volume (Litre), by Price Trend Analysis 2025 & 2033
- Figure 21: North America Marine Gas Oil Market Revenue Share (%), by Price Trend Analysis 2025 & 2033
- Figure 22: North America Marine Gas Oil Market Volume Share (%), by Price Trend Analysis 2025 & 2033
- Figure 23: North America Marine Gas Oil Market Revenue (billion), by Country 2025 & 2033
- Figure 24: North America Marine Gas Oil Market Volume (Litre), by Country 2025 & 2033
- Figure 25: North America Marine Gas Oil Market Revenue Share (%), by Country 2025 & 2033
- Figure 26: North America Marine Gas Oil Market Volume Share (%), by Country 2025 & 2033
- Figure 27: Europe Marine Gas Oil Market Revenue (billion), by Production Analysis 2025 & 2033
- Figure 28: Europe Marine Gas Oil Market Volume (Litre), by Production Analysis 2025 & 2033
- Figure 29: Europe Marine Gas Oil Market Revenue Share (%), by Production Analysis 2025 & 2033
- Figure 30: Europe Marine Gas Oil Market Volume Share (%), by Production Analysis 2025 & 2033
- Figure 31: Europe Marine Gas Oil Market Revenue (billion), by Consumption Analysis 2025 & 2033
- Figure 32: Europe Marine Gas Oil Market Volume (Litre), by Consumption Analysis 2025 & 2033
- Figure 33: Europe Marine Gas Oil Market Revenue Share (%), by Consumption Analysis 2025 & 2033
- Figure 34: Europe Marine Gas Oil Market Volume Share (%), by Consumption Analysis 2025 & 2033
- Figure 35: Europe Marine Gas Oil Market Revenue (billion), by Import Market Analysis (Value & Volume) 2025 & 2033
- Figure 36: Europe Marine Gas Oil Market Volume (Litre), by Import Market Analysis (Value & Volume) 2025 & 2033
- Figure 37: Europe Marine Gas Oil Market Revenue Share (%), by Import Market Analysis (Value & Volume) 2025 & 2033
- Figure 38: Europe Marine Gas Oil Market Volume Share (%), by Import Market Analysis (Value & Volume) 2025 & 2033
- Figure 39: Europe Marine Gas Oil Market Revenue (billion), by Export Market Analysis (Value & Volume) 2025 & 2033
- Figure 40: Europe Marine Gas Oil Market Volume (Litre), by Export Market Analysis (Value & Volume) 2025 & 2033
- Figure 41: Europe Marine Gas Oil Market Revenue Share (%), by Export Market Analysis (Value & Volume) 2025 & 2033
- Figure 42: Europe Marine Gas Oil Market Volume Share (%), by Export Market Analysis (Value & Volume) 2025 & 2033
- Figure 43: Europe Marine Gas Oil Market Revenue (billion), by Price Trend Analysis 2025 & 2033
- Figure 44: Europe Marine Gas Oil Market Volume (Litre), by Price Trend Analysis 2025 & 2033
- Figure 45: Europe Marine Gas Oil Market Revenue Share (%), by Price Trend Analysis 2025 & 2033
- Figure 46: Europe Marine Gas Oil Market Volume Share (%), by Price Trend Analysis 2025 & 2033
- Figure 47: Europe Marine Gas Oil Market Revenue (billion), by Country 2025 & 2033
- Figure 48: Europe Marine Gas Oil Market Volume (Litre), by Country 2025 & 2033
- Figure 49: Europe Marine Gas Oil Market Revenue Share (%), by Country 2025 & 2033
- Figure 50: Europe Marine Gas Oil Market Volume Share (%), by Country 2025 & 2033
- Figure 51: Asia Pacific Marine Gas Oil Market Revenue (billion), by Production Analysis 2025 & 2033
- Figure 52: Asia Pacific Marine Gas Oil Market Volume (Litre), by Production Analysis 2025 & 2033
- Figure 53: Asia Pacific Marine Gas Oil Market Revenue Share (%), by Production Analysis 2025 & 2033
- Figure 54: Asia Pacific Marine Gas Oil Market Volume Share (%), by Production Analysis 2025 & 2033
- Figure 55: Asia Pacific Marine Gas Oil Market Revenue (billion), by Consumption Analysis 2025 & 2033
- Figure 56: Asia Pacific Marine Gas Oil Market Volume (Litre), by Consumption Analysis 2025 & 2033
- Figure 57: Asia Pacific Marine Gas Oil Market Revenue Share (%), by Consumption Analysis 2025 & 2033
- Figure 58: Asia Pacific Marine Gas Oil Market Volume Share (%), by Consumption Analysis 2025 & 2033
- Figure 59: Asia Pacific Marine Gas Oil Market Revenue (billion), by Import Market Analysis (Value & Volume) 2025 & 2033
- Figure 60: Asia Pacific Marine Gas Oil Market Volume (Litre), by Import Market Analysis (Value & Volume) 2025 & 2033
- Figure 61: Asia Pacific Marine Gas Oil Market Revenue Share (%), by Import Market Analysis (Value & Volume) 2025 & 2033
- Figure 62: Asia Pacific Marine Gas Oil Market Volume Share (%), by Import Market Analysis (Value & Volume) 2025 & 2033
- Figure 63: Asia Pacific Marine Gas Oil Market Revenue (billion), by Export Market Analysis (Value & Volume) 2025 & 2033
- Figure 64: Asia Pacific Marine Gas Oil Market Volume (Litre), by Export Market Analysis (Value & Volume) 2025 & 2033
- Figure 65: Asia Pacific Marine Gas Oil Market Revenue Share (%), by Export Market Analysis (Value & Volume) 2025 & 2033
- Figure 66: Asia Pacific Marine Gas Oil Market Volume Share (%), by Export Market Analysis (Value & Volume) 2025 & 2033
- Figure 67: Asia Pacific Marine Gas Oil Market Revenue (billion), by Price Trend Analysis 2025 & 2033
- Figure 68: Asia Pacific Marine Gas Oil Market Volume (Litre), by Price Trend Analysis 2025 & 2033
- Figure 69: Asia Pacific Marine Gas Oil Market Revenue Share (%), by Price Trend Analysis 2025 & 2033
- Figure 70: Asia Pacific Marine Gas Oil Market Volume Share (%), by Price Trend Analysis 2025 & 2033
- Figure 71: Asia Pacific Marine Gas Oil Market Revenue (billion), by Country 2025 & 2033
- Figure 72: Asia Pacific Marine Gas Oil Market Volume (Litre), by Country 2025 & 2033
- Figure 73: Asia Pacific Marine Gas Oil Market Revenue Share (%), by Country 2025 & 2033
- Figure 74: Asia Pacific Marine Gas Oil Market Volume Share (%), by Country 2025 & 2033
- Figure 75: Middle East and Africa Marine Gas Oil Market Revenue (billion), by Production Analysis 2025 & 2033
- Figure 76: Middle East and Africa Marine Gas Oil Market Volume (Litre), by Production Analysis 2025 & 2033
- Figure 77: Middle East and Africa Marine Gas Oil Market Revenue Share (%), by Production Analysis 2025 & 2033
- Figure 78: Middle East and Africa Marine Gas Oil Market Volume Share (%), by Production Analysis 2025 & 2033
- Figure 79: Middle East and Africa Marine Gas Oil Market Revenue (billion), by Consumption Analysis 2025 & 2033
- Figure 80: Middle East and Africa Marine Gas Oil Market Volume (Litre), by Consumption Analysis 2025 & 2033
- Figure 81: Middle East and Africa Marine Gas Oil Market Revenue Share (%), by Consumption Analysis 2025 & 2033
- Figure 82: Middle East and Africa Marine Gas Oil Market Volume Share (%), by Consumption Analysis 2025 & 2033
- Figure 83: Middle East and Africa Marine Gas Oil Market Revenue (billion), by Import Market Analysis (Value & Volume) 2025 & 2033
- Figure 84: Middle East and Africa Marine Gas Oil Market Volume (Litre), by Import Market Analysis (Value & Volume) 2025 & 2033
- Figure 85: Middle East and Africa Marine Gas Oil Market Revenue Share (%), by Import Market Analysis (Value & Volume) 2025 & 2033
- Figure 86: Middle East and Africa Marine Gas Oil Market Volume Share (%), by Import Market Analysis (Value & Volume) 2025 & 2033
- Figure 87: Middle East and Africa Marine Gas Oil Market Revenue (billion), by Export Market Analysis (Value & Volume) 2025 & 2033
- Figure 88: Middle East and Africa Marine Gas Oil Market Volume (Litre), by Export Market Analysis (Value & Volume) 2025 & 2033
- Figure 89: Middle East and Africa Marine Gas Oil Market Revenue Share (%), by Export Market Analysis (Value & Volume) 2025 & 2033
- Figure 90: Middle East and Africa Marine Gas Oil Market Volume Share (%), by Export Market Analysis (Value & Volume) 2025 & 2033
- Figure 91: Middle East and Africa Marine Gas Oil Market Revenue (billion), by Price Trend Analysis 2025 & 2033
- Figure 92: Middle East and Africa Marine Gas Oil Market Volume (Litre), by Price Trend Analysis 2025 & 2033
- Figure 93: Middle East and Africa Marine Gas Oil Market Revenue Share (%), by Price Trend Analysis 2025 & 2033
- Figure 94: Middle East and Africa Marine Gas Oil Market Volume Share (%), by Price Trend Analysis 2025 & 2033
- Figure 95: Middle East and Africa Marine Gas Oil Market Revenue (billion), by Country 2025 & 2033
- Figure 96: Middle East and Africa Marine Gas Oil Market Volume (Litre), by Country 2025 & 2033
- Figure 97: Middle East and Africa Marine Gas Oil Market Revenue Share (%), by Country 2025 & 2033
- Figure 98: Middle East and Africa Marine Gas Oil Market Volume Share (%), by Country 2025 & 2033
- Figure 99: South America Marine Gas Oil Market Revenue (billion), by Production Analysis 2025 & 2033
- Figure 100: South America Marine Gas Oil Market Volume (Litre), by Production Analysis 2025 & 2033
- Figure 101: South America Marine Gas Oil Market Revenue Share (%), by Production Analysis 2025 & 2033
- Figure 102: South America Marine Gas Oil Market Volume Share (%), by Production Analysis 2025 & 2033
- Figure 103: South America Marine Gas Oil Market Revenue (billion), by Consumption Analysis 2025 & 2033
- Figure 104: South America Marine Gas Oil Market Volume (Litre), by Consumption Analysis 2025 & 2033
- Figure 105: South America Marine Gas Oil Market Revenue Share (%), by Consumption Analysis 2025 & 2033
- Figure 106: South America Marine Gas Oil Market Volume Share (%), by Consumption Analysis 2025 & 2033
- Figure 107: South America Marine Gas Oil Market Revenue (billion), by Import Market Analysis (Value & Volume) 2025 & 2033
- Figure 108: South America Marine Gas Oil Market Volume (Litre), by Import Market Analysis (Value & Volume) 2025 & 2033
- Figure 109: South America Marine Gas Oil Market Revenue Share (%), by Import Market Analysis (Value & Volume) 2025 & 2033
- Figure 110: South America Marine Gas Oil Market Volume Share (%), by Import Market Analysis (Value & Volume) 2025 & 2033
- Figure 111: South America Marine Gas Oil Market Revenue (billion), by Export Market Analysis (Value & Volume) 2025 & 2033
- Figure 112: South America Marine Gas Oil Market Volume (Litre), by Export Market Analysis (Value & Volume) 2025 & 2033
- Figure 113: South America Marine Gas Oil Market Revenue Share (%), by Export Market Analysis (Value & Volume) 2025 & 2033
- Figure 114: South America Marine Gas Oil Market Volume Share (%), by Export Market Analysis (Value & Volume) 2025 & 2033
- Figure 115: South America Marine Gas Oil Market Revenue (billion), by Price Trend Analysis 2025 & 2033
- Figure 116: South America Marine Gas Oil Market Volume (Litre), by Price Trend Analysis 2025 & 2033
- Figure 117: South America Marine Gas Oil Market Revenue Share (%), by Price Trend Analysis 2025 & 2033
- Figure 118: South America Marine Gas Oil Market Volume Share (%), by Price Trend Analysis 2025 & 2033
- Figure 119: South America Marine Gas Oil Market Revenue (billion), by Country 2025 & 2033
- Figure 120: South America Marine Gas Oil Market Volume (Litre), by Country 2025 & 2033
- Figure 121: South America Marine Gas Oil Market Revenue Share (%), by Country 2025 & 2033
- Figure 122: South America Marine Gas Oil Market Volume Share (%), by Country 2025 & 2033
List of Tables
- Table 1: Global Marine Gas Oil Market Revenue billion Forecast, by Production Analysis 2020 & 2033
- Table 2: Global Marine Gas Oil Market Volume Litre Forecast, by Production Analysis 2020 & 2033
- Table 3: Global Marine Gas Oil Market Revenue billion Forecast, by Consumption Analysis 2020 & 2033
- Table 4: Global Marine Gas Oil Market Volume Litre Forecast, by Consumption Analysis 2020 & 2033
- Table 5: Global Marine Gas Oil Market Revenue billion Forecast, by Import Market Analysis (Value & Volume) 2020 & 2033
- Table 6: Global Marine Gas Oil Market Volume Litre Forecast, by Import Market Analysis (Value & Volume) 2020 & 2033
- Table 7: Global Marine Gas Oil Market Revenue billion Forecast, by Export Market Analysis (Value & Volume) 2020 & 2033
- Table 8: Global Marine Gas Oil Market Volume Litre Forecast, by Export Market Analysis (Value & Volume) 2020 & 2033
- Table 9: Global Marine Gas Oil Market Revenue billion Forecast, by Price Trend Analysis 2020 & 2033
- Table 10: Global Marine Gas Oil Market Volume Litre Forecast, by Price Trend Analysis 2020 & 2033
- Table 11: Global Marine Gas Oil Market Revenue billion Forecast, by Region 2020 & 2033
- Table 12: Global Marine Gas Oil Market Volume Litre Forecast, by Region 2020 & 2033
- Table 13: Global Marine Gas Oil Market Revenue billion Forecast, by Production Analysis 2020 & 2033
- Table 14: Global Marine Gas Oil Market Volume Litre Forecast, by Production Analysis 2020 & 2033
- Table 15: Global Marine Gas Oil Market Revenue billion Forecast, by Consumption Analysis 2020 & 2033
- Table 16: Global Marine Gas Oil Market Volume Litre Forecast, by Consumption Analysis 2020 & 2033
- Table 17: Global Marine Gas Oil Market Revenue billion Forecast, by Import Market Analysis (Value & Volume) 2020 & 2033
- Table 18: Global Marine Gas Oil Market Volume Litre Forecast, by Import Market Analysis (Value & Volume) 2020 & 2033
- Table 19: Global Marine Gas Oil Market Revenue billion Forecast, by Export Market Analysis (Value & Volume) 2020 & 2033
- Table 20: Global Marine Gas Oil Market Volume Litre Forecast, by Export Market Analysis (Value & Volume) 2020 & 2033
- Table 21: Global Marine Gas Oil Market Revenue billion Forecast, by Price Trend Analysis 2020 & 2033
- Table 22: Global Marine Gas Oil Market Volume Litre Forecast, by Price Trend Analysis 2020 & 2033
- Table 23: Global Marine Gas Oil Market Revenue billion Forecast, by Country 2020 & 2033
- Table 24: Global Marine Gas Oil Market Volume Litre Forecast, by Country 2020 & 2033
- Table 25: United States Marine Gas Oil Market Revenue (billion) Forecast, by Application 2020 & 2033
- Table 26: United States Marine Gas Oil Market Volume (Litre) Forecast, by Application 2020 & 2033
- Table 27: Canada Marine Gas Oil Market Revenue (billion) Forecast, by Application 2020 & 2033
- Table 28: Canada Marine Gas Oil Market Volume (Litre) Forecast, by Application 2020 & 2033
- Table 29: Rest of North America Marine Gas Oil Market Revenue (billion) Forecast, by Application 2020 & 2033
- Table 30: Rest of North America Marine Gas Oil Market Volume (Litre) Forecast, by Application 2020 & 2033
- Table 31: Global Marine Gas Oil Market Revenue billion Forecast, by Production Analysis 2020 & 2033
- Table 32: Global Marine Gas Oil Market Volume Litre Forecast, by Production Analysis 2020 & 2033
- Table 33: Global Marine Gas Oil Market Revenue billion Forecast, by Consumption Analysis 2020 & 2033
- Table 34: Global Marine Gas Oil Market Volume Litre Forecast, by Consumption Analysis 2020 & 2033
- Table 35: Global Marine Gas Oil Market Revenue billion Forecast, by Import Market Analysis (Value & Volume) 2020 & 2033
- Table 36: Global Marine Gas Oil Market Volume Litre Forecast, by Import Market Analysis (Value & Volume) 2020 & 2033
- Table 37: Global Marine Gas Oil Market Revenue billion Forecast, by Export Market Analysis (Value & Volume) 2020 & 2033
- Table 38: Global Marine Gas Oil Market Volume Litre Forecast, by Export Market Analysis (Value & Volume) 2020 & 2033
- Table 39: Global Marine Gas Oil Market Revenue billion Forecast, by Price Trend Analysis 2020 & 2033
- Table 40: Global Marine Gas Oil Market Volume Litre Forecast, by Price Trend Analysis 2020 & 2033
- Table 41: Global Marine Gas Oil Market Revenue billion Forecast, by Country 2020 & 2033
- Table 42: Global Marine Gas Oil Market Volume Litre Forecast, by Country 2020 & 2033
- Table 43: United Kingdom Marine Gas Oil Market Revenue (billion) Forecast, by Application 2020 & 2033
- Table 44: United Kingdom Marine Gas Oil Market Volume (Litre) Forecast, by Application 2020 & 2033
- Table 45: France Marine Gas Oil Market Revenue (billion) Forecast, by Application 2020 & 2033
- Table 46: France Marine Gas Oil Market Volume (Litre) Forecast, by Application 2020 & 2033
- Table 47: Germany Marine Gas Oil Market Revenue (billion) Forecast, by Application 2020 & 2033
- Table 48: Germany Marine Gas Oil Market Volume (Litre) Forecast, by Application 2020 & 2033
- Table 49: Italy Marine Gas Oil Market Revenue (billion) Forecast, by Application 2020 & 2033
- Table 50: Italy Marine Gas Oil Market Volume (Litre) Forecast, by Application 2020 & 2033
- Table 51: Russian Federation Marine Gas Oil Market Revenue (billion) Forecast, by Application 2020 & 2033
- Table 52: Russian Federation Marine Gas Oil Market Volume (Litre) Forecast, by Application 2020 & 2033
- Table 53: Rest of Europe Marine Gas Oil Market Revenue (billion) Forecast, by Application 2020 & 2033
- Table 54: Rest of Europe Marine Gas Oil Market Volume (Litre) Forecast, by Application 2020 & 2033
- Table 55: Global Marine Gas Oil Market Revenue billion Forecast, by Production Analysis 2020 & 2033
- Table 56: Global Marine Gas Oil Market Volume Litre Forecast, by Production Analysis 2020 & 2033
- Table 57: Global Marine Gas Oil Market Revenue billion Forecast, by Consumption Analysis 2020 & 2033
- Table 58: Global Marine Gas Oil Market Volume Litre Forecast, by Consumption Analysis 2020 & 2033
- Table 59: Global Marine Gas Oil Market Revenue billion Forecast, by Import Market Analysis (Value & Volume) 2020 & 2033
- Table 60: Global Marine Gas Oil Market Volume Litre Forecast, by Import Market Analysis (Value & Volume) 2020 & 2033
- Table 61: Global Marine Gas Oil Market Revenue billion Forecast, by Export Market Analysis (Value & Volume) 2020 & 2033
- Table 62: Global Marine Gas Oil Market Volume Litre Forecast, by Export Market Analysis (Value & Volume) 2020 & 2033
- Table 63: Global Marine Gas Oil Market Revenue billion Forecast, by Price Trend Analysis 2020 & 2033
- Table 64: Global Marine Gas Oil Market Volume Litre Forecast, by Price Trend Analysis 2020 & 2033
- Table 65: Global Marine Gas Oil Market Revenue billion Forecast, by Country 2020 & 2033
- Table 66: Global Marine Gas Oil Market Volume Litre Forecast, by Country 2020 & 2033
- Table 67: China Marine Gas Oil Market Revenue (billion) Forecast, by Application 2020 & 2033
- Table 68: China Marine Gas Oil Market Volume (Litre) Forecast, by Application 2020 & 2033
- Table 69: India Marine Gas Oil Market Revenue (billion) Forecast, by Application 2020 & 2033
- Table 70: India Marine Gas Oil Market Volume (Litre) Forecast, by Application 2020 & 2033
- Table 71: Malaysia Marine Gas Oil Market Revenue (billion) Forecast, by Application 2020 & 2033
- Table 72: Malaysia Marine Gas Oil Market Volume (Litre) Forecast, by Application 2020 & 2033
- Table 73: Japan Marine Gas Oil Market Revenue (billion) Forecast, by Application 2020 & 2033
- Table 74: Japan Marine Gas Oil Market Volume (Litre) Forecast, by Application 2020 & 2033
- Table 75: Australia Marine Gas Oil Market Revenue (billion) Forecast, by Application 2020 & 2033
- Table 76: Australia Marine Gas Oil Market Volume (Litre) Forecast, by Application 2020 & 2033
- Table 77: Rest of Asia Pacific Marine Gas Oil Market Revenue (billion) Forecast, by Application 2020 & 2033
- Table 78: Rest of Asia Pacific Marine Gas Oil Market Volume (Litre) Forecast, by Application 2020 & 2033
- Table 79: Global Marine Gas Oil Market Revenue billion Forecast, by Production Analysis 2020 & 2033
- Table 80: Global Marine Gas Oil Market Volume Litre Forecast, by Production Analysis 2020 & 2033
- Table 81: Global Marine Gas Oil Market Revenue billion Forecast, by Consumption Analysis 2020 & 2033
- Table 82: Global Marine Gas Oil Market Volume Litre Forecast, by Consumption Analysis 2020 & 2033
- Table 83: Global Marine Gas Oil Market Revenue billion Forecast, by Import Market Analysis (Value & Volume) 2020 & 2033
- Table 84: Global Marine Gas Oil Market Volume Litre Forecast, by Import Market Analysis (Value & Volume) 2020 & 2033
- Table 85: Global Marine Gas Oil Market Revenue billion Forecast, by Export Market Analysis (Value & Volume) 2020 & 2033
- Table 86: Global Marine Gas Oil Market Volume Litre Forecast, by Export Market Analysis (Value & Volume) 2020 & 2033
- Table 87: Global Marine Gas Oil Market Revenue billion Forecast, by Price Trend Analysis 2020 & 2033
- Table 88: Global Marine Gas Oil Market Volume Litre Forecast, by Price Trend Analysis 2020 & 2033
- Table 89: Global Marine Gas Oil Market Revenue billion Forecast, by Country 2020 & 2033
- Table 90: Global Marine Gas Oil Market Volume Litre Forecast, by Country 2020 & 2033
- Table 91: Saudi Arabia Marine Gas Oil Market Revenue (billion) Forecast, by Application 2020 & 2033
- Table 92: Saudi Arabia Marine Gas Oil Market Volume (Litre) Forecast, by Application 2020 & 2033
- Table 93: United Arab Emirates Marine Gas Oil Market Revenue (billion) Forecast, by Application 2020 & 2033
- Table 94: United Arab Emirates Marine Gas Oil Market Volume (Litre) Forecast, by Application 2020 & 2033
- Table 95: Egypt Marine Gas Oil Market Revenue (billion) Forecast, by Application 2020 & 2033
- Table 96: Egypt Marine Gas Oil Market Volume (Litre) Forecast, by Application 2020 & 2033
- Table 97: South America Marine Gas Oil Market Revenue (billion) Forecast, by Application 2020 & 2033
- Table 98: South America Marine Gas Oil Market Volume (Litre) Forecast, by Application 2020 & 2033
- Table 99: Morocco Marine Gas Oil Market Revenue (billion) Forecast, by Application 2020 & 2033
- Table 100: Morocco Marine Gas Oil Market Volume (Litre) Forecast, by Application 2020 & 2033
- Table 101: Rest of Middle East and Africa Marine Gas Oil Market Revenue (billion) Forecast, by Application 2020 & 2033
- Table 102: Rest of Middle East and Africa Marine Gas Oil Market Volume (Litre) Forecast, by Application 2020 & 2033
- Table 103: Global Marine Gas Oil Market Revenue billion Forecast, by Production Analysis 2020 & 2033
- Table 104: Global Marine Gas Oil Market Volume Litre Forecast, by Production Analysis 2020 & 2033
- Table 105: Global Marine Gas Oil Market Revenue billion Forecast, by Consumption Analysis 2020 & 2033
- Table 106: Global Marine Gas Oil Market Volume Litre Forecast, by Consumption Analysis 2020 & 2033
- Table 107: Global Marine Gas Oil Market Revenue billion Forecast, by Import Market Analysis (Value & Volume) 2020 & 2033
- Table 108: Global Marine Gas Oil Market Volume Litre Forecast, by Import Market Analysis (Value & Volume) 2020 & 2033
- Table 109: Global Marine Gas Oil Market Revenue billion Forecast, by Export Market Analysis (Value & Volume) 2020 & 2033
- Table 110: Global Marine Gas Oil Market Volume Litre Forecast, by Export Market Analysis (Value & Volume) 2020 & 2033
- Table 111: Global Marine Gas Oil Market Revenue billion Forecast, by Price Trend Analysis 2020 & 2033
- Table 112: Global Marine Gas Oil Market Volume Litre Forecast, by Price Trend Analysis 2020 & 2033
- Table 113: Global Marine Gas Oil Market Revenue billion Forecast, by Country 2020 & 2033
- Table 114: Global Marine Gas Oil Market Volume Litre Forecast, by Country 2020 & 2033
- Table 115: Brazil Marine Gas Oil Market Revenue (billion) Forecast, by Application 2020 & 2033
- Table 116: Brazil Marine Gas Oil Market Volume (Litre) Forecast, by Application 2020 & 2033
- Table 117: Argentina Marine Gas Oil Market Revenue (billion) Forecast, by Application 2020 & 2033
- Table 118: Argentina Marine Gas Oil Market Volume (Litre) Forecast, by Application 2020 & 2033
- Table 119: Rest of South America Marine Gas Oil Market Revenue (billion) Forecast, by Application 2020 & 2033
- Table 120: Rest of South America Marine Gas Oil Market Volume (Litre) Forecast, by Application 2020 & 2033
Frequently Asked Questions
1. What is the projected Compound Annual Growth Rate (CAGR) of the Marine Gas Oil Market?
The projected CAGR is approximately 5.5%.
2. Which companies are prominent players in the Marine Gas Oil Market?
Key companies in the market include ExxonMobil Corporation, Shell PLC, PJSC Lukoil Oil Company, Gulf Agency Company Ltd, Gazprom Neft PJSC, Chevron Corporation, Clipper Oil, TotalEnergies SE, BP PLC, Bomin Bunker Fuel Holding GMBH & Co KG.
3. What are the main segments of the Marine Gas Oil Market?
The market segments include Production Analysis, Consumption Analysis, Import Market Analysis (Value & Volume), Export Market Analysis (Value & Volume), Price Trend Analysis.
4. Can you provide details about the market size?
The market size is estimated to be USD 28.6 billion as of 2022.
5. What are some drivers contributing to market growth?
4.; Modernization and Upgrades of Existing Military Aircraft Fleets4.; Increasing Defense Budgets.
6. What are the notable trends driving market growth?
Offshore Support Vessel (OSV) Segment to be the Fastest-Growing.
7. Are there any restraints impacting market growth?
4.; Shift Toward Unmanned Aircraft.
8. Can you provide examples of recent developments in the market?
May 2022: Neste OYJ, in collaboration with its partner Nordic Marine Oil, started piloting a new Neste Marine 0.1 Co-processed marine fuel in Scandinavia to reduce greenhouse emissions. The fuel is based on Neste Marine 0.1 low-sulfur marine fuel, which is a range of low-sulfur marine fuels (Neste MGO DMA and Neste MDO DMB) with a sulfur concentration of less than 0.1%
9. What pricing options are available for accessing the report?
Pricing options include single-user, multi-user, and enterprise licenses priced at USD 4750, USD 5250, and USD 8750 respectively.
10. Is the market size provided in terms of value or volume?
The market size is provided in terms of value, measured in billion and volume, measured in Litre.
11. Are there any specific market keywords associated with the report?
Yes, the market keyword associated with the report is "Marine Gas Oil Market," which aids in identifying and referencing the specific market segment covered.
12. How do I determine which pricing option suits my needs best?
The pricing options vary based on user requirements and access needs. Individual users may opt for single-user licenses, while businesses requiring broader access may choose multi-user or enterprise licenses for cost-effective access to the report.
13. Are there any additional resources or data provided in the Marine Gas Oil Market report?
While the report offers comprehensive insights, it's advisable to review the specific contents or supplementary materials provided to ascertain if additional resources or data are available.
14. How can I stay updated on further developments or reports in the Marine Gas Oil Market?
To stay informed about further developments, trends, and reports in the Marine Gas Oil Market, consider subscribing to industry newsletters, following relevant companies and organizations, or regularly checking reputable industry news sources and publications.
Methodology
Step 1 - Identification of Relevant Samples Size from Population Database


Step 2 - Approaches for Defining Global Market Size (Value, Volume* & Price*)

Note*: In applicable scenarios
Step 3 - Data Sources
Primary Research
- Web Analytics
- Survey Reports
- Research Institute
- Latest Research Reports
- Opinion Leaders
Secondary Research
- Annual Reports
- White Paper
- Latest Press Release
- Industry Association
- Paid Database
- Investor Presentations

Step 4 - Data Triangulation
Involves using different sources of information in order to increase the validity of a study
These sources are likely to be stakeholders in a program - participants, other researchers, program staff, other community members, and so on.
Then we put all data in single framework & apply various statistical tools to find out the dynamic on the market.
During the analysis stage, feedback from the stakeholder groups would be compared to determine areas of agreement as well as areas of divergence