

Key Insights
The global Liquefied Petroleum Gas (LPG) market is projected to reach $123.14 billion by 2024, with a Compound Annual Growth Rate (CAGR) of 3.9%. This expansion is driven by rapid urbanization and industrialization in emerging economies, particularly in India and China, increasing demand for LPG as a primary cooking fuel and industrial feedstock. The growing adoption of LPG as an alternative fuel in the transportation sector, especially in areas with limited natural gas infrastructure, further accelerates market growth. Government initiatives promoting cleaner cooking solutions and stringent environmental regulations are also significant contributors to increased LPG consumption. Key challenges include the price volatility associated with crude oil fluctuations and competition from alternative energy sources like biogas and electricity. Moreover, ensuring safety in LPG storage and handling requires ongoing enhancements in infrastructure and regulatory compliance. The market is segmented by source (crude oil and natural gas liquids) and application (residential, commercial & industrial, autofuels, and others), with residential and commercial segments currently holding the largest market share. Leading industry players such as Exxon Mobil, Novatek, and Sinopec are strategically expanding their operations and focusing on supply chain optimization and technological innovation to improve efficiency and safety.
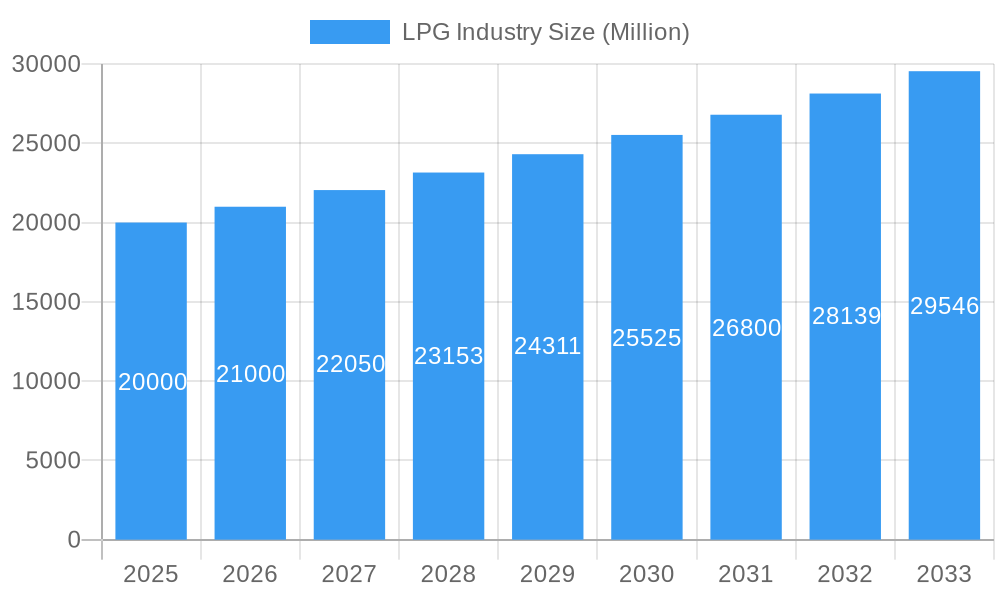
LPG Industry Market Size (In Billion)
Geographically, the LPG market exhibits diverse growth patterns influenced by economic development and energy consumption trends. North America and the Asia-Pacific region are significant market contributors, propelled by strong economies and escalating energy demands. The Middle East and Africa are anticipated to experience substantial expansion due to industrial development and infrastructure projects. Europe's mature LPG markets are projected to achieve moderate growth driven by sustained industrial needs and energy diversification efforts. South America is expected to see gradual growth, influenced by economic dynamics and the availability of competing energy options. Future growth will be shaped by advancements in LPG production and distribution technologies, alongside the adoption of sustainable practices. The forecast period of 2025-2033 indicates continued market expansion, subject to global economic conditions and the uptake of alternative energy solutions.
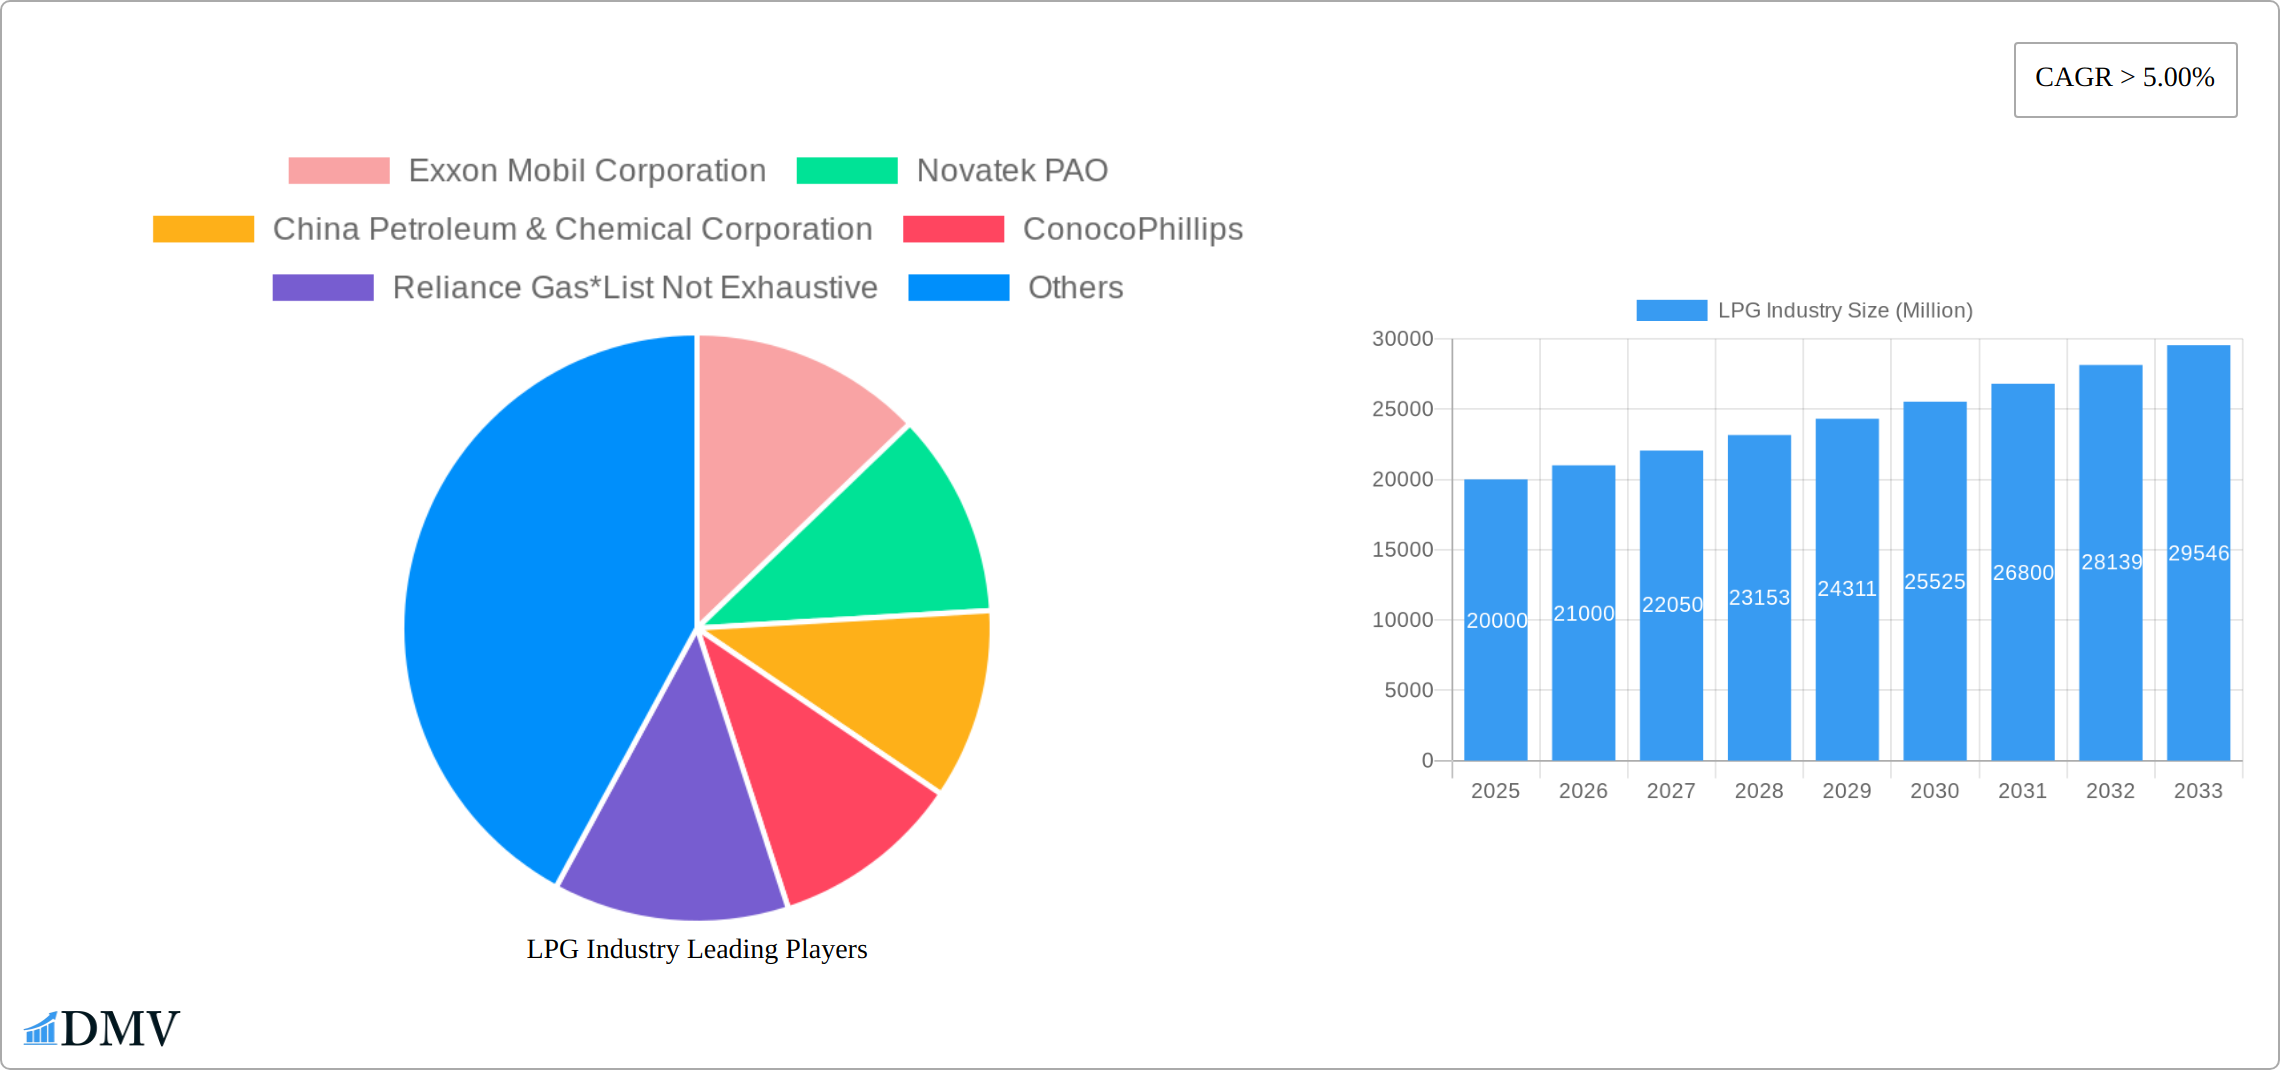
LPG Industry Company Market Share
LPG Industry Market Composition & Trends
The LPG industry, valued at over USD xx Million in 2025, showcases a dynamic landscape influenced by market concentration, innovation catalysts, regulatory environments, substitute products, end-user profiles, and merger and acquisition (M&A) activities. Market concentration is predominantly held by key players such as Exxon Mobil Corporation and BP PLC, with a combined market share of approximately 25%. Innovation is driven by the need for cleaner energy solutions, leading to advancements in extraction technologies and LPG utilization in new applications. Regulatory landscapes vary by region, with stringent environmental policies in Europe and North America promoting LPG as a cleaner alternative to traditional fuels. Substitute products like natural gas and electricity pose competitive threats, yet LPG's versatility in residential and industrial applications sustains its demand. End-user profiles indicate a rising trend in residential use, particularly in developing economies, spurred by urbanization. M&A activities have been notable, with deals valued at over USD 1.5 Billion in the past five years, aiming to consolidate market positions and expand production capacities.
- Market Share Distribution: Exxon Mobil and BP PLC hold a 25% share.
- Innovation Catalysts: Focus on cleaner energy solutions.
- Regulatory Landscapes: Stringent in Europe and North America.
- Substitute Products: Natural gas and electricity as competitors.
- End-User Profiles: Increasing residential use in developing economies.
- M&A Deal Values: Over USD 1.5 Billion in the past five years.
LPG Industry Industry Evolution
The evolution of the LPG industry from 2019 to 2033 reflects significant market growth, technological advancements, and shifting consumer demands. The industry has witnessed a compound annual growth rate (CAGR) of 4.5% during the historical period from 2019 to 2024, propelled by increasing demand for cleaner energy sources and industrial applications. Technological advancements, particularly in LPG extraction and storage, have enhanced efficiency and safety, with adoption rates of new technologies reaching 60% among leading producers. Consumer demands have shifted towards more sustainable and versatile energy solutions, leading to a 30% increase in LPG usage in residential sectors over the last decade. This shift is supported by government initiatives promoting LPG as a cleaner alternative to traditional fuels, further boosting market growth. The forecast period from 2025 to 2033 anticipates a continued growth trajectory, driven by ongoing innovations and expanding applications in commercial and industrial sectors.
Leading Regions, Countries, or Segments in LPG Industry
The Asia-Pacific region holds the dominant position in the global LPG industry, fueled by strong demand in major economies like China and India. While crude oil remains the primary feedstock, contributing approximately 65% of global LPG production, natural gas liquids account for the remaining 35%. Analyzing consumption patterns reveals that the residential sector is the largest consumer, claiming roughly 40% of market share. This significant demand is driven by government subsidies in many developing nations, promoting wider household adoption and access to cleaner cooking fuels. The commercial and industrial sectors follow closely behind, utilizing LPG in manufacturing processes and energy-intensive industries. Furthermore, the autofuels segment is experiencing robust growth, with LPG vehicles gaining popularity due to their cost-effectiveness and lower environmental impact compared to traditional gasoline or diesel vehicles.
Key Drivers in Asia-Pacific:
Significant investments in clean energy infrastructure development.
Supportive government regulations promoting LPG as a cleaner and more sustainable fuel alternative.
Rapid urbanization and substantial industrial expansion driving increased energy demand.
Dominance of Crude Oil:
Existing, well-established infrastructure for efficient crude oil extraction and processing.
Cost-effective and scalable production methods contribute to economies of scale.
Residential Sector Dominance:
Government subsidies and targeted marketing campaigns aimed at increasing LPG adoption.
Rising household incomes and expanding energy access in developing economies.
Growth in the Autofuels Segment:
Stringent environmental regulations incentivizing the adoption of cleaner fuel alternatives.
The competitive pricing of LPG vehicles compared to gasoline or diesel counterparts.
LPG Industry Product Innovations
Innovation within the LPG industry centers on enhancing safety, improving operational efficiency, and reducing the environmental footprint. Recent advancements include the development of sophisticated LPG cylinders equipped with integrated safety features, leak detection systems, and smart monitoring capabilities that track gas usage and provide real-time data. Simultaneously, breakthroughs in LPG extraction and processing technologies have resulted in increased yield, reduced emissions, and improved overall process efficiency, solidifying LPG's position as a competitive and sustainable fuel source. These innovations highlight LPG's key advantages: its clean-burning properties and versatility across diverse applications.
Propelling Factors for LPG Industry Growth
The LPG industry's continued growth is fueled by a confluence of factors. Technological advancements in extraction, transportation, and storage enhance efficiency and safety, fostering market expansion. Economic drivers, such as the rising demand for cleaner energy sources in emerging markets and the increasing affordability of LPG, are significant catalysts. Crucially, supportive regulatory environments, including government subsidies and environmental policies favoring LPG adoption, significantly accelerate growth. For example, India's proactive initiative to expand LPG access to rural households has resulted in a remarkable 20% surge in domestic consumption within the last five years, highlighting the impact of policy support.
Obstacles in the LPG Industry Market
The LPG industry faces several obstacles that could hinder its growth. Regulatory challenges, such as varying standards across regions, complicate market expansion. Supply chain disruptions, often due to geopolitical tensions, impact production and distribution. Competitive pressures from alternative fuels, like natural gas and electricity, pose significant threats. These obstacles have led to a 5% decrease in market growth in certain regions over the past two years.
Future Opportunities in LPG Industry
Emerging opportunities in the LPG industry include the expansion into new markets, particularly in Africa and Latin America, where demand for clean energy solutions is rising. Technological advancements, such as the development of LPG-powered vehicles and appliances, open new avenues for growth. Consumer trends towards sustainability and energy efficiency further enhance the market potential for LPG, with projections indicating a 10% increase in global demand by 2033.
Major Players in the LPG Industry Ecosystem
Key Developments in LPG Industry Industry
- October 2022: Maire Tecnimont S.p.A. announced that its principal subsidiary, Tecnimont S.p.A., was awarded an EPC contract by SONATRACH's Direction Centrale Engineering & Project Management for the execution of an LPG extraction plant within the existing Rhourde El Baguel oil and gas treatment complex in northeastern Algeria. The total contract value is around USD 380 Million. This development enhances Algeria's LPG production capacity and supports the country's energy diversification strategy.
- February 2022: Indian Oil Corp. (IOC) announced plans to construct three new plants in Northeast India to increase its LPG bottling capacity by nearly 53% or to 8 crore cylinders annually by 2030 to meet the growing demand in the region. The total investment in the plant expansion is likely to range between USD 43-46 Million. This expansion significantly boosts India's LPG distribution capabilities and addresses regional energy needs.
Strategic LPG Industry Market Forecast
The strategic forecast for the LPG industry highlights robust growth opportunities driven by technological advancements, expanding applications, and increasing demand for clean energy solutions. The market is expected to grow at a CAGR of 5% from 2025 to 2033, reaching a valuation of USD xx Million. Future opportunities include the development of LPG-powered vehicles and appliances, as well as market expansion into emerging economies. The industry's focus on sustainability and efficiency positions it well for continued growth and market potential.
LPG Industry Segmentation
-
1. Source of Production
- 1.1. Crude Oil
- 1.2. Natural Gas Liquids
-
2. Application
- 2.1. Residential
- 2.2. Commercial & Industrial
- 2.3. Autofuels
- 2.4. Other Applications
LPG Industry Segmentation By Geography
-
1. North America
- 1.1. United States
- 1.2. Canada
- 1.3. Rest of North America
-
2. Europe
- 2.1. Norway
- 2.2. Netherlands
- 2.3. United Kingdom
- 2.4. Germany
- 2.5. Rest of Europe
-
3. Asia Pacific
- 3.1. China
- 3.2. India
- 3.3. South Korea
- 3.4. Japan
- 3.5. Rest of Asia Pacific
-
4. Middle East and Africa
- 4.1. Saudi Arabia
- 4.2. Qatar
- 4.3. South Africa
- 4.4. Rest of Middle East and Africa
-
5. South America
- 5.1. Brazil
- 5.2. Argentina
- 5.3. Chile
- 5.4. Rest of South America
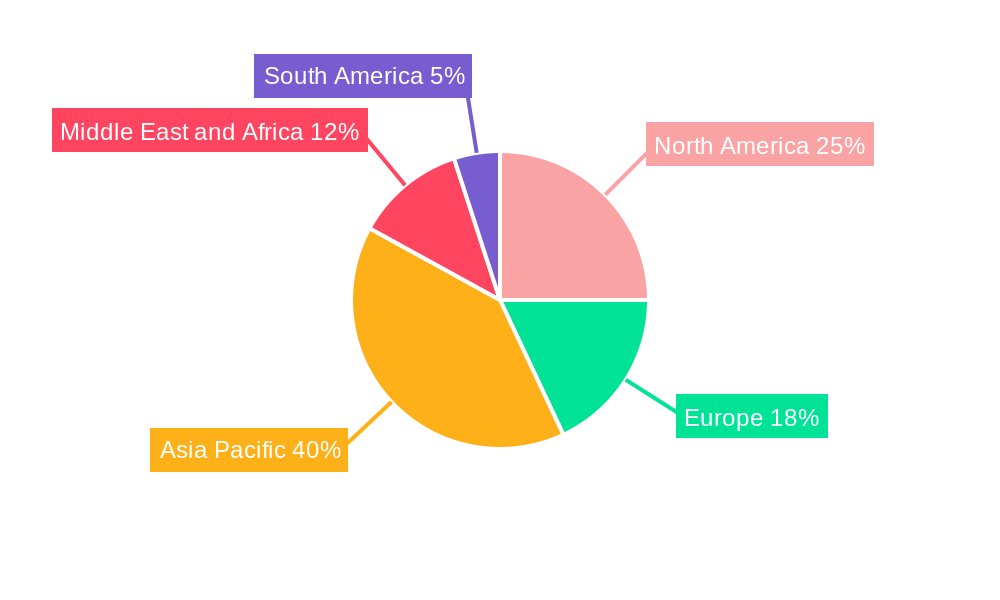
LPG Industry Regional Market Share
Geographic Coverage of LPG Industry
LPG Industry REPORT HIGHLIGHTS
| Aspects | Details |
|---|---|
| Study Period | 2020-2034 |
| Base Year | 2025 |
| Estimated Year | 2026 |
| Forecast Period | 2026-2034 |
| Historical Period | 2020-2025 |
| Growth Rate | CAGR of 3.9% from 2020-2034 |
| Segmentation |
|
Table of Contents
- 1. Introduction
- 1.1. Research Scope
- 1.2. Market Segmentation
- 1.3. Research Objective
- 1.4. Definitions and Assumptions
- 2. Executive Summary
- 2.1. Market Snapshot
- 3. Market Dynamics
- 3.1. Market Drivers
- 3.2. Market Restrains
- 3.3. Market Trends
- 3.4. Market Opportunities
- 4. Market Factor Analysis
- 4.1. Porters Five Forces
- 4.1.1. Bargaining Power of Suppliers
- 4.1.2. Bargaining Power of Buyers
- 4.1.3. Threat of New Entrants
- 4.1.4. Threat of Substitutes
- 4.1.5. Competitive Rivalry
- 4.2. PESTEL analysis
- 4.3. BCG Analysis
- 4.3.1. Stars (High Growth, High Market Share)
- 4.3.2. Cash Cows (Low Growth, High Market Share)
- 4.3.3. Question Mark (High Growth, Low Market Share)
- 4.3.4. Dogs (Low Growth, Low Market Share)
- 4.4. Ansoff Matrix Analysis
- 4.5. Supply Chain Analysis
- 4.6. Regulatory Landscape
- 4.7. Current Market Potential and Opportunity Assessment (TAM–SAM–SOM Framework)
- 4.8. DMV Analyst Note
- 4.1. Porters Five Forces
- 5. Market Analysis, Insights and Forecast 2021-2033
- 5.1. Market Analysis, Insights and Forecast - by Source of Production
- 5.1.1. Crude Oil
- 5.1.2. Natural Gas Liquids
- 5.2. Market Analysis, Insights and Forecast - by Application
- 5.2.1. Residential
- 5.2.2. Commercial & Industrial
- 5.2.3. Autofuels
- 5.2.4. Other Applications
- 5.3. Market Analysis, Insights and Forecast - by Region
- 5.3.1. North America
- 5.3.2. Europe
- 5.3.3. Asia Pacific
- 5.3.4. Middle East and Africa
- 5.3.5. South America
- 5.1. Market Analysis, Insights and Forecast - by Source of Production
- 6. Global LPG Industry Analysis, Insights and Forecast, 2021-2033
- 6.1. Market Analysis, Insights and Forecast - by Source of Production
- 6.1.1. Crude Oil
- 6.1.2. Natural Gas Liquids
- 6.2. Market Analysis, Insights and Forecast - by Application
- 6.2.1. Residential
- 6.2.2. Commercial & Industrial
- 6.2.3. Autofuels
- 6.2.4. Other Applications
- 6.1. Market Analysis, Insights and Forecast - by Source of Production
- 7. North America LPG Industry Analysis, Insights and Forecast, 2020-2032
- 7.1. Market Analysis, Insights and Forecast - by Source of Production
- 7.1.1. Crude Oil
- 7.1.2. Natural Gas Liquids
- 7.2. Market Analysis, Insights and Forecast - by Application
- 7.2.1. Residential
- 7.2.2. Commercial & Industrial
- 7.2.3. Autofuels
- 7.2.4. Other Applications
- 7.1. Market Analysis, Insights and Forecast - by Source of Production
- 8. Europe LPG Industry Analysis, Insights and Forecast, 2020-2032
- 8.1. Market Analysis, Insights and Forecast - by Source of Production
- 8.1.1. Crude Oil
- 8.1.2. Natural Gas Liquids
- 8.2. Market Analysis, Insights and Forecast - by Application
- 8.2.1. Residential
- 8.2.2. Commercial & Industrial
- 8.2.3. Autofuels
- 8.2.4. Other Applications
- 8.1. Market Analysis, Insights and Forecast - by Source of Production
- 9. Asia Pacific LPG Industry Analysis, Insights and Forecast, 2020-2032
- 9.1. Market Analysis, Insights and Forecast - by Source of Production
- 9.1.1. Crude Oil
- 9.1.2. Natural Gas Liquids
- 9.2. Market Analysis, Insights and Forecast - by Application
- 9.2.1. Residential
- 9.2.2. Commercial & Industrial
- 9.2.3. Autofuels
- 9.2.4. Other Applications
- 9.1. Market Analysis, Insights and Forecast - by Source of Production
- 10. Middle East and Africa LPG Industry Analysis, Insights and Forecast, 2020-2032
- 10.1. Market Analysis, Insights and Forecast - by Source of Production
- 10.1.1. Crude Oil
- 10.1.2. Natural Gas Liquids
- 10.2. Market Analysis, Insights and Forecast - by Application
- 10.2.1. Residential
- 10.2.2. Commercial & Industrial
- 10.2.3. Autofuels
- 10.2.4. Other Applications
- 10.1. Market Analysis, Insights and Forecast - by Source of Production
- 11. South America LPG Industry Analysis, Insights and Forecast, 2020-2032
- 11.1. Market Analysis, Insights and Forecast - by Source of Production
- 11.1.1. Crude Oil
- 11.1.2. Natural Gas Liquids
- 11.2. Market Analysis, Insights and Forecast - by Application
- 11.2.1. Residential
- 11.2.2. Commercial & Industrial
- 11.2.3. Autofuels
- 11.2.4. Other Applications
- 11.1. Market Analysis, Insights and Forecast - by Source of Production
- 12. Competitive Analysis
- 12.1. Company Profiles
- 12.1.1 Exxon Mobil Corporation
- 12.1.1.1. Company Overview
- 12.1.1.2. Products
- 12.1.1.3. Company Financials
- 12.1.1.4. SWOT Analysis
- 12.1.2 Novatek PAO
- 12.1.2.1. Company Overview
- 12.1.2.2. Products
- 12.1.2.3. Company Financials
- 12.1.2.4. SWOT Analysis
- 12.1.3 China Petroleum & Chemical Corporation
- 12.1.3.1. Company Overview
- 12.1.3.2. Products
- 12.1.3.3. Company Financials
- 12.1.3.4. SWOT Analysis
- 12.1.4 ConocoPhillips
- 12.1.4.1. Company Overview
- 12.1.4.2. Products
- 12.1.4.3. Company Financials
- 12.1.4.4. SWOT Analysis
- 12.1.5 Reliance Gas*List Not Exhaustive
- 12.1.5.1. Company Overview
- 12.1.5.2. Products
- 12.1.5.3. Company Financials
- 12.1.5.4. SWOT Analysis
- 12.1.6 QatarEnergy
- 12.1.6.1. Company Overview
- 12.1.6.2. Products
- 12.1.6.3. Company Financials
- 12.1.6.4. SWOT Analysis
- 12.1.7 BP PLC
- 12.1.7.1. Company Overview
- 12.1.7.2. Products
- 12.1.7.3. Company Financials
- 12.1.7.4. SWOT Analysis
- 12.1.8 Indian Oil Corporation Ltd
- 12.1.8.1. Company Overview
- 12.1.8.2. Products
- 12.1.8.3. Company Financials
- 12.1.8.4. SWOT Analysis
- 12.1.9 Gazprom PJSC
- 12.1.9.1. Company Overview
- 12.1.9.2. Products
- 12.1.9.3. Company Financials
- 12.1.9.4. SWOT Analysis
- 12.1.10 Abu Dhabi National Oil Company (ADNOC)
- 12.1.10.1. Company Overview
- 12.1.10.2. Products
- 12.1.10.3. Company Financials
- 12.1.10.4. SWOT Analysis
- 12.1.1 Exxon Mobil Corporation
- 12.2. Market Entropy
- 12.2.1 Company's Key Areas Served
- 12.2.2 Recent Developments
- 12.3. Company Market Share Analysis 2025
- 12.3.1 Top 5 Companies Market Share Analysis
- 12.3.2 Top 3 Companies Market Share Analysis
- 12.4. List of Potential Customers
- 13. Research Methodology
List of Figures
- Figure 1: Global LPG Industry Revenue Breakdown (billion, %) by Region 2025 & 2033
- Figure 2: North America LPG Industry Revenue (billion), by Source of Production 2025 & 2033
- Figure 3: North America LPG Industry Revenue Share (%), by Source of Production 2025 & 2033
- Figure 4: North America LPG Industry Revenue (billion), by Application 2025 & 2033
- Figure 5: North America LPG Industry Revenue Share (%), by Application 2025 & 2033
- Figure 6: North America LPG Industry Revenue (billion), by Country 2025 & 2033
- Figure 7: North America LPG Industry Revenue Share (%), by Country 2025 & 2033
- Figure 8: Europe LPG Industry Revenue (billion), by Source of Production 2025 & 2033
- Figure 9: Europe LPG Industry Revenue Share (%), by Source of Production 2025 & 2033
- Figure 10: Europe LPG Industry Revenue (billion), by Application 2025 & 2033
- Figure 11: Europe LPG Industry Revenue Share (%), by Application 2025 & 2033
- Figure 12: Europe LPG Industry Revenue (billion), by Country 2025 & 2033
- Figure 13: Europe LPG Industry Revenue Share (%), by Country 2025 & 2033
- Figure 14: Asia Pacific LPG Industry Revenue (billion), by Source of Production 2025 & 2033
- Figure 15: Asia Pacific LPG Industry Revenue Share (%), by Source of Production 2025 & 2033
- Figure 16: Asia Pacific LPG Industry Revenue (billion), by Application 2025 & 2033
- Figure 17: Asia Pacific LPG Industry Revenue Share (%), by Application 2025 & 2033
- Figure 18: Asia Pacific LPG Industry Revenue (billion), by Country 2025 & 2033
- Figure 19: Asia Pacific LPG Industry Revenue Share (%), by Country 2025 & 2033
- Figure 20: Middle East and Africa LPG Industry Revenue (billion), by Source of Production 2025 & 2033
- Figure 21: Middle East and Africa LPG Industry Revenue Share (%), by Source of Production 2025 & 2033
- Figure 22: Middle East and Africa LPG Industry Revenue (billion), by Application 2025 & 2033
- Figure 23: Middle East and Africa LPG Industry Revenue Share (%), by Application 2025 & 2033
- Figure 24: Middle East and Africa LPG Industry Revenue (billion), by Country 2025 & 2033
- Figure 25: Middle East and Africa LPG Industry Revenue Share (%), by Country 2025 & 2033
- Figure 26: South America LPG Industry Revenue (billion), by Source of Production 2025 & 2033
- Figure 27: South America LPG Industry Revenue Share (%), by Source of Production 2025 & 2033
- Figure 28: South America LPG Industry Revenue (billion), by Application 2025 & 2033
- Figure 29: South America LPG Industry Revenue Share (%), by Application 2025 & 2033
- Figure 30: South America LPG Industry Revenue (billion), by Country 2025 & 2033
- Figure 31: South America LPG Industry Revenue Share (%), by Country 2025 & 2033
List of Tables
- Table 1: Global LPG Industry Revenue billion Forecast, by Source of Production 2020 & 2033
- Table 2: Global LPG Industry Revenue billion Forecast, by Application 2020 & 2033
- Table 3: Global LPG Industry Revenue billion Forecast, by Region 2020 & 2033
- Table 4: Global LPG Industry Revenue billion Forecast, by Source of Production 2020 & 2033
- Table 5: Global LPG Industry Revenue billion Forecast, by Application 2020 & 2033
- Table 6: Global LPG Industry Revenue billion Forecast, by Country 2020 & 2033
- Table 7: United States LPG Industry Revenue (billion) Forecast, by Application 2020 & 2033
- Table 8: Canada LPG Industry Revenue (billion) Forecast, by Application 2020 & 2033
- Table 9: Rest of North America LPG Industry Revenue (billion) Forecast, by Application 2020 & 2033
- Table 10: Global LPG Industry Revenue billion Forecast, by Source of Production 2020 & 2033
- Table 11: Global LPG Industry Revenue billion Forecast, by Application 2020 & 2033
- Table 12: Global LPG Industry Revenue billion Forecast, by Country 2020 & 2033
- Table 13: Norway LPG Industry Revenue (billion) Forecast, by Application 2020 & 2033
- Table 14: Netherlands LPG Industry Revenue (billion) Forecast, by Application 2020 & 2033
- Table 15: United Kingdom LPG Industry Revenue (billion) Forecast, by Application 2020 & 2033
- Table 16: Germany LPG Industry Revenue (billion) Forecast, by Application 2020 & 2033
- Table 17: Rest of Europe LPG Industry Revenue (billion) Forecast, by Application 2020 & 2033
- Table 18: Global LPG Industry Revenue billion Forecast, by Source of Production 2020 & 2033
- Table 19: Global LPG Industry Revenue billion Forecast, by Application 2020 & 2033
- Table 20: Global LPG Industry Revenue billion Forecast, by Country 2020 & 2033
- Table 21: China LPG Industry Revenue (billion) Forecast, by Application 2020 & 2033
- Table 22: India LPG Industry Revenue (billion) Forecast, by Application 2020 & 2033
- Table 23: South Korea LPG Industry Revenue (billion) Forecast, by Application 2020 & 2033
- Table 24: Japan LPG Industry Revenue (billion) Forecast, by Application 2020 & 2033
- Table 25: Rest of Asia Pacific LPG Industry Revenue (billion) Forecast, by Application 2020 & 2033
- Table 26: Global LPG Industry Revenue billion Forecast, by Source of Production 2020 & 2033
- Table 27: Global LPG Industry Revenue billion Forecast, by Application 2020 & 2033
- Table 28: Global LPG Industry Revenue billion Forecast, by Country 2020 & 2033
- Table 29: Saudi Arabia LPG Industry Revenue (billion) Forecast, by Application 2020 & 2033
- Table 30: Qatar LPG Industry Revenue (billion) Forecast, by Application 2020 & 2033
- Table 31: South Africa LPG Industry Revenue (billion) Forecast, by Application 2020 & 2033
- Table 32: Rest of Middle East and Africa LPG Industry Revenue (billion) Forecast, by Application 2020 & 2033
- Table 33: Global LPG Industry Revenue billion Forecast, by Source of Production 2020 & 2033
- Table 34: Global LPG Industry Revenue billion Forecast, by Application 2020 & 2033
- Table 35: Global LPG Industry Revenue billion Forecast, by Country 2020 & 2033
- Table 36: Brazil LPG Industry Revenue (billion) Forecast, by Application 2020 & 2033
- Table 37: Argentina LPG Industry Revenue (billion) Forecast, by Application 2020 & 2033
- Table 38: Chile LPG Industry Revenue (billion) Forecast, by Application 2020 & 2033
- Table 39: Rest of South America LPG Industry Revenue (billion) Forecast, by Application 2020 & 2033
Frequently Asked Questions
1. What is the projected Compound Annual Growth Rate (CAGR) of the LPG Industry?
The projected CAGR is approximately 3.9%.
2. Which companies are prominent players in the LPG Industry?
Key companies in the market include Exxon Mobil Corporation, Novatek PAO, China Petroleum & Chemical Corporation, ConocoPhillips, Reliance Gas*List Not Exhaustive, QatarEnergy, BP PLC, Indian Oil Corporation Ltd, Gazprom PJSC, Abu Dhabi National Oil Company (ADNOC).
3. What are the main segments of the LPG Industry?
The market segments include Source of Production, Application.
4. Can you provide details about the market size?
The market size is estimated to be USD 123.14 billion as of 2022.
5. What are some drivers contributing to market growth?
4.; Increasing Demand for Gasoline and Diesel Across the Globe4.; Rapid Expansion of Automotive Industry.
6. What are the notable trends driving market growth?
LPG Extracted from Natural Gas Liquids to Dominate the Market.
7. Are there any restraints impacting market growth?
4.; Strict Mandates by the Global Organizations on VGO Composition.
8. Can you provide examples of recent developments in the market?
In October 2022, Maire Tecnimont S.p.A. announced that its principal subsidiary, Tecnimont S.p.A., was awarded an EPC contract by SONATRACH's Direction Centrale Engineering & Project Management for the execution of an LPG extraction plant within the existing Rhourde El Baguel oil and gas treatment complex in northeastern Algeria. The total contract value is around USD 380 million.
9. What pricing options are available for accessing the report?
Pricing options include single-user, multi-user, and enterprise licenses priced at USD 4750, USD 5250, and USD 8750 respectively.
10. Is the market size provided in terms of value or volume?
The market size is provided in terms of value, measured in billion.
11. Are there any specific market keywords associated with the report?
Yes, the market keyword associated with the report is "LPG Industry," which aids in identifying and referencing the specific market segment covered.
12. How do I determine which pricing option suits my needs best?
The pricing options vary based on user requirements and access needs. Individual users may opt for single-user licenses, while businesses requiring broader access may choose multi-user or enterprise licenses for cost-effective access to the report.
13. Are there any additional resources or data provided in the LPG Industry report?
While the report offers comprehensive insights, it's advisable to review the specific contents or supplementary materials provided to ascertain if additional resources or data are available.
14. How can I stay updated on further developments or reports in the LPG Industry?
To stay informed about further developments, trends, and reports in the LPG Industry, consider subscribing to industry newsletters, following relevant companies and organizations, or regularly checking reputable industry news sources and publications.
Methodology
Step 1 - Identification of Relevant Samples Size from Population Database


Step 2 - Approaches for Defining Global Market Size (Value, Volume* & Price*)

Note*: In applicable scenarios
Step 3 - Data Sources
Primary Research
- Web Analytics
- Survey Reports
- Research Institute
- Latest Research Reports
- Opinion Leaders
Secondary Research
- Annual Reports
- White Paper
- Latest Press Release
- Industry Association
- Paid Database
- Investor Presentations

Step 4 - Data Triangulation
Involves using different sources of information in order to increase the validity of a study
These sources are likely to be stakeholders in a program - participants, other researchers, program staff, other community members, and so on.
Then we put all data in single framework & apply various statistical tools to find out the dynamic on the market.
During the analysis stage, feedback from the stakeholder groups would be compared to determine areas of agreement as well as areas of divergence