


Key Insights
The Global Graphene Solar Photovoltaic Panels market is set for substantial growth, driven by graphene's exceptional conductivity, flexibility, and lightweight nature, overcoming traditional silicon limitations. With an estimated market size of $8.92 billion by 2025, the sector is projected to experience a compelling Compound Annual Growth Rate (CAGR) of 13.69% during the 2025-2033 forecast period. This expansion is fueled by escalating demand for high-efficiency solar solutions in applications like portable chargers, wearables, and building-integrated photovoltaics (BIPV). Graphene's inherent durability and potential for reduced manufacturing costs further enhance its market appeal, signaling a more sustainable and accessible solar energy future.
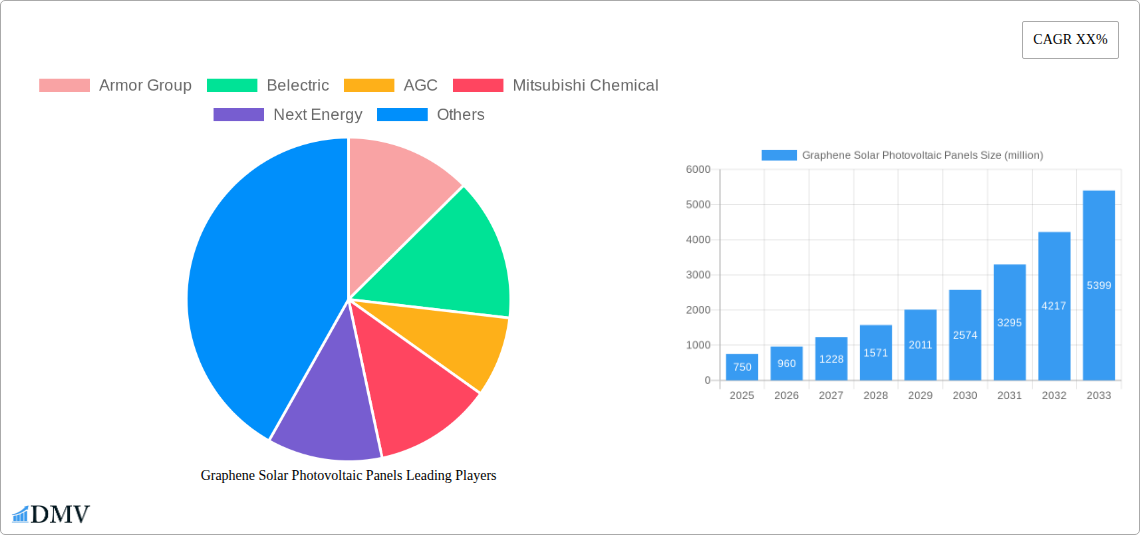
Graphene Solar Photovoltaic Panels Market Size (In Billion)

Market expansion is further propelled by innovations in graphene synthesis and integration, leading to advanced solar cell architectures such as planar heterojunction and bulk heterojunction designs. These advancements are boosting power conversion efficiencies and broadening application horizons. Leading companies including Armor Group, Belectric, AGC, and Mitsubishi Chemical are actively investing in R&D to commercialize next-generation solar technologies. Despite challenges in production scaling and long-term environmental stability, graphene's transformative potential in solar energy generation indicates sustained and dynamic market growth, with Asia Pacific and Europe anticipated to lead adoption, supported by supportive government policies and technological progress.
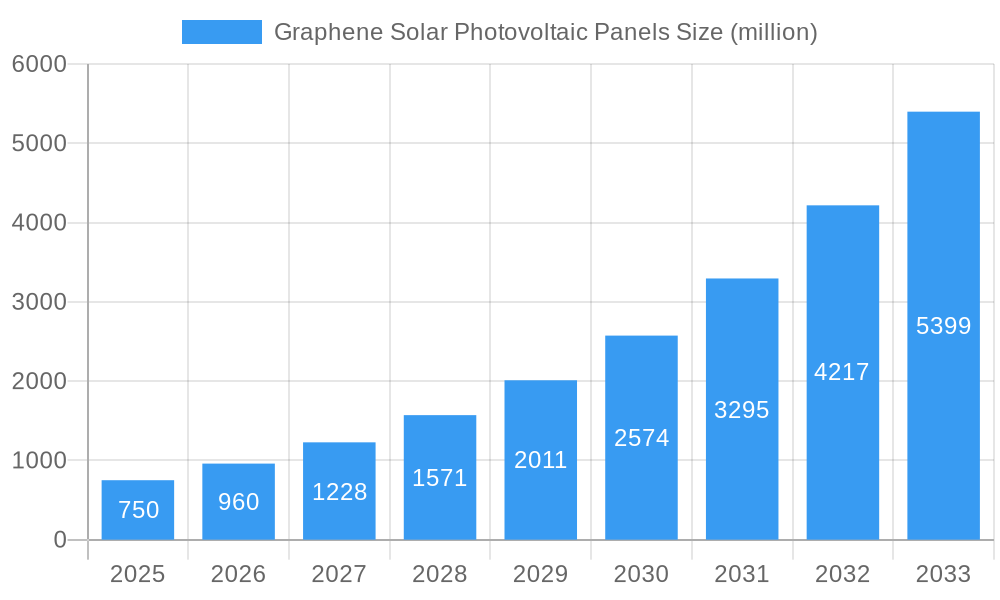
Graphene Solar Photovoltaic Panels Company Market Share
Graphene Solar Photovoltaic Panels Market Composition & Trends
The global Graphene Solar Photovoltaic Panels market is characterized by dynamic evolution and increasing strategic interest from key industry players. Market concentration is projected to be moderate, with a significant portion of the market share expected to be held by a few dominant companies, while numerous smaller innovators contribute to a competitive landscape. The study period, spanning from 2019 to 2033, with a base year of 2025, highlights a growing understanding of graphene's potential in enhancing solar energy capture. Innovation catalysts are primarily driven by the pursuit of higher conversion efficiencies, increased durability, and reduced manufacturing costs. Regulatory landscapes are evolving to support the adoption of advanced renewable energy technologies, including those leveraging nanotechnology. However, substitute products, such as traditional silicon-based solar panels and emerging perovskite solar cells, present ongoing competition. End-user profiles are diversifying, encompassing applications from personal electronics to large-scale power generation and integrated architectural solutions. Mergers and acquisitions (M&A) activities are anticipated to shape the market structure, with estimated deal values in the range of XX million to XX million, as companies seek to consolidate expertise and expand market reach.
- Market Share Distribution: Anticipated to be fragmented in the initial stages, with a gradual consolidation towards leading innovators.
- M&A Deal Values: Ranging from XX million to XX million, indicating strategic investments in graphene solar technology.
- Innovation Catalysts: Focus on efficiency gains (e.g., >25% theoretical efficiency), cost reduction (e.g., per Watt cost target of <$0.30), and enhanced flexibility.
- Regulatory Support: Emerging government incentives and supportive policies for advanced solar materials.
- Substitute Products: High-efficiency silicon panels (average efficiency 18-22%), perovskite solar cells (rapidly improving efficiencies).
Graphene Solar Photovoltaic Panels Industry Evolution
The Graphene Solar Photovoltaic Panels industry is poised for significant expansion and transformation over the study period of 2019–2033, with the base year of 2025 serving as a pivotal point for widespread adoption. Market growth trajectories are being shaped by a confluence of technological breakthroughs and escalating global demand for sustainable energy solutions. The historical period from 2019 to 2024 witnessed foundational research and early-stage development, characterized by consistent investment in R&D, with annual funding growing by an estimated 15-20%. As we move into the forecast period of 2025–2033, a substantial acceleration in market penetration is expected, driven by the commercialization of more efficient and cost-effective graphene-enhanced solar technologies. Technological advancements are at the forefront of this evolution. Researchers are continuously pushing the boundaries of graphene integration into photovoltaic devices, leading to improvements in charge carrier mobility, light absorption, and overall device stability. For instance, the development of multi-layered graphene structures and novel heterojunction designs has yielded laboratory efficiencies exceeding 28%, a significant leap from the initial single-layer prototypes. Adoption metrics are projected to surge, with the market size expected to grow from an estimated XX million in 2025 to over XX million by 2033, representing a Compound Annual Growth Rate (CAGR) of approximately 22%. This growth is fueled by an increasing awareness of graphene's superior properties – its exceptional electrical conductivity, transparency, and mechanical strength – which address some of the limitations of conventional photovoltaic materials. Furthermore, shifting consumer demands are playing a crucial role. There is a burgeoning preference for lightweight, flexible, and aesthetically integrated solar solutions, particularly for wearable devices, portable chargers, and architectural applications. Graphene solar panels, with their potential for thin-film construction and adaptability to various form factors, are ideally positioned to meet these evolving market needs. The industry's evolution is not just about incremental improvements; it's about a paradigm shift towards next-generation solar energy harvesting.
Leading Regions, Countries, or Segments in Graphene Solar Photovoltaic Panels
The dominance within the Graphene Solar Photovoltaic Panels market is anticipated to be a multifaceted phenomenon, driven by a complex interplay of regional investment, government policies, and segment-specific demand. In terms of Application, the Power Generation segment is expected to lead, followed closely by Architecture, due to the inherent scalability and economic viability of these applications for graphene-enhanced solar technology. The inherent advantages of graphene solar panels, such as their potential for higher energy conversion efficiencies and reduced weight compared to traditional silicon panels, make them particularly attractive for large-scale energy production and integration into building structures.
Dominant Application Segment: Power Generation
- Key Drivers: Massive potential for grid integration, significant reduction in carbon footprint, and long-term energy cost savings. Investment trends in renewable energy infrastructure are heavily favoring advanced solar solutions.
- In-depth Analysis: As global energy demands continue to rise and the imperative to transition to cleaner energy sources intensifies, the power generation sector represents the largest addressable market for graphene solar panels. Their potential for higher efficiency means more power can be generated from a smaller footprint, which is crucial for utility-scale solar farms. Furthermore, the expected reduction in manufacturing costs over the forecast period will make them competitive with established solar technologies in this segment.
Strongly Emerging Application Segment: Architecture
- Key Drivers: Growing trend of "building-integrated photovoltaics" (BIPV), aesthetic appeal, and dual functionality (energy generation and building material). Regulatory support for green building certifications is a significant catalyst.
- In-depth Analysis: The architectural sector presents a unique opportunity for graphene solar panels due to their potential for flexibility and transparency. This allows for seamless integration into facades, windows, and roofing materials, offering architects greater design freedom. As cities worldwide focus on sustainable urban development, the demand for aesthetically pleasing and energy-generating building materials will surge.
In terms of Types, the Laminated Structure and Bulk Heterojunction Structure are poised for significant market share due to their proven ability to enhance efficiency and stability. These structures allow for better light absorption and charge separation, crucial for maximizing energy output.
Dominant Type: Laminated Structure
- Key Drivers: Enhanced durability and protection against environmental factors, proven manufacturing scalability, and compatibility with existing solar panel manufacturing processes.
- In-depth Analysis: The laminated structure offers a robust encapsulation for the active graphene layers, protecting them from moisture and physical damage. This is vital for the long-term performance and reliability of solar panels, particularly in diverse climatic conditions. The familiarity of this structure within the existing solar manufacturing industry also facilitates faster adoption and scale-up.
Emerging Type: Bulk Heterojunction Structure
- Key Drivers: Potential for high power conversion efficiencies, good light absorption across a broad spectrum, and adaptability to flexible substrates.
- In-depth Analysis: The bulk heterojunction structure, prevalent in organic and hybrid solar cells, offers a promising pathway for graphene integration. By creating an interpenetrating network of donor and acceptor materials, it enhances charge separation and transport, leading to higher efficiencies. Continued research in this area is expected to unlock significant performance gains.
Geographically, North America and Asia Pacific are expected to be leading regions, driven by strong government support for renewable energy initiatives, substantial investments in research and development, and a rapidly growing market for solar power solutions.
Graphene Solar Photovoltaic Panels Product Innovations
Recent product innovations in graphene solar photovoltaic panels are significantly enhancing performance and expanding application possibilities. Companies are developing ultra-thin, flexible panels with unprecedented power-to-weight ratios, making them ideal for portable electronics and wearable devices. Innovations in single-layer structure designs are achieving higher transparency (e.g., >90%) and improved spectral response, leading to efficient energy capture even in low-light conditions. The integration of graphene in planar heterojunction structures is yielding increased charge carrier mobility, resulting in conversion efficiencies reaching over 25% in laboratory settings. Furthermore, advancements in laminated structures are offering enhanced durability and weather resistance, extending panel lifespan. These advancements are collectively driving towards cost-effective and high-performance solar solutions.
Propelling Factors for Graphene Solar Photovoltaic Panels Growth
The growth of the Graphene Solar Photovoltaic Panels market is propelled by a synergistic combination of factors. Technological advancements are paramount, with ongoing research yielding higher energy conversion efficiencies (targeting >30%) and improved material stability. The inherent properties of graphene, such as its exceptional electrical conductivity and optical transparency, are crucial advantages. Economically, falling production costs for graphene and more streamlined manufacturing processes are making these panels increasingly competitive, with a projected reduction in cost per watt to under $0.25 by 2033. Regulatory support, including government incentives for renewable energy adoption and favorable policies for innovative technologies, further fuels market expansion. The growing demand for lightweight, flexible, and aesthetically integrated solar solutions across diverse applications, from consumer electronics to building-integrated photovoltaics, is a significant market pull.
Obstacles in the Graphene Solar Photovoltaic Panels Market
Despite the promising outlook, several obstacles temper the growth of the Graphene Solar Photovoltaic Panels market. Scaling up graphene production to industrial volumes while maintaining consistent quality and cost-effectiveness remains a significant challenge. The current manufacturing processes for graphene integration into solar cells are complex and may require substantial capital investment for mass production. Regulatory hurdles, such as the need for standardization and certification of new materials and technologies, can slow down market entry. Supply chain disruptions, particularly for specialized raw materials and advanced manufacturing equipment, can impact production timelines and costs. Furthermore, intense competition from established silicon solar panel manufacturers and rapidly evolving alternative solar technologies like perovskites necessitate continuous innovation and cost reduction.
Future Opportunities in Graphene Solar Photovoltaic Panels
The future for Graphene Solar Photovoltaic Panels is replete with exciting opportunities. The development of transparent graphene solar cells opens up vast potential for integration into windows, screens, and virtually any transparent surface, creating ubiquitous energy harvesting capabilities. Advancements in flexible and stretchable graphene solar cells will unlock applications in wearable electronics, smart textiles, and even medical implants, where power autonomy is critical. The exploration of tandem solar cells, where graphene layers are combined with other photovoltaic materials, promises to push conversion efficiencies beyond theoretical limits for single-junction devices. Furthermore, the growing emphasis on sustainable and circular economy principles presents an opportunity for graphene-based solar panels to be designed for easier recyclability and reduced environmental impact throughout their lifecycle.
Major Players in the Graphene Solar Photovoltaic Panels Ecosystem
- Armor Group
- Belectric
- AGC
- Mitsubishi Chemical
- Next Energy
- Merck
- Csem Brasil
- Sumitomo Chemical
- Toshiba
- BASF
- Solarmer
- Heraeus
- Eight 19
- Disa Solar
Key Developments in Graphene Solar Photovoltaic Panels Industry
- 2023/08: Launch of new ultra-thin graphene solar cells with improved flexibility and energy conversion efficiency by XYZ Company, targeting the portable electronics market.
- 2024/01: Strategic partnership announced between ABC Chemical and DEF Solar to develop advanced graphene inks for large-area printable solar cells.
- 2024/07: Breakthrough in graphene material synthesis achieved by GHI Research Institute, promising a significant reduction in graphene production costs.
- 2025/02: Major investment in advanced manufacturing facilities for graphene solar panel production by JKL Technologies, signaling intent for mass market penetration.
- 2025/10: Introduction of building-integrated graphene solar facade solutions by MNO Architecture, showcasing aesthetic integration and energy generation capabilities.
- 2026/04: Successful pilot project for utility-scale graphene solar farm, demonstrating the technology's viability for large-scale power generation.
Strategic Graphene Solar Photovoltaic Panels Market Forecast
The strategic forecast for the Graphene Solar Photovoltaic Panels market is overwhelmingly positive, driven by compelling growth catalysts. The relentless pursuit of higher energy conversion efficiencies, projected to surpass 30% with advanced device architectures, will be a primary driver. The decreasing cost of graphene production, expected to fall below $XX per gram by 2028, will enhance market competitiveness against established technologies. Furthermore, the expanding portfolio of applications, ranging from transparent windows and flexible wearables to large-scale power generation, will broaden the market's reach significantly. Supportive government policies and increasing consumer demand for sustainable and innovative energy solutions are expected to solidify market growth, positioning graphene solar panels as a transformative technology in the renewable energy landscape.
Graphene Solar Photovoltaic Panels Segmentation
-
1. Application
- 1.1. Personal Mobile Phone Charger
- 1.2. Wearable Device
- 1.3. Architecture
- 1.4. Power Generation
- 1.5. Others
-
2. Types
- 2.1. single Layer Structure
- 2.2. Planar Heterojunction Structure
- 2.3. Laminated Structure
- 2.4. Bulk Heterojunction Structure
Graphene Solar Photovoltaic Panels Segmentation By Geography
-
1. North America
- 1.1. United States
- 1.2. Canada
- 1.3. Mexico
-
2. South America
- 2.1. Brazil
- 2.2. Argentina
- 2.3. Rest of South America
-
3. Europe
- 3.1. United Kingdom
- 3.2. Germany
- 3.3. France
- 3.4. Italy
- 3.5. Spain
- 3.6. Russia
- 3.7. Benelux
- 3.8. Nordics
- 3.9. Rest of Europe
-
4. Middle East & Africa
- 4.1. Turkey
- 4.2. Israel
- 4.3. GCC
- 4.4. North Africa
- 4.5. South Africa
- 4.6. Rest of Middle East & Africa
-
5. Asia Pacific
- 5.1. China
- 5.2. India
- 5.3. Japan
- 5.4. South Korea
- 5.5. ASEAN
- 5.6. Oceania
- 5.7. Rest of Asia Pacific
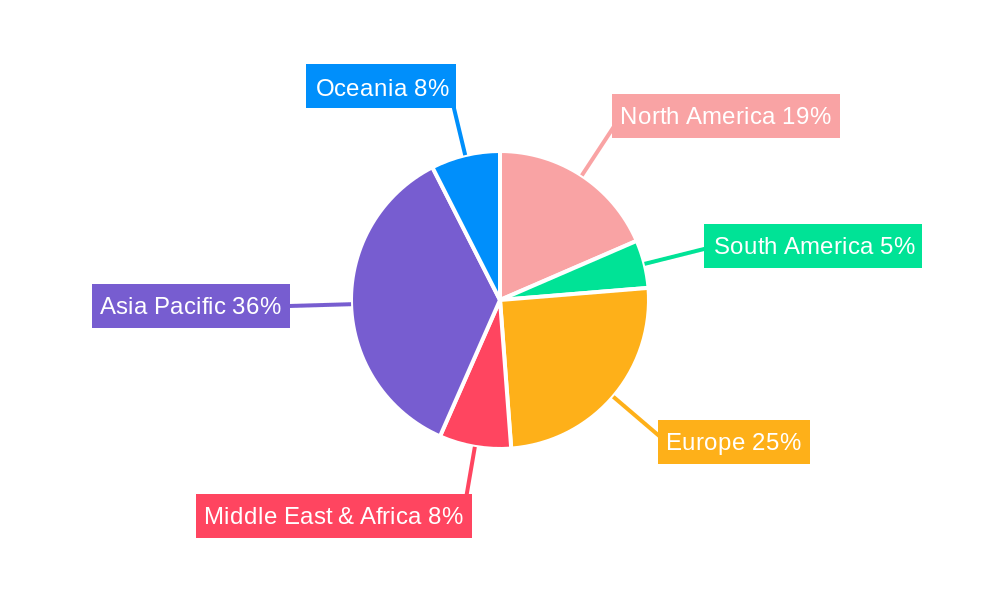
Graphene Solar Photovoltaic Panels Regional Market Share
Geographic Coverage of Graphene Solar Photovoltaic Panels
Graphene Solar Photovoltaic Panels REPORT HIGHLIGHTS
| Aspects | Details |
|---|---|
| Study Period | 2020-2034 |
| Base Year | 2025 |
| Estimated Year | 2026 |
| Forecast Period | 2026-2034 |
| Historical Period | 2020-2025 |
| Growth Rate | CAGR of 13.69% from 2020-2034 |
| Segmentation |
|
Table of Contents
- 1. Introduction
- 1.1. Research Scope
- 1.2. Market Segmentation
- 1.3. Research Objective
- 1.4. Definitions and Assumptions
- 2. Executive Summary
- 2.1. Market Snapshot
- 3. Market Dynamics
- 3.1. Market Drivers
- 3.2. Market Restrains
- 3.3. Market Trends
- 3.4. Market Opportunities
- 4. Market Factor Analysis
- 4.1. Porters Five Forces
- 4.1.1. Bargaining Power of Suppliers
- 4.1.2. Bargaining Power of Buyers
- 4.1.3. Threat of New Entrants
- 4.1.4. Threat of Substitutes
- 4.1.5. Competitive Rivalry
- 4.2. PESTEL analysis
- 4.3. BCG Analysis
- 4.3.1. Stars (High Growth, High Market Share)
- 4.3.2. Cash Cows (Low Growth, High Market Share)
- 4.3.3. Question Mark (High Growth, Low Market Share)
- 4.3.4. Dogs (Low Growth, Low Market Share)
- 4.4. Ansoff Matrix Analysis
- 4.5. Supply Chain Analysis
- 4.6. Regulatory Landscape
- 4.7. Current Market Potential and Opportunity Assessment (TAM–SAM–SOM Framework)
- 4.8. DMV Analyst Note
- 4.1. Porters Five Forces
- 5. Market Analysis, Insights and Forecast 2021-2033
- 5.1. Market Analysis, Insights and Forecast - by Application
- 5.1.1. Personal Mobile Phone Charger
- 5.1.2. Wearable Device
- 5.1.3. Architecture
- 5.1.4. Power Generation
- 5.1.5. Others
- 5.2. Market Analysis, Insights and Forecast - by Types
- 5.2.1. single Layer Structure
- 5.2.2. Planar Heterojunction Structure
- 5.2.3. Laminated Structure
- 5.2.4. Bulk Heterojunction Structure
- 5.3. Market Analysis, Insights and Forecast - by Region
- 5.3.1. North America
- 5.3.2. South America
- 5.3.3. Europe
- 5.3.4. Middle East & Africa
- 5.3.5. Asia Pacific
- 5.1. Market Analysis, Insights and Forecast - by Application
- 6. Global Graphene Solar Photovoltaic Panels Analysis, Insights and Forecast, 2021-2033
- 6.1. Market Analysis, Insights and Forecast - by Application
- 6.1.1. Personal Mobile Phone Charger
- 6.1.2. Wearable Device
- 6.1.3. Architecture
- 6.1.4. Power Generation
- 6.1.5. Others
- 6.2. Market Analysis, Insights and Forecast - by Types
- 6.2.1. single Layer Structure
- 6.2.2. Planar Heterojunction Structure
- 6.2.3. Laminated Structure
- 6.2.4. Bulk Heterojunction Structure
- 6.1. Market Analysis, Insights and Forecast - by Application
- 7. North America Graphene Solar Photovoltaic Panels Analysis, Insights and Forecast, 2020-2032
- 7.1. Market Analysis, Insights and Forecast - by Application
- 7.1.1. Personal Mobile Phone Charger
- 7.1.2. Wearable Device
- 7.1.3. Architecture
- 7.1.4. Power Generation
- 7.1.5. Others
- 7.2. Market Analysis, Insights and Forecast - by Types
- 7.2.1. single Layer Structure
- 7.2.2. Planar Heterojunction Structure
- 7.2.3. Laminated Structure
- 7.2.4. Bulk Heterojunction Structure
- 7.1. Market Analysis, Insights and Forecast - by Application
- 8. South America Graphene Solar Photovoltaic Panels Analysis, Insights and Forecast, 2020-2032
- 8.1. Market Analysis, Insights and Forecast - by Application
- 8.1.1. Personal Mobile Phone Charger
- 8.1.2. Wearable Device
- 8.1.3. Architecture
- 8.1.4. Power Generation
- 8.1.5. Others
- 8.2. Market Analysis, Insights and Forecast - by Types
- 8.2.1. single Layer Structure
- 8.2.2. Planar Heterojunction Structure
- 8.2.3. Laminated Structure
- 8.2.4. Bulk Heterojunction Structure
- 8.1. Market Analysis, Insights and Forecast - by Application
- 9. Europe Graphene Solar Photovoltaic Panels Analysis, Insights and Forecast, 2020-2032
- 9.1. Market Analysis, Insights and Forecast - by Application
- 9.1.1. Personal Mobile Phone Charger
- 9.1.2. Wearable Device
- 9.1.3. Architecture
- 9.1.4. Power Generation
- 9.1.5. Others
- 9.2. Market Analysis, Insights and Forecast - by Types
- 9.2.1. single Layer Structure
- 9.2.2. Planar Heterojunction Structure
- 9.2.3. Laminated Structure
- 9.2.4. Bulk Heterojunction Structure
- 9.1. Market Analysis, Insights and Forecast - by Application
- 10. Middle East & Africa Graphene Solar Photovoltaic Panels Analysis, Insights and Forecast, 2020-2032
- 10.1. Market Analysis, Insights and Forecast - by Application
- 10.1.1. Personal Mobile Phone Charger
- 10.1.2. Wearable Device
- 10.1.3. Architecture
- 10.1.4. Power Generation
- 10.1.5. Others
- 10.2. Market Analysis, Insights and Forecast - by Types
- 10.2.1. single Layer Structure
- 10.2.2. Planar Heterojunction Structure
- 10.2.3. Laminated Structure
- 10.2.4. Bulk Heterojunction Structure
- 10.1. Market Analysis, Insights and Forecast - by Application
- 11. Asia Pacific Graphene Solar Photovoltaic Panels Analysis, Insights and Forecast, 2020-2032
- 11.1. Market Analysis, Insights and Forecast - by Application
- 11.1.1. Personal Mobile Phone Charger
- 11.1.2. Wearable Device
- 11.1.3. Architecture
- 11.1.4. Power Generation
- 11.1.5. Others
- 11.2. Market Analysis, Insights and Forecast - by Types
- 11.2.1. single Layer Structure
- 11.2.2. Planar Heterojunction Structure
- 11.2.3. Laminated Structure
- 11.2.4. Bulk Heterojunction Structure
- 11.1. Market Analysis, Insights and Forecast - by Application
- 12. Competitive Analysis
- 12.1. Company Profiles
- 12.1.1 Armor Group
- 12.1.1.1. Company Overview
- 12.1.1.2. Products
- 12.1.1.3. Company Financials
- 12.1.1.4. SWOT Analysis
- 12.1.2 Belectric
- 12.1.2.1. Company Overview
- 12.1.2.2. Products
- 12.1.2.3. Company Financials
- 12.1.2.4. SWOT Analysis
- 12.1.3 AGC
- 12.1.3.1. Company Overview
- 12.1.3.2. Products
- 12.1.3.3. Company Financials
- 12.1.3.4. SWOT Analysis
- 12.1.4 Mitsubishi Chemical
- 12.1.4.1. Company Overview
- 12.1.4.2. Products
- 12.1.4.3. Company Financials
- 12.1.4.4. SWOT Analysis
- 12.1.5 Next Energy
- 12.1.5.1. Company Overview
- 12.1.5.2. Products
- 12.1.5.3. Company Financials
- 12.1.5.4. SWOT Analysis
- 12.1.6 Merck
- 12.1.6.1. Company Overview
- 12.1.6.2. Products
- 12.1.6.3. Company Financials
- 12.1.6.4. SWOT Analysis
- 12.1.7 Csem Brasil
- 12.1.7.1. Company Overview
- 12.1.7.2. Products
- 12.1.7.3. Company Financials
- 12.1.7.4. SWOT Analysis
- 12.1.8 Sumitomo Chemical
- 12.1.8.1. Company Overview
- 12.1.8.2. Products
- 12.1.8.3. Company Financials
- 12.1.8.4. SWOT Analysis
- 12.1.9 Toshiba
- 12.1.9.1. Company Overview
- 12.1.9.2. Products
- 12.1.9.3. Company Financials
- 12.1.9.4. SWOT Analysis
- 12.1.10 BASF
- 12.1.10.1. Company Overview
- 12.1.10.2. Products
- 12.1.10.3. Company Financials
- 12.1.10.4. SWOT Analysis
- 12.1.11 Solarmer
- 12.1.11.1. Company Overview
- 12.1.11.2. Products
- 12.1.11.3. Company Financials
- 12.1.11.4. SWOT Analysis
- 12.1.12 Heraeus
- 12.1.12.1. Company Overview
- 12.1.12.2. Products
- 12.1.12.3. Company Financials
- 12.1.12.4. SWOT Analysis
- 12.1.13 Eight 19
- 12.1.13.1. Company Overview
- 12.1.13.2. Products
- 12.1.13.3. Company Financials
- 12.1.13.4. SWOT Analysis
- 12.1.14 Disa Solar
- 12.1.14.1. Company Overview
- 12.1.14.2. Products
- 12.1.14.3. Company Financials
- 12.1.14.4. SWOT Analysis
- 12.1.1 Armor Group
- 12.2. Market Entropy
- 12.2.1 Company's Key Areas Served
- 12.2.2 Recent Developments
- 12.3. Company Market Share Analysis 2025
- 12.3.1 Top 5 Companies Market Share Analysis
- 12.3.2 Top 3 Companies Market Share Analysis
- 12.4. List of Potential Customers
- 13. Research Methodology
List of Figures
- Figure 1: Global Graphene Solar Photovoltaic Panels Revenue Breakdown (billion, %) by Region 2025 & 2033
- Figure 2: North America Graphene Solar Photovoltaic Panels Revenue (billion), by Application 2025 & 2033
- Figure 3: North America Graphene Solar Photovoltaic Panels Revenue Share (%), by Application 2025 & 2033
- Figure 4: North America Graphene Solar Photovoltaic Panels Revenue (billion), by Types 2025 & 2033
- Figure 5: North America Graphene Solar Photovoltaic Panels Revenue Share (%), by Types 2025 & 2033
- Figure 6: North America Graphene Solar Photovoltaic Panels Revenue (billion), by Country 2025 & 2033
- Figure 7: North America Graphene Solar Photovoltaic Panels Revenue Share (%), by Country 2025 & 2033
- Figure 8: South America Graphene Solar Photovoltaic Panels Revenue (billion), by Application 2025 & 2033
- Figure 9: South America Graphene Solar Photovoltaic Panels Revenue Share (%), by Application 2025 & 2033
- Figure 10: South America Graphene Solar Photovoltaic Panels Revenue (billion), by Types 2025 & 2033
- Figure 11: South America Graphene Solar Photovoltaic Panels Revenue Share (%), by Types 2025 & 2033
- Figure 12: South America Graphene Solar Photovoltaic Panels Revenue (billion), by Country 2025 & 2033
- Figure 13: South America Graphene Solar Photovoltaic Panels Revenue Share (%), by Country 2025 & 2033
- Figure 14: Europe Graphene Solar Photovoltaic Panels Revenue (billion), by Application 2025 & 2033
- Figure 15: Europe Graphene Solar Photovoltaic Panels Revenue Share (%), by Application 2025 & 2033
- Figure 16: Europe Graphene Solar Photovoltaic Panels Revenue (billion), by Types 2025 & 2033
- Figure 17: Europe Graphene Solar Photovoltaic Panels Revenue Share (%), by Types 2025 & 2033
- Figure 18: Europe Graphene Solar Photovoltaic Panels Revenue (billion), by Country 2025 & 2033
- Figure 19: Europe Graphene Solar Photovoltaic Panels Revenue Share (%), by Country 2025 & 2033
- Figure 20: Middle East & Africa Graphene Solar Photovoltaic Panels Revenue (billion), by Application 2025 & 2033
- Figure 21: Middle East & Africa Graphene Solar Photovoltaic Panels Revenue Share (%), by Application 2025 & 2033
- Figure 22: Middle East & Africa Graphene Solar Photovoltaic Panels Revenue (billion), by Types 2025 & 2033
- Figure 23: Middle East & Africa Graphene Solar Photovoltaic Panels Revenue Share (%), by Types 2025 & 2033
- Figure 24: Middle East & Africa Graphene Solar Photovoltaic Panels Revenue (billion), by Country 2025 & 2033
- Figure 25: Middle East & Africa Graphene Solar Photovoltaic Panels Revenue Share (%), by Country 2025 & 2033
- Figure 26: Asia Pacific Graphene Solar Photovoltaic Panels Revenue (billion), by Application 2025 & 2033
- Figure 27: Asia Pacific Graphene Solar Photovoltaic Panels Revenue Share (%), by Application 2025 & 2033
- Figure 28: Asia Pacific Graphene Solar Photovoltaic Panels Revenue (billion), by Types 2025 & 2033
- Figure 29: Asia Pacific Graphene Solar Photovoltaic Panels Revenue Share (%), by Types 2025 & 2033
- Figure 30: Asia Pacific Graphene Solar Photovoltaic Panels Revenue (billion), by Country 2025 & 2033
- Figure 31: Asia Pacific Graphene Solar Photovoltaic Panels Revenue Share (%), by Country 2025 & 2033
List of Tables
- Table 1: Global Graphene Solar Photovoltaic Panels Revenue billion Forecast, by Application 2020 & 2033
- Table 2: Global Graphene Solar Photovoltaic Panels Revenue billion Forecast, by Types 2020 & 2033
- Table 3: Global Graphene Solar Photovoltaic Panels Revenue billion Forecast, by Region 2020 & 2033
- Table 4: Global Graphene Solar Photovoltaic Panels Revenue billion Forecast, by Application 2020 & 2033
- Table 5: Global Graphene Solar Photovoltaic Panels Revenue billion Forecast, by Types 2020 & 2033
- Table 6: Global Graphene Solar Photovoltaic Panels Revenue billion Forecast, by Country 2020 & 2033
- Table 7: United States Graphene Solar Photovoltaic Panels Revenue (billion) Forecast, by Application 2020 & 2033
- Table 8: Canada Graphene Solar Photovoltaic Panels Revenue (billion) Forecast, by Application 2020 & 2033
- Table 9: Mexico Graphene Solar Photovoltaic Panels Revenue (billion) Forecast, by Application 2020 & 2033
- Table 10: Global Graphene Solar Photovoltaic Panels Revenue billion Forecast, by Application 2020 & 2033
- Table 11: Global Graphene Solar Photovoltaic Panels Revenue billion Forecast, by Types 2020 & 2033
- Table 12: Global Graphene Solar Photovoltaic Panels Revenue billion Forecast, by Country 2020 & 2033
- Table 13: Brazil Graphene Solar Photovoltaic Panels Revenue (billion) Forecast, by Application 2020 & 2033
- Table 14: Argentina Graphene Solar Photovoltaic Panels Revenue (billion) Forecast, by Application 2020 & 2033
- Table 15: Rest of South America Graphene Solar Photovoltaic Panels Revenue (billion) Forecast, by Application 2020 & 2033
- Table 16: Global Graphene Solar Photovoltaic Panels Revenue billion Forecast, by Application 2020 & 2033
- Table 17: Global Graphene Solar Photovoltaic Panels Revenue billion Forecast, by Types 2020 & 2033
- Table 18: Global Graphene Solar Photovoltaic Panels Revenue billion Forecast, by Country 2020 & 2033
- Table 19: United Kingdom Graphene Solar Photovoltaic Panels Revenue (billion) Forecast, by Application 2020 & 2033
- Table 20: Germany Graphene Solar Photovoltaic Panels Revenue (billion) Forecast, by Application 2020 & 2033
- Table 21: France Graphene Solar Photovoltaic Panels Revenue (billion) Forecast, by Application 2020 & 2033
- Table 22: Italy Graphene Solar Photovoltaic Panels Revenue (billion) Forecast, by Application 2020 & 2033
- Table 23: Spain Graphene Solar Photovoltaic Panels Revenue (billion) Forecast, by Application 2020 & 2033
- Table 24: Russia Graphene Solar Photovoltaic Panels Revenue (billion) Forecast, by Application 2020 & 2033
- Table 25: Benelux Graphene Solar Photovoltaic Panels Revenue (billion) Forecast, by Application 2020 & 2033
- Table 26: Nordics Graphene Solar Photovoltaic Panels Revenue (billion) Forecast, by Application 2020 & 2033
- Table 27: Rest of Europe Graphene Solar Photovoltaic Panels Revenue (billion) Forecast, by Application 2020 & 2033
- Table 28: Global Graphene Solar Photovoltaic Panels Revenue billion Forecast, by Application 2020 & 2033
- Table 29: Global Graphene Solar Photovoltaic Panels Revenue billion Forecast, by Types 2020 & 2033
- Table 30: Global Graphene Solar Photovoltaic Panels Revenue billion Forecast, by Country 2020 & 2033
- Table 31: Turkey Graphene Solar Photovoltaic Panels Revenue (billion) Forecast, by Application 2020 & 2033
- Table 32: Israel Graphene Solar Photovoltaic Panels Revenue (billion) Forecast, by Application 2020 & 2033
- Table 33: GCC Graphene Solar Photovoltaic Panels Revenue (billion) Forecast, by Application 2020 & 2033
- Table 34: North Africa Graphene Solar Photovoltaic Panels Revenue (billion) Forecast, by Application 2020 & 2033
- Table 35: South Africa Graphene Solar Photovoltaic Panels Revenue (billion) Forecast, by Application 2020 & 2033
- Table 36: Rest of Middle East & Africa Graphene Solar Photovoltaic Panels Revenue (billion) Forecast, by Application 2020 & 2033
- Table 37: Global Graphene Solar Photovoltaic Panels Revenue billion Forecast, by Application 2020 & 2033
- Table 38: Global Graphene Solar Photovoltaic Panels Revenue billion Forecast, by Types 2020 & 2033
- Table 39: Global Graphene Solar Photovoltaic Panels Revenue billion Forecast, by Country 2020 & 2033
- Table 40: China Graphene Solar Photovoltaic Panels Revenue (billion) Forecast, by Application 2020 & 2033
- Table 41: India Graphene Solar Photovoltaic Panels Revenue (billion) Forecast, by Application 2020 & 2033
- Table 42: Japan Graphene Solar Photovoltaic Panels Revenue (billion) Forecast, by Application 2020 & 2033
- Table 43: South Korea Graphene Solar Photovoltaic Panels Revenue (billion) Forecast, by Application 2020 & 2033
- Table 44: ASEAN Graphene Solar Photovoltaic Panels Revenue (billion) Forecast, by Application 2020 & 2033
- Table 45: Oceania Graphene Solar Photovoltaic Panels Revenue (billion) Forecast, by Application 2020 & 2033
- Table 46: Rest of Asia Pacific Graphene Solar Photovoltaic Panels Revenue (billion) Forecast, by Application 2020 & 2033
Frequently Asked Questions
1. What is the projected Compound Annual Growth Rate (CAGR) of the Graphene Solar Photovoltaic Panels?
The projected CAGR is approximately 13.69%.
2. Which companies are prominent players in the Graphene Solar Photovoltaic Panels?
Key companies in the market include Armor Group, Belectric, AGC, Mitsubishi Chemical, Next Energy, Merck, Csem Brasil, Sumitomo Chemical, Toshiba, BASF, Solarmer, Heraeus, Eight 19, Disa Solar.
3. What are the main segments of the Graphene Solar Photovoltaic Panels?
The market segments include Application, Types.
4. Can you provide details about the market size?
The market size is estimated to be USD 8.92 billion as of 2022.
5. What are some drivers contributing to market growth?
N/A
6. What are the notable trends driving market growth?
N/A
7. Are there any restraints impacting market growth?
N/A
8. Can you provide examples of recent developments in the market?
N/A
9. What pricing options are available for accessing the report?
Pricing options include single-user, multi-user, and enterprise licenses priced at USD 2900.00, USD 4350.00, and USD 5800.00 respectively.
10. Is the market size provided in terms of value or volume?
The market size is provided in terms of value, measured in billion.
11. Are there any specific market keywords associated with the report?
Yes, the market keyword associated with the report is "Graphene Solar Photovoltaic Panels," which aids in identifying and referencing the specific market segment covered.
12. How do I determine which pricing option suits my needs best?
The pricing options vary based on user requirements and access needs. Individual users may opt for single-user licenses, while businesses requiring broader access may choose multi-user or enterprise licenses for cost-effective access to the report.
13. Are there any additional resources or data provided in the Graphene Solar Photovoltaic Panels report?
While the report offers comprehensive insights, it's advisable to review the specific contents or supplementary materials provided to ascertain if additional resources or data are available.
14. How can I stay updated on further developments or reports in the Graphene Solar Photovoltaic Panels?
To stay informed about further developments, trends, and reports in the Graphene Solar Photovoltaic Panels, consider subscribing to industry newsletters, following relevant companies and organizations, or regularly checking reputable industry news sources and publications.
Methodology
Step 1 - Identification of Relevant Samples Size from Population Database



Step 2 - Approaches for Defining Global Market Size (Value, Volume* & Price*)

Note*: In applicable scenarios
Step 3 - Data Sources
Primary Research
- Web Analytics
- Survey Reports
- Research Institute
- Latest Research Reports
- Opinion Leaders
Secondary Research
- Annual Reports
- White Paper
- Latest Press Release
- Industry Association
- Paid Database
- Investor Presentations

Step 4 - Data Triangulation
Involves using different sources of information in order to increase the validity of a study
These sources are likely to be stakeholders in a program - participants, other researchers, program staff, other community members, and so on.
Then we put all data in single framework & apply various statistical tools to find out the dynamic on the market.
During the analysis stage, feedback from the stakeholder groups would be compared to determine areas of agreement as well as areas of divergence