

Key Insights
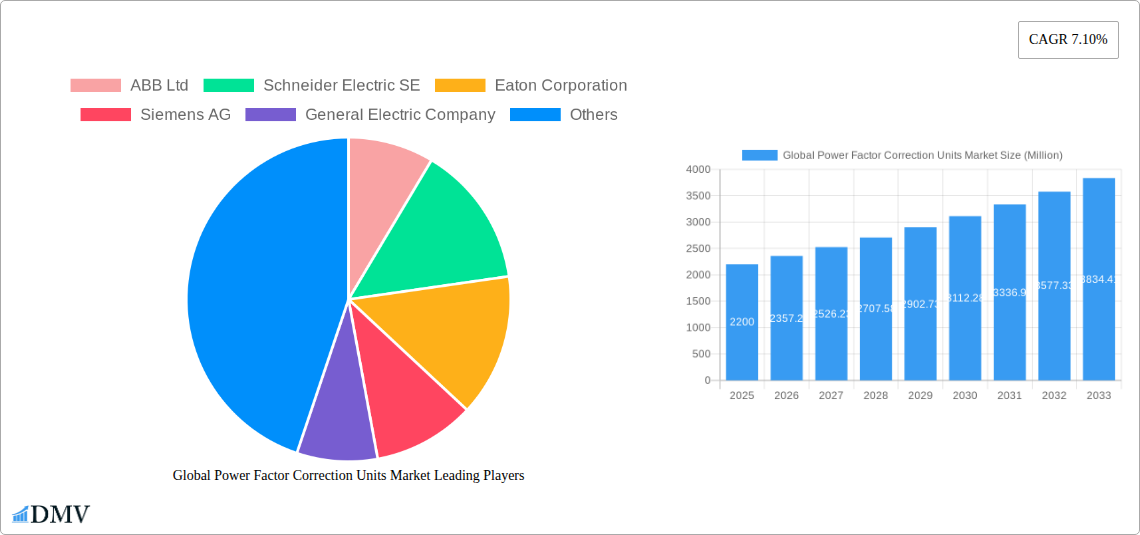
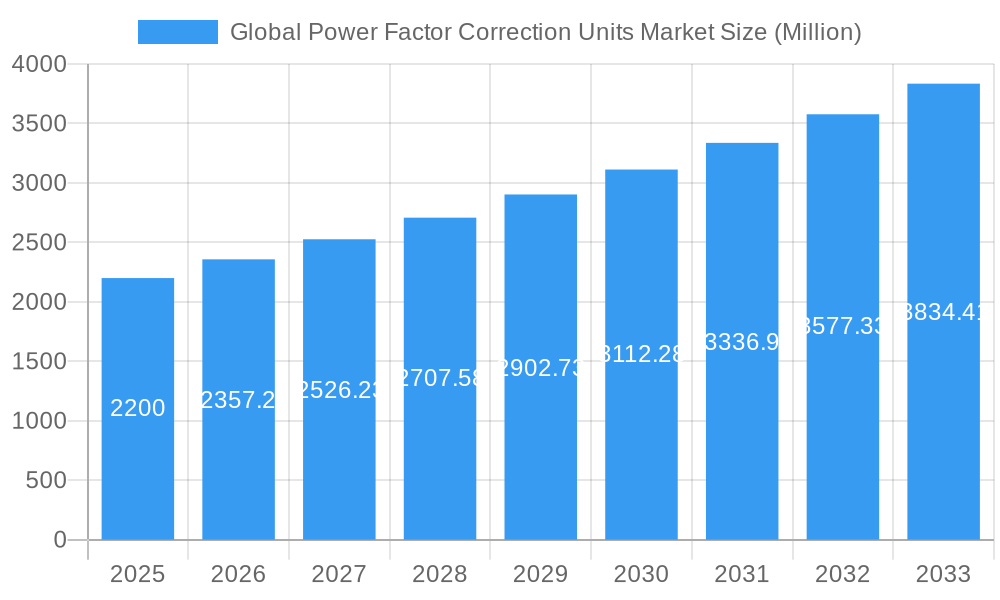
The Global Power Factor Correction (PFC) Units market is experiencing robust growth, projected to reach \$2.20 billion in 2025 and maintain a Compound Annual Growth Rate (CAGR) of 7.10% from 2025 to 2033. This expansion is driven primarily by increasing industrial automation, stringent government regulations mandating improved power efficiency, and a growing emphasis on energy conservation across various sectors. The rising adoption of renewable energy sources, which often exhibit fluctuating power factors, further fuels demand for PFC units to ensure stable grid operation. Key market trends include the increasing integration of smart technologies and advanced control systems within PFC units for improved efficiency and remote monitoring capabilities. The shift towards more compact and energy-efficient designs is also a significant factor, catering to the needs of space-constrained applications. While high initial investment costs can act as a restraint, the long-term cost savings from reduced energy consumption and improved equipment lifespan are incentivizing wider adoption. Major players like ABB, Schneider Electric, Eaton, Siemens, and General Electric are driving innovation and market competition, offering a diverse range of PFC units tailored to specific industry needs. The market is segmented based on voltage level (low, medium, and high), application (industrial, commercial, and residential), and technology (passive and active). Geographical growth is anticipated to be substantial in developing economies experiencing rapid industrialization.
Global Power Factor Correction Units Market Market Size (In Billion)
The market’s continued growth trajectory is heavily influenced by ongoing technological advancements. The development of more sophisticated algorithms for power factor control, coupled with the miniaturization of electronic components, is leading to more efficient and cost-effective PFC units. Furthermore, the increasing integration of PFC units into broader energy management systems enhances their value proposition, allowing for optimization of overall energy consumption. The competitive landscape is characterized by both established industry giants and specialized niche players, fostering innovation and driving down costs. Future market growth will likely depend on sustained government support for energy efficiency initiatives, continued investment in renewable energy infrastructure, and the ongoing adoption of Industry 4.0 principles promoting automation and optimized energy use across industries.
Global Power Factor Correction Units Market Company Market Share
This comprehensive report provides an in-depth analysis of the Global Power Factor Correction Units Market, offering invaluable insights for stakeholders seeking to navigate this dynamic sector. The study period spans 2019-2033, with 2025 serving as the base and estimated year. The report forecasts market trends from 2025-2033, building upon historical data from 2019-2024. Expect detailed analysis of market size (in Millions), key players, and emerging trends.
Global Power Factor Correction Units Market Market Composition & Trends
This section delves into the competitive landscape of the Global Power Factor Correction Units Market, examining market concentration, innovation drivers, regulatory influences, substitute products, end-user dynamics, and merger & acquisition (M&A) activity. The market is characterized by a moderate level of concentration, with key players holding significant market share. Innovation is driven by the increasing demand for energy efficiency and stringent regulatory standards. The market faces competition from alternative technologies, but its strong value proposition in energy savings ensures continued relevance. End-user profiles are diverse, encompassing industrial, commercial, and residential sectors. M&A activity has been moderate, with deal values averaging xx Million in recent years.
- Market Share Distribution (2024): ABB Ltd (xx%), Schneider Electric SE (xx%), Eaton Corporation (xx%), Siemens AG (xx%), Others (xx%). (Note: Exact percentages are subject to the full report analysis).
- Top 3 M&A Deals (2019-2024): Deal 1 (xx Million), Deal 2 (xx Million), Deal 3 (xx Million). (Note: Specific deal details are included in the full report.)
- Key Innovation Catalysts: Stringent energy efficiency regulations, advancements in power electronics, and rising demand for renewable energy integration.
Global Power Factor Correction Units Market Industry Evolution
This section analyzes the evolution of the Global Power Factor Correction Units Market, tracing its growth trajectory, technological advancements, and evolving consumer preferences. The market has experienced steady growth over the past five years, with a Compound Annual Growth Rate (CAGR) of xx% from 2019 to 2024. This growth is attributed to factors such as increasing energy costs, stricter environmental regulations, and the growing adoption of renewable energy sources. Technological advancements, such as the development of more efficient and compact power factor correction units, have further fueled market expansion. Consumer demand is shifting towards intelligent, digitally enabled solutions that provide improved energy management and monitoring capabilities. The market is expected to maintain a healthy growth trajectory in the forecast period, driven by continued investment in infrastructure development and growing awareness of energy efficiency.
Leading Regions, Countries, or Segments in Global Power Factor Correction Units Market
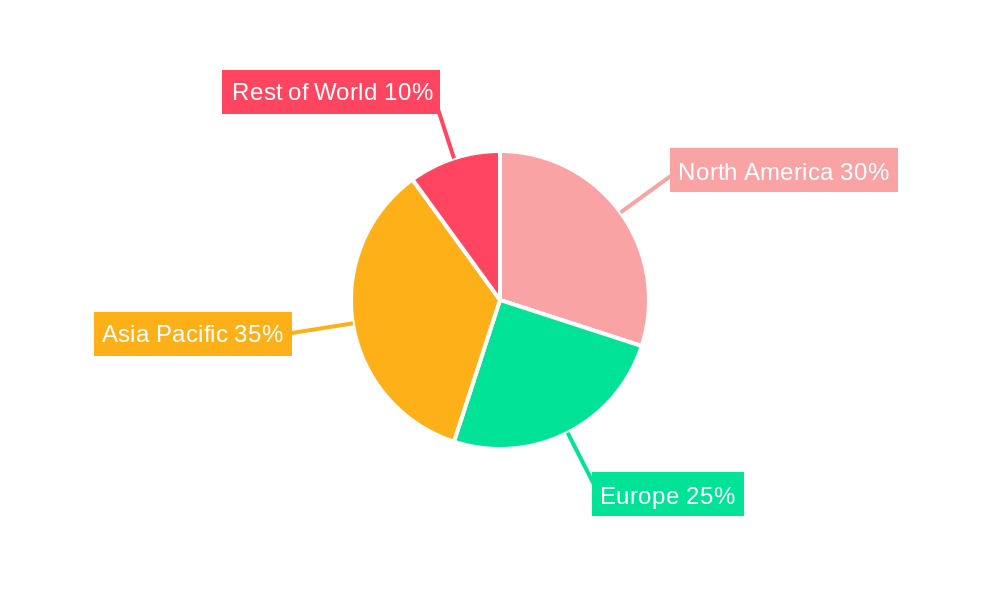
This section identifies the leading regions, countries, and market segments within the Global Power Factor Correction Units Market. North America currently holds the largest market share, driven by stringent energy efficiency regulations and a strong focus on industrial automation. Europe is another significant market, with strong government support for renewable energy integration. Asia-Pacific is expected to experience rapid growth in the forecast period, fueled by increasing industrialization and urbanization.
- Key Drivers for North American Dominance: Stringent energy regulations, high industrial automation levels, significant investments in infrastructure modernization.
- Key Drivers for European Market Growth: Robust government support for renewable energy, strong focus on energy efficiency, and a well-established industrial base.
- Key Drivers for Asia-Pacific Market Growth: Rapid industrialization, increasing urbanization, rising energy consumption, and government initiatives to improve energy efficiency.
Global Power Factor Correction Units Market Product Innovations
Recent innovations in power factor correction units include the development of more efficient and compact designs, utilizing advanced semiconductor technologies such as IGBTs and SiC MOSFETs. These advancements have resulted in improved performance metrics, including higher power density, lower energy losses, and enhanced reliability. Unique selling propositions include advanced monitoring capabilities, smart grid integration, and reduced overall system costs.
Propelling Factors for Global Power Factor Correction Units Market Growth
Growth in the Global Power Factor Correction Units Market is propelled by several factors. Stringent government regulations aimed at improving energy efficiency are a significant driver, mandating the adoption of PFC units in various applications. The increasing cost of electricity is another key factor, prompting businesses and consumers to seek ways to reduce energy consumption. Technological advancements, leading to more efficient and cost-effective PFC units, also contribute to market expansion. The rise of renewable energy sources further fuels demand as effective power quality management is crucial for integrating these sources into the grid.
Obstacles in the Global Power Factor Correction Units Market Market
The Global Power Factor Correction Units Market faces several obstacles. High upfront investment costs can deter some potential adopters, particularly smaller businesses and residential consumers. Supply chain disruptions, especially in the procurement of critical components, can impact production and availability. Intense competition among established players also presents a challenge. Furthermore, the complexity of integrating PFC units into existing electrical systems can create barriers to adoption.
Future Opportunities in Global Power Factor Correction Units Market
Future opportunities in the Global Power Factor Correction Units Market include the expansion into emerging markets with growing industrialization and urbanization. The integration of advanced technologies such as Artificial Intelligence (AI) and the Internet of Things (IoT) presents significant opportunities for the development of smart PFC solutions. The growing adoption of electric vehicles and renewable energy sources creates further demand for high-performance PFC units.
Major Players in the Global Power Factor Correction Units Market Ecosystem
- ABB Ltd
- Schneider Electric SE (Schneider Electric)
- Eaton Corporation (Eaton)
- Siemens AG (Siemens)
- General Electric Company (GE)
- Emerson Electric Co (Emerson)
- Mitsubishi Electric Corporation (Mitsubishi Electric)
- Toshiba Electronic Devices & Storage Corporation (Toshiba)
- Crompton Greaves Limited
- L&T Electrical & Automation
- List Not Exhaustive
Key Developments in Global Power Factor Correction Units Market Industry
- March 2024: FRAKO Kondensatoren-und Anlagenbau GmbH partnered with Siemens Mobility Bulgaria to develop a dynamic power factor correction system, enhancing power quality and reducing reactive power costs.
- March 2023: Toshiba Electronics Europe GmbH launched a new 650V-rated discrete IGBT for PFC circuits in various applications, improving efficiency and performance.
Strategic Global Power Factor Correction Units Market Market Forecast
The Global Power Factor Correction Units Market is poised for continued growth, driven by strong demand from key sectors and ongoing technological innovation. The market is expected to witness a significant expansion in the forecast period, fueled by increasing energy costs, stringent environmental regulations, and the growing adoption of renewable energy sources. The emergence of smart and digitally enabled PFC solutions will further propel market expansion, presenting lucrative opportunities for industry players.
Global Power Factor Correction Units Market Segmentation
-
1. Type
- 1.1. Active Power Factor Correction Unit
- 1.2. Passive Power Factor Correction Unit
- 1.3. Hybrid Power Factor Correction Unit
-
2. End Users
- 2.1. Residential
- 2.2. Commercial
- 2.3. Industrial
Global Power Factor Correction Units Market Segmentation By Geography
-
1. North America
- 1.1. United States
- 1.2. Canada
- 1.3. Rest of North America
-
2. Europe
- 2.1. Germany
- 2.2. France
- 2.3. United Kingdom
- 2.4. Italy
- 2.5. Spain
- 2.6. NORDIC
- 2.7. Russia
- 2.8. Turkey
- 2.9. Rest of Europe
-
3. Asia Pacific
- 3.1. China
- 3.2. India
- 3.3. Australia
- 3.4. Japan
- 3.5. South Korea
- 3.6. Malaysia
- 3.7. Thailand
- 3.8. Indonesia
- 3.9. Vietnam
- 3.10. Rest of Asia Pacific
-
4. Middle East and Africa
- 4.1. Saudi Arabia
- 4.2. United Arab Emirates
- 4.3. Nigeria
- 4.4. Egypt
- 4.5. Qatar
- 4.6. South Africa
- 4.7. Rest of Middle East and Africa
-
5. South America
- 5.1. Brazil
- 5.2. Argentina
- 5.3. Colombia
- 5.4. Rest of South America
Global Power Factor Correction Units Market Regional Market Share
Geographic Coverage of Global Power Factor Correction Units Market
Global Power Factor Correction Units Market REPORT HIGHLIGHTS
| Aspects | Details |
|---|---|
| Study Period | 2020-2034 |
| Base Year | 2025 |
| Estimated Year | 2026 |
| Forecast Period | 2026-2034 |
| Historical Period | 2020-2025 |
| Growth Rate | CAGR of 7.10% from 2020-2034 |
| Segmentation |
|
Table of Contents
- 1. Introduction
- 1.1. Research Scope
- 1.2. Market Segmentation
- 1.3. Research Objective
- 1.4. Definitions and Assumptions
- 2. Executive Summary
- 2.1. Market Snapshot
- 3. Market Dynamics
- 3.1. Market Drivers
- 3.2. Market Restrains
- 3.3. Market Trends
- 3.4. Market Opportunities
- 4. Market Factor Analysis
- 4.1. Porters Five Forces
- 4.1.1. Bargaining Power of Suppliers
- 4.1.2. Bargaining Power of Buyers
- 4.1.3. Threat of New Entrants
- 4.1.4. Threat of Substitutes
- 4.1.5. Competitive Rivalry
- 4.2. PESTEL analysis
- 4.3. BCG Analysis
- 4.3.1. Stars (High Growth, High Market Share)
- 4.3.2. Cash Cows (Low Growth, High Market Share)
- 4.3.3. Question Mark (High Growth, Low Market Share)
- 4.3.4. Dogs (Low Growth, Low Market Share)
- 4.4. Ansoff Matrix Analysis
- 4.5. Supply Chain Analysis
- 4.6. Regulatory Landscape
- 4.7. Current Market Potential and Opportunity Assessment (TAM–SAM–SOM Framework)
- 4.8. DMV Analyst Note
- 4.1. Porters Five Forces
- 5. Market Analysis, Insights and Forecast 2021-2033
- 5.1. Market Analysis, Insights and Forecast - by Type
- 5.1.1. Active Power Factor Correction Unit
- 5.1.2. Passive Power Factor Correction Unit
- 5.1.3. Hybrid Power Factor Correction Unit
- 5.2. Market Analysis, Insights and Forecast - by End Users
- 5.2.1. Residential
- 5.2.2. Commercial
- 5.2.3. Industrial
- 5.3. Market Analysis, Insights and Forecast - by Region
- 5.3.1. North America
- 5.3.2. Europe
- 5.3.3. Asia Pacific
- 5.3.4. Middle East and Africa
- 5.3.5. South America
- 5.1. Market Analysis, Insights and Forecast - by Type
- 6. Global Power Factor Correction Units Market Analysis, Insights and Forecast, 2021-2033
- 6.1. Market Analysis, Insights and Forecast - by Type
- 6.1.1. Active Power Factor Correction Unit
- 6.1.2. Passive Power Factor Correction Unit
- 6.1.3. Hybrid Power Factor Correction Unit
- 6.2. Market Analysis, Insights and Forecast - by End Users
- 6.2.1. Residential
- 6.2.2. Commercial
- 6.2.3. Industrial
- 6.1. Market Analysis, Insights and Forecast - by Type
- 7. North America Global Power Factor Correction Units Market Analysis, Insights and Forecast, 2020-2032
- 7.1. Market Analysis, Insights and Forecast - by Type
- 7.1.1. Active Power Factor Correction Unit
- 7.1.2. Passive Power Factor Correction Unit
- 7.1.3. Hybrid Power Factor Correction Unit
- 7.2. Market Analysis, Insights and Forecast - by End Users
- 7.2.1. Residential
- 7.2.2. Commercial
- 7.2.3. Industrial
- 7.1. Market Analysis, Insights and Forecast - by Type
- 8. Europe Global Power Factor Correction Units Market Analysis, Insights and Forecast, 2020-2032
- 8.1. Market Analysis, Insights and Forecast - by Type
- 8.1.1. Active Power Factor Correction Unit
- 8.1.2. Passive Power Factor Correction Unit
- 8.1.3. Hybrid Power Factor Correction Unit
- 8.2. Market Analysis, Insights and Forecast - by End Users
- 8.2.1. Residential
- 8.2.2. Commercial
- 8.2.3. Industrial
- 8.1. Market Analysis, Insights and Forecast - by Type
- 9. Asia Pacific Global Power Factor Correction Units Market Analysis, Insights and Forecast, 2020-2032
- 9.1. Market Analysis, Insights and Forecast - by Type
- 9.1.1. Active Power Factor Correction Unit
- 9.1.2. Passive Power Factor Correction Unit
- 9.1.3. Hybrid Power Factor Correction Unit
- 9.2. Market Analysis, Insights and Forecast - by End Users
- 9.2.1. Residential
- 9.2.2. Commercial
- 9.2.3. Industrial
- 9.1. Market Analysis, Insights and Forecast - by Type
- 10. Middle East and Africa Global Power Factor Correction Units Market Analysis, Insights and Forecast, 2020-2032
- 10.1. Market Analysis, Insights and Forecast - by Type
- 10.1.1. Active Power Factor Correction Unit
- 10.1.2. Passive Power Factor Correction Unit
- 10.1.3. Hybrid Power Factor Correction Unit
- 10.2. Market Analysis, Insights and Forecast - by End Users
- 10.2.1. Residential
- 10.2.2. Commercial
- 10.2.3. Industrial
- 10.1. Market Analysis, Insights and Forecast - by Type
- 11. South America Global Power Factor Correction Units Market Analysis, Insights and Forecast, 2020-2032
- 11.1. Market Analysis, Insights and Forecast - by Type
- 11.1.1. Active Power Factor Correction Unit
- 11.1.2. Passive Power Factor Correction Unit
- 11.1.3. Hybrid Power Factor Correction Unit
- 11.2. Market Analysis, Insights and Forecast - by End Users
- 11.2.1. Residential
- 11.2.2. Commercial
- 11.2.3. Industrial
- 11.1. Market Analysis, Insights and Forecast - by Type
- 12. Competitive Analysis
- 12.1. Company Profiles
- 12.1.1 ABB Ltd
- 12.1.1.1. Company Overview
- 12.1.1.2. Products
- 12.1.1.3. Company Financials
- 12.1.1.4. SWOT Analysis
- 12.1.2 Schneider Electric SE
- 12.1.2.1. Company Overview
- 12.1.2.2. Products
- 12.1.2.3. Company Financials
- 12.1.2.4. SWOT Analysis
- 12.1.3 Eaton Corporation
- 12.1.3.1. Company Overview
- 12.1.3.2. Products
- 12.1.3.3. Company Financials
- 12.1.3.4. SWOT Analysis
- 12.1.4 Siemens AG
- 12.1.4.1. Company Overview
- 12.1.4.2. Products
- 12.1.4.3. Company Financials
- 12.1.4.4. SWOT Analysis
- 12.1.5 General Electric Company
- 12.1.5.1. Company Overview
- 12.1.5.2. Products
- 12.1.5.3. Company Financials
- 12.1.5.4. SWOT Analysis
- 12.1.6 Emerson Electric Co
- 12.1.6.1. Company Overview
- 12.1.6.2. Products
- 12.1.6.3. Company Financials
- 12.1.6.4. SWOT Analysis
- 12.1.7 Mitsubishi Electric Corporation
- 12.1.7.1. Company Overview
- 12.1.7.2. Products
- 12.1.7.3. Company Financials
- 12.1.7.4. SWOT Analysis
- 12.1.8 Toshiba Electronic Devices & Storage Corporation
- 12.1.8.1. Company Overview
- 12.1.8.2. Products
- 12.1.8.3. Company Financials
- 12.1.8.4. SWOT Analysis
- 12.1.9 Crompton Greaves Limited
- 12.1.9.1. Company Overview
- 12.1.9.2. Products
- 12.1.9.3. Company Financials
- 12.1.9.4. SWOT Analysis
- 12.1.10 L&T Electrical & Automation*List Not Exhaustive 6 4 List of Other Prominent Companies6 5 Market Ranking/Share (%) Analysi
- 12.1.10.1. Company Overview
- 12.1.10.2. Products
- 12.1.10.3. Company Financials
- 12.1.10.4. SWOT Analysis
- 12.1.1 ABB Ltd
- 12.2. Market Entropy
- 12.2.1 Company's Key Areas Served
- 12.2.2 Recent Developments
- 12.3. Company Market Share Analysis 2025
- 12.3.1 Top 5 Companies Market Share Analysis
- 12.3.2 Top 3 Companies Market Share Analysis
- 12.4. List of Potential Customers
- 13. Research Methodology
List of Figures
- Figure 1: Global Global Power Factor Correction Units Market Revenue Breakdown (Million, %) by Region 2025 & 2033
- Figure 2: Global Global Power Factor Correction Units Market Volume Breakdown (Billion, %) by Region 2025 & 2033
- Figure 3: North America Global Power Factor Correction Units Market Revenue (Million), by Type 2025 & 2033
- Figure 4: North America Global Power Factor Correction Units Market Volume (Billion), by Type 2025 & 2033
- Figure 5: North America Global Power Factor Correction Units Market Revenue Share (%), by Type 2025 & 2033
- Figure 6: North America Global Power Factor Correction Units Market Volume Share (%), by Type 2025 & 2033
- Figure 7: North America Global Power Factor Correction Units Market Revenue (Million), by End Users 2025 & 2033
- Figure 8: North America Global Power Factor Correction Units Market Volume (Billion), by End Users 2025 & 2033
- Figure 9: North America Global Power Factor Correction Units Market Revenue Share (%), by End Users 2025 & 2033
- Figure 10: North America Global Power Factor Correction Units Market Volume Share (%), by End Users 2025 & 2033
- Figure 11: North America Global Power Factor Correction Units Market Revenue (Million), by Country 2025 & 2033
- Figure 12: North America Global Power Factor Correction Units Market Volume (Billion), by Country 2025 & 2033
- Figure 13: North America Global Power Factor Correction Units Market Revenue Share (%), by Country 2025 & 2033
- Figure 14: North America Global Power Factor Correction Units Market Volume Share (%), by Country 2025 & 2033
- Figure 15: Europe Global Power Factor Correction Units Market Revenue (Million), by Type 2025 & 2033
- Figure 16: Europe Global Power Factor Correction Units Market Volume (Billion), by Type 2025 & 2033
- Figure 17: Europe Global Power Factor Correction Units Market Revenue Share (%), by Type 2025 & 2033
- Figure 18: Europe Global Power Factor Correction Units Market Volume Share (%), by Type 2025 & 2033
- Figure 19: Europe Global Power Factor Correction Units Market Revenue (Million), by End Users 2025 & 2033
- Figure 20: Europe Global Power Factor Correction Units Market Volume (Billion), by End Users 2025 & 2033
- Figure 21: Europe Global Power Factor Correction Units Market Revenue Share (%), by End Users 2025 & 2033
- Figure 22: Europe Global Power Factor Correction Units Market Volume Share (%), by End Users 2025 & 2033
- Figure 23: Europe Global Power Factor Correction Units Market Revenue (Million), by Country 2025 & 2033
- Figure 24: Europe Global Power Factor Correction Units Market Volume (Billion), by Country 2025 & 2033
- Figure 25: Europe Global Power Factor Correction Units Market Revenue Share (%), by Country 2025 & 2033
- Figure 26: Europe Global Power Factor Correction Units Market Volume Share (%), by Country 2025 & 2033
- Figure 27: Asia Pacific Global Power Factor Correction Units Market Revenue (Million), by Type 2025 & 2033
- Figure 28: Asia Pacific Global Power Factor Correction Units Market Volume (Billion), by Type 2025 & 2033
- Figure 29: Asia Pacific Global Power Factor Correction Units Market Revenue Share (%), by Type 2025 & 2033
- Figure 30: Asia Pacific Global Power Factor Correction Units Market Volume Share (%), by Type 2025 & 2033
- Figure 31: Asia Pacific Global Power Factor Correction Units Market Revenue (Million), by End Users 2025 & 2033
- Figure 32: Asia Pacific Global Power Factor Correction Units Market Volume (Billion), by End Users 2025 & 2033
- Figure 33: Asia Pacific Global Power Factor Correction Units Market Revenue Share (%), by End Users 2025 & 2033
- Figure 34: Asia Pacific Global Power Factor Correction Units Market Volume Share (%), by End Users 2025 & 2033
- Figure 35: Asia Pacific Global Power Factor Correction Units Market Revenue (Million), by Country 2025 & 2033
- Figure 36: Asia Pacific Global Power Factor Correction Units Market Volume (Billion), by Country 2025 & 2033
- Figure 37: Asia Pacific Global Power Factor Correction Units Market Revenue Share (%), by Country 2025 & 2033
- Figure 38: Asia Pacific Global Power Factor Correction Units Market Volume Share (%), by Country 2025 & 2033
- Figure 39: Middle East and Africa Global Power Factor Correction Units Market Revenue (Million), by Type 2025 & 2033
- Figure 40: Middle East and Africa Global Power Factor Correction Units Market Volume (Billion), by Type 2025 & 2033
- Figure 41: Middle East and Africa Global Power Factor Correction Units Market Revenue Share (%), by Type 2025 & 2033
- Figure 42: Middle East and Africa Global Power Factor Correction Units Market Volume Share (%), by Type 2025 & 2033
- Figure 43: Middle East and Africa Global Power Factor Correction Units Market Revenue (Million), by End Users 2025 & 2033
- Figure 44: Middle East and Africa Global Power Factor Correction Units Market Volume (Billion), by End Users 2025 & 2033
- Figure 45: Middle East and Africa Global Power Factor Correction Units Market Revenue Share (%), by End Users 2025 & 2033
- Figure 46: Middle East and Africa Global Power Factor Correction Units Market Volume Share (%), by End Users 2025 & 2033
- Figure 47: Middle East and Africa Global Power Factor Correction Units Market Revenue (Million), by Country 2025 & 2033
- Figure 48: Middle East and Africa Global Power Factor Correction Units Market Volume (Billion), by Country 2025 & 2033
- Figure 49: Middle East and Africa Global Power Factor Correction Units Market Revenue Share (%), by Country 2025 & 2033
- Figure 50: Middle East and Africa Global Power Factor Correction Units Market Volume Share (%), by Country 2025 & 2033
- Figure 51: South America Global Power Factor Correction Units Market Revenue (Million), by Type 2025 & 2033
- Figure 52: South America Global Power Factor Correction Units Market Volume (Billion), by Type 2025 & 2033
- Figure 53: South America Global Power Factor Correction Units Market Revenue Share (%), by Type 2025 & 2033
- Figure 54: South America Global Power Factor Correction Units Market Volume Share (%), by Type 2025 & 2033
- Figure 55: South America Global Power Factor Correction Units Market Revenue (Million), by End Users 2025 & 2033
- Figure 56: South America Global Power Factor Correction Units Market Volume (Billion), by End Users 2025 & 2033
- Figure 57: South America Global Power Factor Correction Units Market Revenue Share (%), by End Users 2025 & 2033
- Figure 58: South America Global Power Factor Correction Units Market Volume Share (%), by End Users 2025 & 2033
- Figure 59: South America Global Power Factor Correction Units Market Revenue (Million), by Country 2025 & 2033
- Figure 60: South America Global Power Factor Correction Units Market Volume (Billion), by Country 2025 & 2033
- Figure 61: South America Global Power Factor Correction Units Market Revenue Share (%), by Country 2025 & 2033
- Figure 62: South America Global Power Factor Correction Units Market Volume Share (%), by Country 2025 & 2033
List of Tables
- Table 1: Global Power Factor Correction Units Market Revenue Million Forecast, by Type 2020 & 2033
- Table 2: Global Power Factor Correction Units Market Volume Billion Forecast, by Type 2020 & 2033
- Table 3: Global Power Factor Correction Units Market Revenue Million Forecast, by End Users 2020 & 2033
- Table 4: Global Power Factor Correction Units Market Volume Billion Forecast, by End Users 2020 & 2033
- Table 5: Global Power Factor Correction Units Market Revenue Million Forecast, by Region 2020 & 2033
- Table 6: Global Power Factor Correction Units Market Volume Billion Forecast, by Region 2020 & 2033
- Table 7: Global Power Factor Correction Units Market Revenue Million Forecast, by Type 2020 & 2033
- Table 8: Global Power Factor Correction Units Market Volume Billion Forecast, by Type 2020 & 2033
- Table 9: Global Power Factor Correction Units Market Revenue Million Forecast, by End Users 2020 & 2033
- Table 10: Global Power Factor Correction Units Market Volume Billion Forecast, by End Users 2020 & 2033
- Table 11: Global Power Factor Correction Units Market Revenue Million Forecast, by Country 2020 & 2033
- Table 12: Global Power Factor Correction Units Market Volume Billion Forecast, by Country 2020 & 2033
- Table 13: United States Global Power Factor Correction Units Market Revenue (Million) Forecast, by Application 2020 & 2033
- Table 14: United States Global Power Factor Correction Units Market Volume (Billion) Forecast, by Application 2020 & 2033
- Table 15: Canada Global Power Factor Correction Units Market Revenue (Million) Forecast, by Application 2020 & 2033
- Table 16: Canada Global Power Factor Correction Units Market Volume (Billion) Forecast, by Application 2020 & 2033
- Table 17: Rest of North America Global Power Factor Correction Units Market Revenue (Million) Forecast, by Application 2020 & 2033
- Table 18: Rest of North America Global Power Factor Correction Units Market Volume (Billion) Forecast, by Application 2020 & 2033
- Table 19: Global Power Factor Correction Units Market Revenue Million Forecast, by Type 2020 & 2033
- Table 20: Global Power Factor Correction Units Market Volume Billion Forecast, by Type 2020 & 2033
- Table 21: Global Power Factor Correction Units Market Revenue Million Forecast, by End Users 2020 & 2033
- Table 22: Global Power Factor Correction Units Market Volume Billion Forecast, by End Users 2020 & 2033
- Table 23: Global Power Factor Correction Units Market Revenue Million Forecast, by Country 2020 & 2033
- Table 24: Global Power Factor Correction Units Market Volume Billion Forecast, by Country 2020 & 2033
- Table 25: Germany Global Power Factor Correction Units Market Revenue (Million) Forecast, by Application 2020 & 2033
- Table 26: Germany Global Power Factor Correction Units Market Volume (Billion) Forecast, by Application 2020 & 2033
- Table 27: France Global Power Factor Correction Units Market Revenue (Million) Forecast, by Application 2020 & 2033
- Table 28: France Global Power Factor Correction Units Market Volume (Billion) Forecast, by Application 2020 & 2033
- Table 29: United Kingdom Global Power Factor Correction Units Market Revenue (Million) Forecast, by Application 2020 & 2033
- Table 30: United Kingdom Global Power Factor Correction Units Market Volume (Billion) Forecast, by Application 2020 & 2033
- Table 31: Italy Global Power Factor Correction Units Market Revenue (Million) Forecast, by Application 2020 & 2033
- Table 32: Italy Global Power Factor Correction Units Market Volume (Billion) Forecast, by Application 2020 & 2033
- Table 33: Spain Global Power Factor Correction Units Market Revenue (Million) Forecast, by Application 2020 & 2033
- Table 34: Spain Global Power Factor Correction Units Market Volume (Billion) Forecast, by Application 2020 & 2033
- Table 35: NORDIC Global Power Factor Correction Units Market Revenue (Million) Forecast, by Application 2020 & 2033
- Table 36: NORDIC Global Power Factor Correction Units Market Volume (Billion) Forecast, by Application 2020 & 2033
- Table 37: Russia Global Power Factor Correction Units Market Revenue (Million) Forecast, by Application 2020 & 2033
- Table 38: Russia Global Power Factor Correction Units Market Volume (Billion) Forecast, by Application 2020 & 2033
- Table 39: Turkey Global Power Factor Correction Units Market Revenue (Million) Forecast, by Application 2020 & 2033
- Table 40: Turkey Global Power Factor Correction Units Market Volume (Billion) Forecast, by Application 2020 & 2033
- Table 41: Rest of Europe Global Power Factor Correction Units Market Revenue (Million) Forecast, by Application 2020 & 2033
- Table 42: Rest of Europe Global Power Factor Correction Units Market Volume (Billion) Forecast, by Application 2020 & 2033
- Table 43: Global Power Factor Correction Units Market Revenue Million Forecast, by Type 2020 & 2033
- Table 44: Global Power Factor Correction Units Market Volume Billion Forecast, by Type 2020 & 2033
- Table 45: Global Power Factor Correction Units Market Revenue Million Forecast, by End Users 2020 & 2033
- Table 46: Global Power Factor Correction Units Market Volume Billion Forecast, by End Users 2020 & 2033
- Table 47: Global Power Factor Correction Units Market Revenue Million Forecast, by Country 2020 & 2033
- Table 48: Global Power Factor Correction Units Market Volume Billion Forecast, by Country 2020 & 2033
- Table 49: China Global Power Factor Correction Units Market Revenue (Million) Forecast, by Application 2020 & 2033
- Table 50: China Global Power Factor Correction Units Market Volume (Billion) Forecast, by Application 2020 & 2033
- Table 51: India Global Power Factor Correction Units Market Revenue (Million) Forecast, by Application 2020 & 2033
- Table 52: India Global Power Factor Correction Units Market Volume (Billion) Forecast, by Application 2020 & 2033
- Table 53: Australia Global Power Factor Correction Units Market Revenue (Million) Forecast, by Application 2020 & 2033
- Table 54: Australia Global Power Factor Correction Units Market Volume (Billion) Forecast, by Application 2020 & 2033
- Table 55: Japan Global Power Factor Correction Units Market Revenue (Million) Forecast, by Application 2020 & 2033
- Table 56: Japan Global Power Factor Correction Units Market Volume (Billion) Forecast, by Application 2020 & 2033
- Table 57: South Korea Global Power Factor Correction Units Market Revenue (Million) Forecast, by Application 2020 & 2033
- Table 58: South Korea Global Power Factor Correction Units Market Volume (Billion) Forecast, by Application 2020 & 2033
- Table 59: Malaysia Global Power Factor Correction Units Market Revenue (Million) Forecast, by Application 2020 & 2033
- Table 60: Malaysia Global Power Factor Correction Units Market Volume (Billion) Forecast, by Application 2020 & 2033
- Table 61: Thailand Global Power Factor Correction Units Market Revenue (Million) Forecast, by Application 2020 & 2033
- Table 62: Thailand Global Power Factor Correction Units Market Volume (Billion) Forecast, by Application 2020 & 2033
- Table 63: Indonesia Global Power Factor Correction Units Market Revenue (Million) Forecast, by Application 2020 & 2033
- Table 64: Indonesia Global Power Factor Correction Units Market Volume (Billion) Forecast, by Application 2020 & 2033
- Table 65: Vietnam Global Power Factor Correction Units Market Revenue (Million) Forecast, by Application 2020 & 2033
- Table 66: Vietnam Global Power Factor Correction Units Market Volume (Billion) Forecast, by Application 2020 & 2033
- Table 67: Rest of Asia Pacific Global Power Factor Correction Units Market Revenue (Million) Forecast, by Application 2020 & 2033
- Table 68: Rest of Asia Pacific Global Power Factor Correction Units Market Volume (Billion) Forecast, by Application 2020 & 2033
- Table 69: Global Power Factor Correction Units Market Revenue Million Forecast, by Type 2020 & 2033
- Table 70: Global Power Factor Correction Units Market Volume Billion Forecast, by Type 2020 & 2033
- Table 71: Global Power Factor Correction Units Market Revenue Million Forecast, by End Users 2020 & 2033
- Table 72: Global Power Factor Correction Units Market Volume Billion Forecast, by End Users 2020 & 2033
- Table 73: Global Power Factor Correction Units Market Revenue Million Forecast, by Country 2020 & 2033
- Table 74: Global Power Factor Correction Units Market Volume Billion Forecast, by Country 2020 & 2033
- Table 75: Saudi Arabia Global Power Factor Correction Units Market Revenue (Million) Forecast, by Application 2020 & 2033
- Table 76: Saudi Arabia Global Power Factor Correction Units Market Volume (Billion) Forecast, by Application 2020 & 2033
- Table 77: United Arab Emirates Global Power Factor Correction Units Market Revenue (Million) Forecast, by Application 2020 & 2033
- Table 78: United Arab Emirates Global Power Factor Correction Units Market Volume (Billion) Forecast, by Application 2020 & 2033
- Table 79: Nigeria Global Power Factor Correction Units Market Revenue (Million) Forecast, by Application 2020 & 2033
- Table 80: Nigeria Global Power Factor Correction Units Market Volume (Billion) Forecast, by Application 2020 & 2033
- Table 81: Egypt Global Power Factor Correction Units Market Revenue (Million) Forecast, by Application 2020 & 2033
- Table 82: Egypt Global Power Factor Correction Units Market Volume (Billion) Forecast, by Application 2020 & 2033
- Table 83: Qatar Global Power Factor Correction Units Market Revenue (Million) Forecast, by Application 2020 & 2033
- Table 84: Qatar Global Power Factor Correction Units Market Volume (Billion) Forecast, by Application 2020 & 2033
- Table 85: South Africa Global Power Factor Correction Units Market Revenue (Million) Forecast, by Application 2020 & 2033
- Table 86: South Africa Global Power Factor Correction Units Market Volume (Billion) Forecast, by Application 2020 & 2033
- Table 87: Rest of Middle East and Africa Global Power Factor Correction Units Market Revenue (Million) Forecast, by Application 2020 & 2033
- Table 88: Rest of Middle East and Africa Global Power Factor Correction Units Market Volume (Billion) Forecast, by Application 2020 & 2033
- Table 89: Global Power Factor Correction Units Market Revenue Million Forecast, by Type 2020 & 2033
- Table 90: Global Power Factor Correction Units Market Volume Billion Forecast, by Type 2020 & 2033
- Table 91: Global Power Factor Correction Units Market Revenue Million Forecast, by End Users 2020 & 2033
- Table 92: Global Power Factor Correction Units Market Volume Billion Forecast, by End Users 2020 & 2033
- Table 93: Global Power Factor Correction Units Market Revenue Million Forecast, by Country 2020 & 2033
- Table 94: Global Power Factor Correction Units Market Volume Billion Forecast, by Country 2020 & 2033
- Table 95: Brazil Global Power Factor Correction Units Market Revenue (Million) Forecast, by Application 2020 & 2033
- Table 96: Brazil Global Power Factor Correction Units Market Volume (Billion) Forecast, by Application 2020 & 2033
- Table 97: Argentina Global Power Factor Correction Units Market Revenue (Million) Forecast, by Application 2020 & 2033
- Table 98: Argentina Global Power Factor Correction Units Market Volume (Billion) Forecast, by Application 2020 & 2033
- Table 99: Colombia Global Power Factor Correction Units Market Revenue (Million) Forecast, by Application 2020 & 2033
- Table 100: Colombia Global Power Factor Correction Units Market Volume (Billion) Forecast, by Application 2020 & 2033
- Table 101: Rest of South America Global Power Factor Correction Units Market Revenue (Million) Forecast, by Application 2020 & 2033
- Table 102: Rest of South America Global Power Factor Correction Units Market Volume (Billion) Forecast, by Application 2020 & 2033
Frequently Asked Questions
1. What is the projected Compound Annual Growth Rate (CAGR) of the Global Power Factor Correction Units Market?
The projected CAGR is approximately 7.10%.
2. Which companies are prominent players in the Global Power Factor Correction Units Market?
Key companies in the market include ABB Ltd, Schneider Electric SE, Eaton Corporation, Siemens AG, General Electric Company, Emerson Electric Co, Mitsubishi Electric Corporation, Toshiba Electronic Devices & Storage Corporation, Crompton Greaves Limited, L&T Electrical & Automation*List Not Exhaustive 6 4 List of Other Prominent Companies6 5 Market Ranking/Share (%) Analysi.
3. What are the main segments of the Global Power Factor Correction Units Market?
The market segments include Type, End Users.
4. Can you provide details about the market size?
The market size is estimated to be USD 2.20 Million as of 2022.
5. What are some drivers contributing to market growth?
4.; Rapid Industrial Growth4.; Stringent Regulatory Standards.
6. What are the notable trends driving market growth?
The Industrial Segment to Witness Growth.
7. Are there any restraints impacting market growth?
4.; Rapid Industrial Growth4.; Stringent Regulatory Standards.
8. Can you provide examples of recent developments in the market?
March 2024: FRAKO Kondensatoren-und Anlagenbau GmbH partnered with Siemens Mobility Bulgaria to develop a dynamic power factor correction system. This collaboration aims to enhance power quality and reduce costs associated with reactive power. The system is tailored to meet all customer demands, emphasizing power, responsiveness, and longevity.March 2023: Toshiba Electronics Europe GmbH, known as Toshiba, introduced a new 650V-rated discrete IGBT. This IGBT is specifically designed for power factor correction (PFC) circuits in air conditioners, home appliances, and industrial equipment power supplies, among other applications. The GT30J65MRB, a 60A-rated N-channel IGBT, comes in a TO-3P(N) package, leveraging Toshiba's cutting-edge technology and an optimized internal trench design.
9. What pricing options are available for accessing the report?
Pricing options include single-user, multi-user, and enterprise licenses priced at USD 4750, USD 5250, and USD 8750 respectively.
10. Is the market size provided in terms of value or volume?
The market size is provided in terms of value, measured in Million and volume, measured in Billion.
11. Are there any specific market keywords associated with the report?
Yes, the market keyword associated with the report is "Global Power Factor Correction Units Market," which aids in identifying and referencing the specific market segment covered.
12. How do I determine which pricing option suits my needs best?
The pricing options vary based on user requirements and access needs. Individual users may opt for single-user licenses, while businesses requiring broader access may choose multi-user or enterprise licenses for cost-effective access to the report.
13. Are there any additional resources or data provided in the Global Power Factor Correction Units Market report?
While the report offers comprehensive insights, it's advisable to review the specific contents or supplementary materials provided to ascertain if additional resources or data are available.
14. How can I stay updated on further developments or reports in the Global Power Factor Correction Units Market?
To stay informed about further developments, trends, and reports in the Global Power Factor Correction Units Market, consider subscribing to industry newsletters, following relevant companies and organizations, or regularly checking reputable industry news sources and publications.
Methodology
Step 1 - Identification of Relevant Samples Size from Population Database


Step 2 - Approaches for Defining Global Market Size (Value, Volume* & Price*)

Note*: In applicable scenarios
Step 3 - Data Sources
Primary Research
- Web Analytics
- Survey Reports
- Research Institute
- Latest Research Reports
- Opinion Leaders
Secondary Research
- Annual Reports
- White Paper
- Latest Press Release
- Industry Association
- Paid Database
- Investor Presentations

Step 4 - Data Triangulation
Involves using different sources of information in order to increase the validity of a study
These sources are likely to be stakeholders in a program - participants, other researchers, program staff, other community members, and so on.
Then we put all data in single framework & apply various statistical tools to find out the dynamic on the market.
During the analysis stage, feedback from the stakeholder groups would be compared to determine areas of agreement as well as areas of divergence