

Key Insights
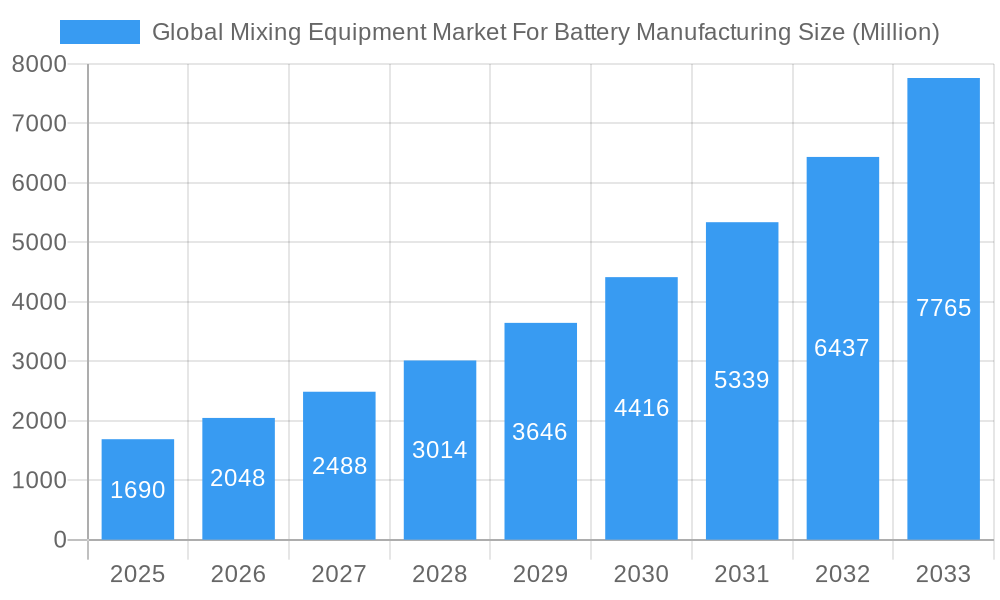
The global market for mixing equipment in battery manufacturing is experiencing robust growth, projected to reach \$1.69 billion in 2025 and exhibiting a Compound Annual Growth Rate (CAGR) of 21.20% from 2025 to 2033. This expansion is primarily driven by the burgeoning electric vehicle (EV) industry and the increasing demand for energy storage solutions. Technological advancements in battery chemistries, particularly the rise of lithium-ion batteries and solid-state batteries, are fueling the need for sophisticated mixing equipment capable of handling diverse materials and achieving precise mixing parameters. Furthermore, stringent regulations concerning battery safety and performance are pushing manufacturers to adopt advanced mixing technologies that ensure consistent quality and reduce defects. Key segments within the market include wet and dry mixers, each catering to specific battery production processes. Leading players like Processall, Charles Ross & Son Company, and MIXACO are actively investing in research and development to enhance their product offerings and maintain their competitive edge. Geographic growth is anticipated across all regions, with North America and Asia-Pacific expected to lead due to significant investments in battery manufacturing facilities and robust EV adoption rates.
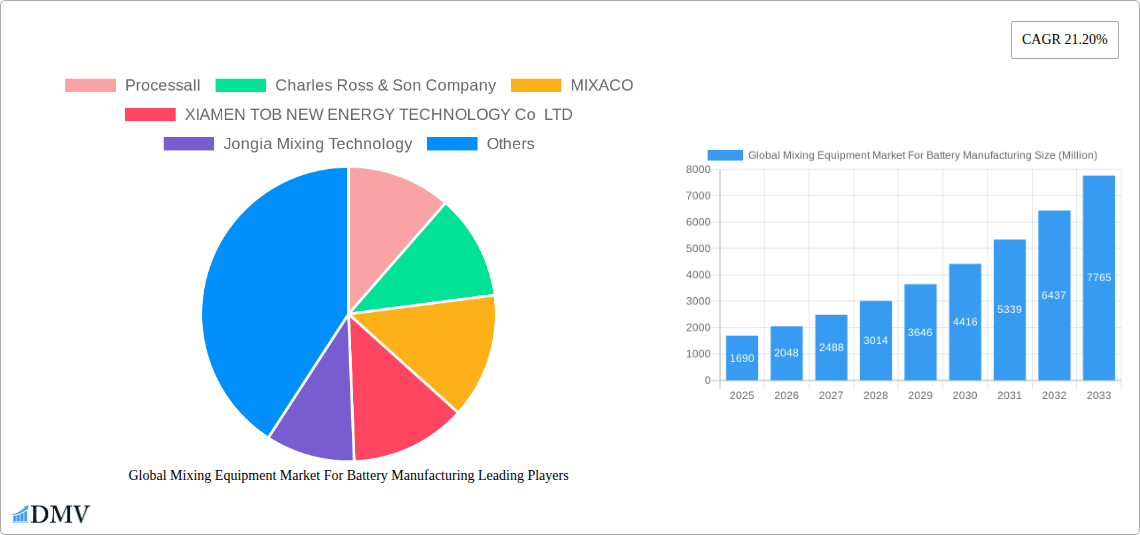
Global Mixing Equipment Market For Battery Manufacturing Market Size (In Billion)
The forecast period (2025-2033) promises continued expansion, driven by further penetration of EVs, grid-scale energy storage deployments, and advancements in battery technologies. However, challenges such as raw material price fluctuations and supply chain complexities could potentially moderate growth. Nevertheless, the long-term outlook remains highly positive, with significant opportunities for companies specializing in high-precision, efficient, and scalable mixing solutions for the battery industry. The market is also witnessing increased focus on sustainable manufacturing practices, driving demand for energy-efficient mixers and environmentally friendly materials. This trend is expected to further accelerate growth in the coming years.
Global Mixing Equipment Market For Battery Manufacturing Company Market Share
Global Mixing Equipment Market for Battery Manufacturing: A Comprehensive Report (2019-2033)
This insightful report provides a comprehensive analysis of the global mixing equipment market for battery manufacturing, offering a detailed overview of market dynamics, technological advancements, key players, and future growth prospects. With a study period spanning 2019-2033, a base year of 2025, and a forecast period from 2025-2033, this report is an essential resource for stakeholders seeking to understand and capitalize on the opportunities within this rapidly evolving market. The market is estimated to reach xx Million by 2025 and expected to continue significant growth throughout the forecast period.
Global Mixing Equipment Market For Battery Manufacturing Market Composition & Trends
The global mixing equipment market for battery manufacturing is characterized by moderate concentration, with several key players holding significant market share. Market share distribution is expected to shift dynamically in the coming years due to technological advancements and strategic mergers & acquisitions (M&A) activity. Innovation is a crucial driver, with companies continuously developing advanced mixing technologies to enhance efficiency, reduce production costs, and improve the quality of battery materials. The regulatory landscape is also influencing market dynamics, with stringent environmental regulations impacting manufacturing processes and material choices. Substitute products are limited, as the specialized nature of battery production necessitates specific mixing equipment. End-users primarily include battery manufacturers, material suppliers, and research institutions. M&A activity, while not overwhelmingly frequent, involves significant deal values, often exceeding xx Million, reflecting the strategic importance of consolidating market share and acquiring technological expertise.
- Market Concentration: Moderate, with top players holding approximately xx% of the market share.
- Innovation Catalysts: Advancements in automation, precision mixing, and process optimization.
- Regulatory Landscape: Stringent environmental and safety regulations impacting manufacturing.
- Substitute Products: Limited due to specialized application requirements.
- End-User Profiles: Primarily battery manufacturers, material suppliers, and research institutions.
- M&A Activity: Occasional high-value deals focusing on technology acquisition and market consolidation (average deal value approximately xx Million).
Global Mixing Equipment Market For Battery Manufacturing Industry Evolution
The global mixing equipment market for battery manufacturing has witnessed robust growth over the historical period (2019-2024), fueled by the booming electric vehicle (EV) industry and the increasing demand for energy storage solutions. Market growth trajectories indicate a Compound Annual Growth Rate (CAGR) of approximately xx% during the forecast period (2025-2033), driven by technological advancements such as the adoption of high-shear mixers and inline mixing systems that enable precise control over mixing parameters and improved product quality. Shifting consumer demands for longer-lasting, higher-performing batteries are directly impacting the need for advanced mixing technologies. The market's evolution is also shaped by a growing focus on sustainability and resource efficiency in battery manufacturing. This trend is driving innovation towards environmentally friendly mixing processes and the use of recyclable materials. Furthermore, the emergence of solid-state batteries is likely to create new opportunities and challenges for the mixing equipment market.
Leading Regions, Countries, or Segments in Global Mixing Equipment Market For Battery Manufacturing
Asia-Pacific, particularly China, currently dominates the global mixing equipment market for battery manufacturing, driven by the region's substantial EV production capacity and government support for battery technology development. This dominance is reinforced by substantial investments in battery manufacturing facilities and supportive regulatory frameworks encouraging innovation.
Key Drivers in Asia-Pacific:
- Massive investments in battery manufacturing plants.
- Strong government support for EV and battery technology adoption.
- Rapid growth of the EV industry.
- Concentrated presence of battery manufacturers.
Segment Dominance: The wet mixers segment currently holds a larger market share compared to dry mixers due to the prevalent use of slurry-based electrode production techniques in lithium-ion battery manufacturing.
Wet Mixers: The high demand for wet mixers is primarily attributable to the prevalent use of slurry-based processes in producing electrodes for lithium-ion batteries. The demand is driven by several factors, including the need for precise control over particle dispersion and viscosity, resulting in improved battery performance. The rise in demand for EVs and energy storage solutions is a key growth driver.
Dry Mixers: The dry mixers segment is expected to show relatively slower growth compared to wet mixers, although still registering significant increase, primarily driven by niche applications, such as the manufacturing of cathode materials requiring specific dry mixing processes to achieve desirable properties and particle size distribution.
Global Mixing Equipment Market For Battery Manufacturing Product Innovations
Recent product innovations focus on enhancing mixing efficiency, reducing energy consumption, and improving process control. High-shear mixers, inline mixers, and automated systems are gaining traction, offering superior performance and productivity. These advancements directly impact product quality and production efficiency, leading to improved battery performance and reduced manufacturing costs. Unique selling propositions center around precision mixing capabilities, reduced processing time, enhanced scalability, and user-friendly operation.
Propelling Factors for Global Mixing Equipment Market For Battery Manufacturing Growth
The growth of the global mixing equipment market is driven by several interconnected factors. The escalating demand for electric vehicles (EVs) is a primary driver, directly translating into increased demand for batteries and consequently for mixing equipment. Furthermore, advancements in battery technology, such as the development of solid-state batteries, are creating new opportunities for specialized mixing equipment. Government initiatives and subsidies aimed at promoting EV adoption and renewable energy storage are providing additional support for market expansion. The need for increased automation and process optimization within battery manufacturing facilities is further boosting demand for high-efficiency mixing solutions.
Obstacles in the Global Mixing Equipment Market For Battery Manufacturing Market
The market faces several challenges. Fluctuations in raw material prices and supply chain disruptions can impact production costs and equipment availability. Intense competition among established and emerging players puts pressure on profit margins. Stringent safety and environmental regulations necessitate compliance costs and potentially limit the use of certain materials or processes. The complexity and high capital investment associated with some advanced mixing technologies can pose a barrier for smaller manufacturers.
Future Opportunities in Global Mixing Equipment Market For Battery Manufacturing
The future holds significant potential for growth. The expanding EV market and the increasing demand for energy storage solutions will continue driving demand. The emergence of next-generation battery technologies, such as solid-state batteries, presents exciting opportunities for specialized mixing equipment. Advancements in automation and AI-powered process control will further optimize mixing efficiency and improve product quality. Expansion into emerging markets with growing demand for energy storage solutions presents substantial opportunities.
Major Players in the Global Mixing Equipment Market For Battery Manufacturing Ecosystem
- Processall
- Charles Ross & Son Company
- MIXACO
- XIAMEN TOB NEW ENERGY TECHNOLOGY Co LTD
- Jongia Mixing Technology
- ONGOAL
- IKA India Private Limited
- SIEHE GROUP
- SCM GROUP LIMITED HK
- Xiamen Tmax Battery Equipments Limited
Key Developments in Global Mixing Equipment Market For Battery Manufacturing Industry
September 2023: Fraunhofer Research Institution for Battery Cell Production utilized a 30-millimeter extruder at FFB’s new R&D site in Münster, Germany. Fraunhofer-Gesellschaft is also building its FFB PreFab test facility, with a throughput of up to 1,200 liters of electrode/battery slurry per hour. This highlights the ongoing advancements in battery slurry processing technology.
May 2023: ONGOAL TECH showcased its cutting-edge battery slurry mixing and material production line models at The Battery Show Europe 2023, demonstrating the company’s commitment to innovation and market leadership.
Strategic Global Mixing Equipment Market For Battery Manufacturing Market Forecast
The global mixing equipment market for battery manufacturing is poised for substantial growth over the forecast period. Continued expansion of the EV sector, coupled with advancements in battery technologies and the increasing adoption of automation in manufacturing processes, will drive market expansion. Emerging markets present significant untapped potential, while technological innovations will lead to the development of more efficient and sustainable mixing solutions. The market's future success hinges on meeting the demands for increased production capacity, improved quality, and cost-effectiveness within the battery manufacturing industry.
Global Mixing Equipment Market For Battery Manufacturing Segmentation
-
1. Type
- 1.1. Wet Mixers
- 1.2. Dry Mixers
Global Mixing Equipment Market For Battery Manufacturing Segmentation By Geography
-
1. North America
- 1.1. United States
- 1.2. Canada
- 1.3. Rest of North America
-
2. Europe
- 2.1. Germany
- 2.2. France
- 2.3. United Kingdom
- 2.4. Italy
- 2.5. Spain
- 2.6. NORDIC
- 2.7. Turkey
- 2.8. Russia
- 2.9. Rest of Europe
-
3. Asia Pacific
- 3.1. China
- 3.2. India
- 3.3. Australia
- 3.4. Japan
- 3.5. Malaysia
- 3.6. Thailand
- 3.7. Indonesia
- 3.8. Vietnam
- 3.9. Rest of Asia Pacific
-
4. Middle East and Africa
- 4.1. Saudi Arabia
- 4.2. United Arab Emirates
- 4.3. Qatar
- 4.4. Egypt
- 4.5. Nigeria
- 4.6. South Africa
- 4.7. Rest of Middle East and Africa
-
5. South America
- 5.1. Brazil
- 5.2. Argentina
- 5.3. Columbia
- 5.4. Rest of South America
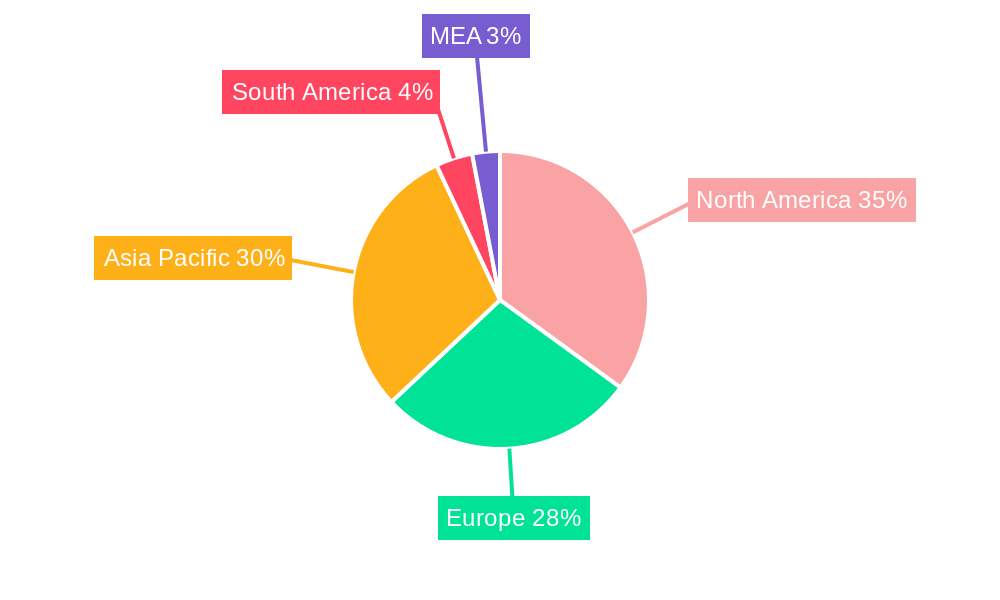
Global Mixing Equipment Market For Battery Manufacturing Regional Market Share
Geographic Coverage of Global Mixing Equipment Market For Battery Manufacturing
Global Mixing Equipment Market For Battery Manufacturing REPORT HIGHLIGHTS
| Aspects | Details |
|---|---|
| Study Period | 2020-2034 |
| Base Year | 2025 |
| Estimated Year | 2026 |
| Forecast Period | 2026-2034 |
| Historical Period | 2020-2025 |
| Growth Rate | CAGR of 21.20% from 2020-2034 |
| Segmentation |
|
Table of Contents
- 1. Introduction
- 1.1. Research Scope
- 1.2. Market Segmentation
- 1.3. Research Objective
- 1.4. Definitions and Assumptions
- 2. Executive Summary
- 2.1. Market Snapshot
- 3. Market Dynamics
- 3.1. Market Drivers
- 3.2. Market Restrains
- 3.3. Market Trends
- 3.4. Market Opportunities
- 4. Market Factor Analysis
- 4.1. Porters Five Forces
- 4.1.1. Bargaining Power of Suppliers
- 4.1.2. Bargaining Power of Buyers
- 4.1.3. Threat of New Entrants
- 4.1.4. Threat of Substitutes
- 4.1.5. Competitive Rivalry
- 4.2. PESTEL analysis
- 4.3. BCG Analysis
- 4.3.1. Stars (High Growth, High Market Share)
- 4.3.2. Cash Cows (Low Growth, High Market Share)
- 4.3.3. Question Mark (High Growth, Low Market Share)
- 4.3.4. Dogs (Low Growth, Low Market Share)
- 4.4. Ansoff Matrix Analysis
- 4.5. Supply Chain Analysis
- 4.6. Regulatory Landscape
- 4.7. Current Market Potential and Opportunity Assessment (TAM–SAM–SOM Framework)
- 4.8. DMV Analyst Note
- 4.1. Porters Five Forces
- 5. Market Analysis, Insights and Forecast 2021-2033
- 5.1. Market Analysis, Insights and Forecast - by Type
- 5.1.1. Wet Mixers
- 5.1.2. Dry Mixers
- 5.2. Market Analysis, Insights and Forecast - by Region
- 5.2.1. North America
- 5.2.2. Europe
- 5.2.3. Asia Pacific
- 5.2.4. Middle East and Africa
- 5.2.5. South America
- 5.1. Market Analysis, Insights and Forecast - by Type
- 6. Global Mixing Equipment Market For Battery Manufacturing Analysis, Insights and Forecast, 2021-2033
- 6.1. Market Analysis, Insights and Forecast - by Type
- 6.1.1. Wet Mixers
- 6.1.2. Dry Mixers
- 6.1. Market Analysis, Insights and Forecast - by Type
- 7. North America Global Mixing Equipment Market For Battery Manufacturing Analysis, Insights and Forecast, 2020-2032
- 7.1. Market Analysis, Insights and Forecast - by Type
- 7.1.1. Wet Mixers
- 7.1.2. Dry Mixers
- 7.1. Market Analysis, Insights and Forecast - by Type
- 8. Europe Global Mixing Equipment Market For Battery Manufacturing Analysis, Insights and Forecast, 2020-2032
- 8.1. Market Analysis, Insights and Forecast - by Type
- 8.1.1. Wet Mixers
- 8.1.2. Dry Mixers
- 8.1. Market Analysis, Insights and Forecast - by Type
- 9. Asia Pacific Global Mixing Equipment Market For Battery Manufacturing Analysis, Insights and Forecast, 2020-2032
- 9.1. Market Analysis, Insights and Forecast - by Type
- 9.1.1. Wet Mixers
- 9.1.2. Dry Mixers
- 9.1. Market Analysis, Insights and Forecast - by Type
- 10. Middle East and Africa Global Mixing Equipment Market For Battery Manufacturing Analysis, Insights and Forecast, 2020-2032
- 10.1. Market Analysis, Insights and Forecast - by Type
- 10.1.1. Wet Mixers
- 10.1.2. Dry Mixers
- 10.1. Market Analysis, Insights and Forecast - by Type
- 11. South America Global Mixing Equipment Market For Battery Manufacturing Analysis, Insights and Forecast, 2020-2032
- 11.1. Market Analysis, Insights and Forecast - by Type
- 11.1.1. Wet Mixers
- 11.1.2. Dry Mixers
- 11.1. Market Analysis, Insights and Forecast - by Type
- 12. Competitive Analysis
- 12.1. Company Profiles
- 12.1.1 Processall
- 12.1.1.1. Company Overview
- 12.1.1.2. Products
- 12.1.1.3. Company Financials
- 12.1.1.4. SWOT Analysis
- 12.1.2 Charles Ross & Son Company
- 12.1.2.1. Company Overview
- 12.1.2.2. Products
- 12.1.2.3. Company Financials
- 12.1.2.4. SWOT Analysis
- 12.1.3 MIXACO
- 12.1.3.1. Company Overview
- 12.1.3.2. Products
- 12.1.3.3. Company Financials
- 12.1.3.4. SWOT Analysis
- 12.1.4 XIAMEN TOB NEW ENERGY TECHNOLOGY Co LTD
- 12.1.4.1. Company Overview
- 12.1.4.2. Products
- 12.1.4.3. Company Financials
- 12.1.4.4. SWOT Analysis
- 12.1.5 Jongia Mixing Technology
- 12.1.5.1. Company Overview
- 12.1.5.2. Products
- 12.1.5.3. Company Financials
- 12.1.5.4. SWOT Analysis
- 12.1.6 ONGOAL
- 12.1.6.1. Company Overview
- 12.1.6.2. Products
- 12.1.6.3. Company Financials
- 12.1.6.4. SWOT Analysis
- 12.1.7 IKA India Private Limited
- 12.1.7.1. Company Overview
- 12.1.7.2. Products
- 12.1.7.3. Company Financials
- 12.1.7.4. SWOT Analysis
- 12.1.8 SIEHE GROUP
- 12.1.8.1. Company Overview
- 12.1.8.2. Products
- 12.1.8.3. Company Financials
- 12.1.8.4. SWOT Analysis
- 12.1.9 SCM GROUP LIMITED HK
- 12.1.9.1. Company Overview
- 12.1.9.2. Products
- 12.1.9.3. Company Financials
- 12.1.9.4. SWOT Analysis
- 12.1.10 Xiamen Tmax Battery Equipments Limited
- 12.1.10.1. Company Overview
- 12.1.10.2. Products
- 12.1.10.3. Company Financials
- 12.1.10.4. SWOT Analysis
- 12.1.1 Processall
- 12.2. Market Entropy
- 12.2.1 Company's Key Areas Served
- 12.2.2 Recent Developments
- 12.3. Company Market Share Analysis 2025
- 12.3.1 Top 5 Companies Market Share Analysis
- 12.3.2 Top 3 Companies Market Share Analysis
- 12.4. List of Potential Customers
- 13. Research Methodology
List of Figures
- Figure 1: Global Global Mixing Equipment Market For Battery Manufacturing Revenue Breakdown (Million, %) by Region 2025 & 2033
- Figure 2: Global Global Mixing Equipment Market For Battery Manufacturing Volume Breakdown (K Unit, %) by Region 2025 & 2033
- Figure 3: North America Global Mixing Equipment Market For Battery Manufacturing Revenue (Million), by Type 2025 & 2033
- Figure 4: North America Global Mixing Equipment Market For Battery Manufacturing Volume (K Unit), by Type 2025 & 2033
- Figure 5: North America Global Mixing Equipment Market For Battery Manufacturing Revenue Share (%), by Type 2025 & 2033
- Figure 6: North America Global Mixing Equipment Market For Battery Manufacturing Volume Share (%), by Type 2025 & 2033
- Figure 7: North America Global Mixing Equipment Market For Battery Manufacturing Revenue (Million), by Country 2025 & 2033
- Figure 8: North America Global Mixing Equipment Market For Battery Manufacturing Volume (K Unit), by Country 2025 & 2033
- Figure 9: North America Global Mixing Equipment Market For Battery Manufacturing Revenue Share (%), by Country 2025 & 2033
- Figure 10: North America Global Mixing Equipment Market For Battery Manufacturing Volume Share (%), by Country 2025 & 2033
- Figure 11: Europe Global Mixing Equipment Market For Battery Manufacturing Revenue (Million), by Type 2025 & 2033
- Figure 12: Europe Global Mixing Equipment Market For Battery Manufacturing Volume (K Unit), by Type 2025 & 2033
- Figure 13: Europe Global Mixing Equipment Market For Battery Manufacturing Revenue Share (%), by Type 2025 & 2033
- Figure 14: Europe Global Mixing Equipment Market For Battery Manufacturing Volume Share (%), by Type 2025 & 2033
- Figure 15: Europe Global Mixing Equipment Market For Battery Manufacturing Revenue (Million), by Country 2025 & 2033
- Figure 16: Europe Global Mixing Equipment Market For Battery Manufacturing Volume (K Unit), by Country 2025 & 2033
- Figure 17: Europe Global Mixing Equipment Market For Battery Manufacturing Revenue Share (%), by Country 2025 & 2033
- Figure 18: Europe Global Mixing Equipment Market For Battery Manufacturing Volume Share (%), by Country 2025 & 2033
- Figure 19: Asia Pacific Global Mixing Equipment Market For Battery Manufacturing Revenue (Million), by Type 2025 & 2033
- Figure 20: Asia Pacific Global Mixing Equipment Market For Battery Manufacturing Volume (K Unit), by Type 2025 & 2033
- Figure 21: Asia Pacific Global Mixing Equipment Market For Battery Manufacturing Revenue Share (%), by Type 2025 & 2033
- Figure 22: Asia Pacific Global Mixing Equipment Market For Battery Manufacturing Volume Share (%), by Type 2025 & 2033
- Figure 23: Asia Pacific Global Mixing Equipment Market For Battery Manufacturing Revenue (Million), by Country 2025 & 2033
- Figure 24: Asia Pacific Global Mixing Equipment Market For Battery Manufacturing Volume (K Unit), by Country 2025 & 2033
- Figure 25: Asia Pacific Global Mixing Equipment Market For Battery Manufacturing Revenue Share (%), by Country 2025 & 2033
- Figure 26: Asia Pacific Global Mixing Equipment Market For Battery Manufacturing Volume Share (%), by Country 2025 & 2033
- Figure 27: Middle East and Africa Global Mixing Equipment Market For Battery Manufacturing Revenue (Million), by Type 2025 & 2033
- Figure 28: Middle East and Africa Global Mixing Equipment Market For Battery Manufacturing Volume (K Unit), by Type 2025 & 2033
- Figure 29: Middle East and Africa Global Mixing Equipment Market For Battery Manufacturing Revenue Share (%), by Type 2025 & 2033
- Figure 30: Middle East and Africa Global Mixing Equipment Market For Battery Manufacturing Volume Share (%), by Type 2025 & 2033
- Figure 31: Middle East and Africa Global Mixing Equipment Market For Battery Manufacturing Revenue (Million), by Country 2025 & 2033
- Figure 32: Middle East and Africa Global Mixing Equipment Market For Battery Manufacturing Volume (K Unit), by Country 2025 & 2033
- Figure 33: Middle East and Africa Global Mixing Equipment Market For Battery Manufacturing Revenue Share (%), by Country 2025 & 2033
- Figure 34: Middle East and Africa Global Mixing Equipment Market For Battery Manufacturing Volume Share (%), by Country 2025 & 2033
- Figure 35: South America Global Mixing Equipment Market For Battery Manufacturing Revenue (Million), by Type 2025 & 2033
- Figure 36: South America Global Mixing Equipment Market For Battery Manufacturing Volume (K Unit), by Type 2025 & 2033
- Figure 37: South America Global Mixing Equipment Market For Battery Manufacturing Revenue Share (%), by Type 2025 & 2033
- Figure 38: South America Global Mixing Equipment Market For Battery Manufacturing Volume Share (%), by Type 2025 & 2033
- Figure 39: South America Global Mixing Equipment Market For Battery Manufacturing Revenue (Million), by Country 2025 & 2033
- Figure 40: South America Global Mixing Equipment Market For Battery Manufacturing Volume (K Unit), by Country 2025 & 2033
- Figure 41: South America Global Mixing Equipment Market For Battery Manufacturing Revenue Share (%), by Country 2025 & 2033
- Figure 42: South America Global Mixing Equipment Market For Battery Manufacturing Volume Share (%), by Country 2025 & 2033
List of Tables
- Table 1: Global Mixing Equipment Market For Battery Manufacturing Revenue Million Forecast, by Type 2020 & 2033
- Table 2: Global Mixing Equipment Market For Battery Manufacturing Volume K Unit Forecast, by Type 2020 & 2033
- Table 3: Global Mixing Equipment Market For Battery Manufacturing Revenue Million Forecast, by Region 2020 & 2033
- Table 4: Global Mixing Equipment Market For Battery Manufacturing Volume K Unit Forecast, by Region 2020 & 2033
- Table 5: Global Mixing Equipment Market For Battery Manufacturing Revenue Million Forecast, by Type 2020 & 2033
- Table 6: Global Mixing Equipment Market For Battery Manufacturing Volume K Unit Forecast, by Type 2020 & 2033
- Table 7: Global Mixing Equipment Market For Battery Manufacturing Revenue Million Forecast, by Country 2020 & 2033
- Table 8: Global Mixing Equipment Market For Battery Manufacturing Volume K Unit Forecast, by Country 2020 & 2033
- Table 9: United States Global Mixing Equipment Market For Battery Manufacturing Revenue (Million) Forecast, by Application 2020 & 2033
- Table 10: United States Global Mixing Equipment Market For Battery Manufacturing Volume (K Unit) Forecast, by Application 2020 & 2033
- Table 11: Canada Global Mixing Equipment Market For Battery Manufacturing Revenue (Million) Forecast, by Application 2020 & 2033
- Table 12: Canada Global Mixing Equipment Market For Battery Manufacturing Volume (K Unit) Forecast, by Application 2020 & 2033
- Table 13: Rest of North America Global Mixing Equipment Market For Battery Manufacturing Revenue (Million) Forecast, by Application 2020 & 2033
- Table 14: Rest of North America Global Mixing Equipment Market For Battery Manufacturing Volume (K Unit) Forecast, by Application 2020 & 2033
- Table 15: Global Mixing Equipment Market For Battery Manufacturing Revenue Million Forecast, by Type 2020 & 2033
- Table 16: Global Mixing Equipment Market For Battery Manufacturing Volume K Unit Forecast, by Type 2020 & 2033
- Table 17: Global Mixing Equipment Market For Battery Manufacturing Revenue Million Forecast, by Country 2020 & 2033
- Table 18: Global Mixing Equipment Market For Battery Manufacturing Volume K Unit Forecast, by Country 2020 & 2033
- Table 19: Germany Global Mixing Equipment Market For Battery Manufacturing Revenue (Million) Forecast, by Application 2020 & 2033
- Table 20: Germany Global Mixing Equipment Market For Battery Manufacturing Volume (K Unit) Forecast, by Application 2020 & 2033
- Table 21: France Global Mixing Equipment Market For Battery Manufacturing Revenue (Million) Forecast, by Application 2020 & 2033
- Table 22: France Global Mixing Equipment Market For Battery Manufacturing Volume (K Unit) Forecast, by Application 2020 & 2033
- Table 23: United Kingdom Global Mixing Equipment Market For Battery Manufacturing Revenue (Million) Forecast, by Application 2020 & 2033
- Table 24: United Kingdom Global Mixing Equipment Market For Battery Manufacturing Volume (K Unit) Forecast, by Application 2020 & 2033
- Table 25: Italy Global Mixing Equipment Market For Battery Manufacturing Revenue (Million) Forecast, by Application 2020 & 2033
- Table 26: Italy Global Mixing Equipment Market For Battery Manufacturing Volume (K Unit) Forecast, by Application 2020 & 2033
- Table 27: Spain Global Mixing Equipment Market For Battery Manufacturing Revenue (Million) Forecast, by Application 2020 & 2033
- Table 28: Spain Global Mixing Equipment Market For Battery Manufacturing Volume (K Unit) Forecast, by Application 2020 & 2033
- Table 29: NORDIC Global Mixing Equipment Market For Battery Manufacturing Revenue (Million) Forecast, by Application 2020 & 2033
- Table 30: NORDIC Global Mixing Equipment Market For Battery Manufacturing Volume (K Unit) Forecast, by Application 2020 & 2033
- Table 31: Turkey Global Mixing Equipment Market For Battery Manufacturing Revenue (Million) Forecast, by Application 2020 & 2033
- Table 32: Turkey Global Mixing Equipment Market For Battery Manufacturing Volume (K Unit) Forecast, by Application 2020 & 2033
- Table 33: Russia Global Mixing Equipment Market For Battery Manufacturing Revenue (Million) Forecast, by Application 2020 & 2033
- Table 34: Russia Global Mixing Equipment Market For Battery Manufacturing Volume (K Unit) Forecast, by Application 2020 & 2033
- Table 35: Rest of Europe Global Mixing Equipment Market For Battery Manufacturing Revenue (Million) Forecast, by Application 2020 & 2033
- Table 36: Rest of Europe Global Mixing Equipment Market For Battery Manufacturing Volume (K Unit) Forecast, by Application 2020 & 2033
- Table 37: Global Mixing Equipment Market For Battery Manufacturing Revenue Million Forecast, by Type 2020 & 2033
- Table 38: Global Mixing Equipment Market For Battery Manufacturing Volume K Unit Forecast, by Type 2020 & 2033
- Table 39: Global Mixing Equipment Market For Battery Manufacturing Revenue Million Forecast, by Country 2020 & 2033
- Table 40: Global Mixing Equipment Market For Battery Manufacturing Volume K Unit Forecast, by Country 2020 & 2033
- Table 41: China Global Mixing Equipment Market For Battery Manufacturing Revenue (Million) Forecast, by Application 2020 & 2033
- Table 42: China Global Mixing Equipment Market For Battery Manufacturing Volume (K Unit) Forecast, by Application 2020 & 2033
- Table 43: India Global Mixing Equipment Market For Battery Manufacturing Revenue (Million) Forecast, by Application 2020 & 2033
- Table 44: India Global Mixing Equipment Market For Battery Manufacturing Volume (K Unit) Forecast, by Application 2020 & 2033
- Table 45: Australia Global Mixing Equipment Market For Battery Manufacturing Revenue (Million) Forecast, by Application 2020 & 2033
- Table 46: Australia Global Mixing Equipment Market For Battery Manufacturing Volume (K Unit) Forecast, by Application 2020 & 2033
- Table 47: Japan Global Mixing Equipment Market For Battery Manufacturing Revenue (Million) Forecast, by Application 2020 & 2033
- Table 48: Japan Global Mixing Equipment Market For Battery Manufacturing Volume (K Unit) Forecast, by Application 2020 & 2033
- Table 49: Malaysia Global Mixing Equipment Market For Battery Manufacturing Revenue (Million) Forecast, by Application 2020 & 2033
- Table 50: Malaysia Global Mixing Equipment Market For Battery Manufacturing Volume (K Unit) Forecast, by Application 2020 & 2033
- Table 51: Thailand Global Mixing Equipment Market For Battery Manufacturing Revenue (Million) Forecast, by Application 2020 & 2033
- Table 52: Thailand Global Mixing Equipment Market For Battery Manufacturing Volume (K Unit) Forecast, by Application 2020 & 2033
- Table 53: Indonesia Global Mixing Equipment Market For Battery Manufacturing Revenue (Million) Forecast, by Application 2020 & 2033
- Table 54: Indonesia Global Mixing Equipment Market For Battery Manufacturing Volume (K Unit) Forecast, by Application 2020 & 2033
- Table 55: Vietnam Global Mixing Equipment Market For Battery Manufacturing Revenue (Million) Forecast, by Application 2020 & 2033
- Table 56: Vietnam Global Mixing Equipment Market For Battery Manufacturing Volume (K Unit) Forecast, by Application 2020 & 2033
- Table 57: Rest of Asia Pacific Global Mixing Equipment Market For Battery Manufacturing Revenue (Million) Forecast, by Application 2020 & 2033
- Table 58: Rest of Asia Pacific Global Mixing Equipment Market For Battery Manufacturing Volume (K Unit) Forecast, by Application 2020 & 2033
- Table 59: Global Mixing Equipment Market For Battery Manufacturing Revenue Million Forecast, by Type 2020 & 2033
- Table 60: Global Mixing Equipment Market For Battery Manufacturing Volume K Unit Forecast, by Type 2020 & 2033
- Table 61: Global Mixing Equipment Market For Battery Manufacturing Revenue Million Forecast, by Country 2020 & 2033
- Table 62: Global Mixing Equipment Market For Battery Manufacturing Volume K Unit Forecast, by Country 2020 & 2033
- Table 63: Saudi Arabia Global Mixing Equipment Market For Battery Manufacturing Revenue (Million) Forecast, by Application 2020 & 2033
- Table 64: Saudi Arabia Global Mixing Equipment Market For Battery Manufacturing Volume (K Unit) Forecast, by Application 2020 & 2033
- Table 65: United Arab Emirates Global Mixing Equipment Market For Battery Manufacturing Revenue (Million) Forecast, by Application 2020 & 2033
- Table 66: United Arab Emirates Global Mixing Equipment Market For Battery Manufacturing Volume (K Unit) Forecast, by Application 2020 & 2033
- Table 67: Qatar Global Mixing Equipment Market For Battery Manufacturing Revenue (Million) Forecast, by Application 2020 & 2033
- Table 68: Qatar Global Mixing Equipment Market For Battery Manufacturing Volume (K Unit) Forecast, by Application 2020 & 2033
- Table 69: Egypt Global Mixing Equipment Market For Battery Manufacturing Revenue (Million) Forecast, by Application 2020 & 2033
- Table 70: Egypt Global Mixing Equipment Market For Battery Manufacturing Volume (K Unit) Forecast, by Application 2020 & 2033
- Table 71: Nigeria Global Mixing Equipment Market For Battery Manufacturing Revenue (Million) Forecast, by Application 2020 & 2033
- Table 72: Nigeria Global Mixing Equipment Market For Battery Manufacturing Volume (K Unit) Forecast, by Application 2020 & 2033
- Table 73: South Africa Global Mixing Equipment Market For Battery Manufacturing Revenue (Million) Forecast, by Application 2020 & 2033
- Table 74: South Africa Global Mixing Equipment Market For Battery Manufacturing Volume (K Unit) Forecast, by Application 2020 & 2033
- Table 75: Rest of Middle East and Africa Global Mixing Equipment Market For Battery Manufacturing Revenue (Million) Forecast, by Application 2020 & 2033
- Table 76: Rest of Middle East and Africa Global Mixing Equipment Market For Battery Manufacturing Volume (K Unit) Forecast, by Application 2020 & 2033
- Table 77: Global Mixing Equipment Market For Battery Manufacturing Revenue Million Forecast, by Type 2020 & 2033
- Table 78: Global Mixing Equipment Market For Battery Manufacturing Volume K Unit Forecast, by Type 2020 & 2033
- Table 79: Global Mixing Equipment Market For Battery Manufacturing Revenue Million Forecast, by Country 2020 & 2033
- Table 80: Global Mixing Equipment Market For Battery Manufacturing Volume K Unit Forecast, by Country 2020 & 2033
- Table 81: Brazil Global Mixing Equipment Market For Battery Manufacturing Revenue (Million) Forecast, by Application 2020 & 2033
- Table 82: Brazil Global Mixing Equipment Market For Battery Manufacturing Volume (K Unit) Forecast, by Application 2020 & 2033
- Table 83: Argentina Global Mixing Equipment Market For Battery Manufacturing Revenue (Million) Forecast, by Application 2020 & 2033
- Table 84: Argentina Global Mixing Equipment Market For Battery Manufacturing Volume (K Unit) Forecast, by Application 2020 & 2033
- Table 85: Columbia Global Mixing Equipment Market For Battery Manufacturing Revenue (Million) Forecast, by Application 2020 & 2033
- Table 86: Columbia Global Mixing Equipment Market For Battery Manufacturing Volume (K Unit) Forecast, by Application 2020 & 2033
- Table 87: Rest of South America Global Mixing Equipment Market For Battery Manufacturing Revenue (Million) Forecast, by Application 2020 & 2033
- Table 88: Rest of South America Global Mixing Equipment Market For Battery Manufacturing Volume (K Unit) Forecast, by Application 2020 & 2033
Frequently Asked Questions
1. What is the projected Compound Annual Growth Rate (CAGR) of the Global Mixing Equipment Market For Battery Manufacturing?
The projected CAGR is approximately 21.20%.
2. Which companies are prominent players in the Global Mixing Equipment Market For Battery Manufacturing?
Key companies in the market include Processall, Charles Ross & Son Company, MIXACO, XIAMEN TOB NEW ENERGY TECHNOLOGY Co LTD, Jongia Mixing Technology, ONGOAL, IKA India Private Limited, SIEHE GROUP, SCM GROUP LIMITED HK, Xiamen Tmax Battery Equipments Limited.
3. What are the main segments of the Global Mixing Equipment Market For Battery Manufacturing?
The market segments include Type.
4. Can you provide details about the market size?
The market size is estimated to be USD 1.69 Million as of 2022.
5. What are some drivers contributing to market growth?
4.; The Increase in Investments to Enhance the Battery Production Capacity4.; Rising Adoption of Electric Vehicles.
6. What are the notable trends driving market growth?
Investments To Enhance the Battery Production Capacity is expected to Drive the Market Growth.
7. Are there any restraints impacting market growth?
4.; The High Logistic Cost.
8. Can you provide examples of recent developments in the market?
September 2023: Fraunhofer Research Institution for Battery Cell Production used a 30-millimeter extruder at FFB’s new R&D site in Münster, Germany. Fraunhofer-Gesellschaft’s research organization is also building its FFB PreFab test facility, with a throughput of up to 1,200 liters of electrode/battery slurry per hour.
9. What pricing options are available for accessing the report?
Pricing options include single-user, multi-user, and enterprise licenses priced at USD 4750, USD 5250, and USD 8750 respectively.
10. Is the market size provided in terms of value or volume?
The market size is provided in terms of value, measured in Million and volume, measured in K Unit.
11. Are there any specific market keywords associated with the report?
Yes, the market keyword associated with the report is "Global Mixing Equipment Market For Battery Manufacturing," which aids in identifying and referencing the specific market segment covered.
12. How do I determine which pricing option suits my needs best?
The pricing options vary based on user requirements and access needs. Individual users may opt for single-user licenses, while businesses requiring broader access may choose multi-user or enterprise licenses for cost-effective access to the report.
13. Are there any additional resources or data provided in the Global Mixing Equipment Market For Battery Manufacturing report?
While the report offers comprehensive insights, it's advisable to review the specific contents or supplementary materials provided to ascertain if additional resources or data are available.
14. How can I stay updated on further developments or reports in the Global Mixing Equipment Market For Battery Manufacturing?
To stay informed about further developments, trends, and reports in the Global Mixing Equipment Market For Battery Manufacturing, consider subscribing to industry newsletters, following relevant companies and organizations, or regularly checking reputable industry news sources and publications.
Methodology
Step 1 - Identification of Relevant Samples Size from Population Database


Step 2 - Approaches for Defining Global Market Size (Value, Volume* & Price*)

Note*: In applicable scenarios
Step 3 - Data Sources
Primary Research
- Web Analytics
- Survey Reports
- Research Institute
- Latest Research Reports
- Opinion Leaders
Secondary Research
- Annual Reports
- White Paper
- Latest Press Release
- Industry Association
- Paid Database
- Investor Presentations

Step 4 - Data Triangulation
Involves using different sources of information in order to increase the validity of a study
These sources are likely to be stakeholders in a program - participants, other researchers, program staff, other community members, and so on.
Then we put all data in single framework & apply various statistical tools to find out the dynamic on the market.
During the analysis stage, feedback from the stakeholder groups would be compared to determine areas of agreement as well as areas of divergence