

Key Insights
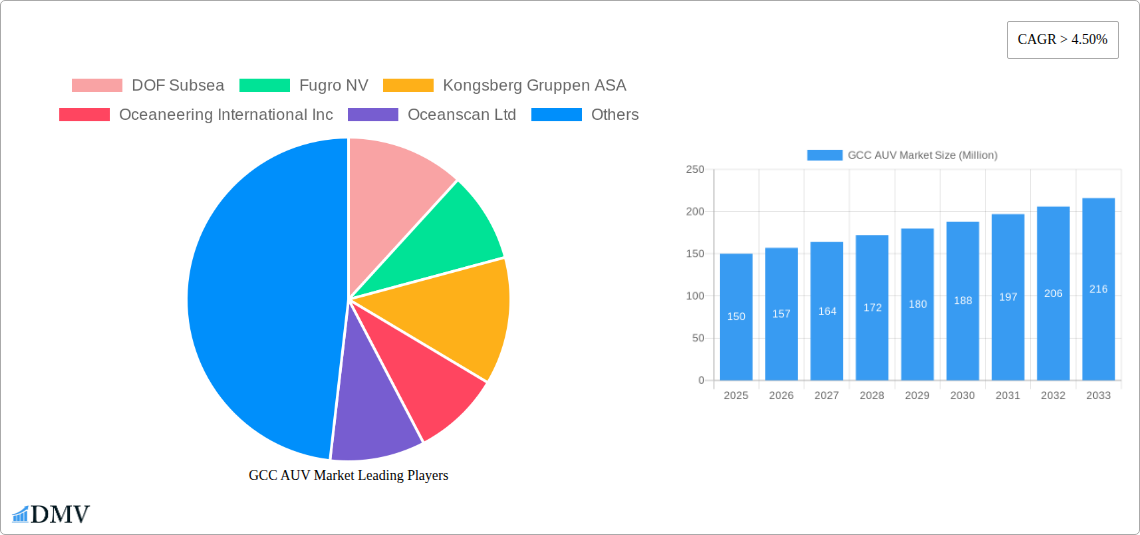
The Gulf Cooperation Council (GCC) Autonomous Underwater Vehicle (AUV) market is poised for substantial expansion. This growth is primarily attributed to escalating investments in offshore oil and gas exploration and production activities, alongside a heightened demand for sophisticated underwater surveillance and defense solutions. Technological advancements, including enhanced sensor capabilities, increased autonomy, and refined navigation systems, are further accelerating market development. Based on a global compound annual growth rate (CAGR) exceeding 4.5% and considering the GCC's vast oil and gas reserves and strategic maritime importance, the GCC AUV market is projected to reach approximately $3830.7 million by 2025. This valuation is expected to see considerable upward revision throughout the forecast period (2025-2033), driven by ongoing infrastructure projects and a reinforced emphasis on maritime security. Leading global AUV manufacturers, many with established regional operations, are instrumental in this growth trajectory through persistent innovation and strategic alliances.
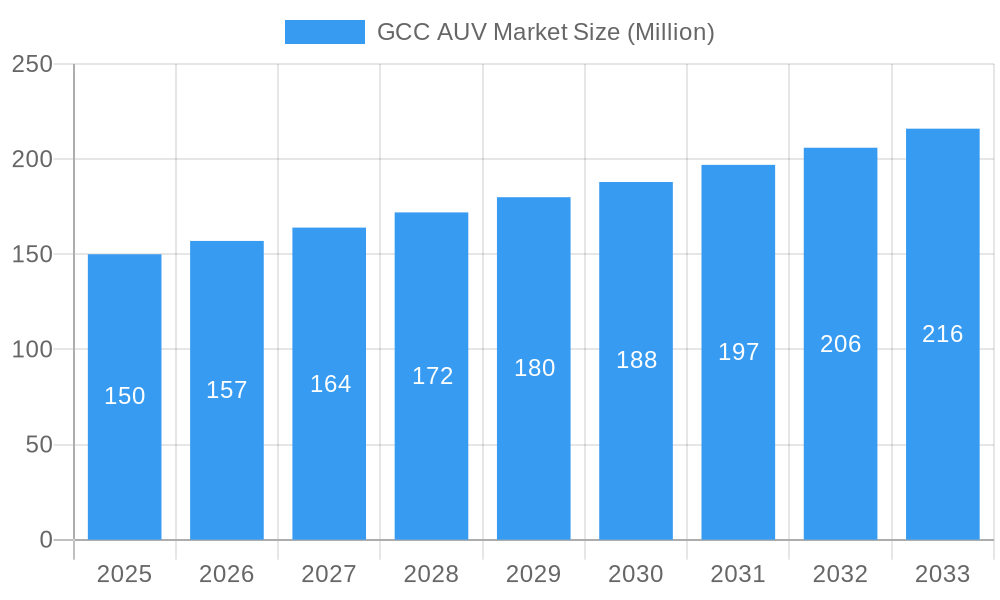
GCC AUV Market Market Size (In Billion)
Market segmentation within the GCC AUV sector aligns with global patterns. The oil and gas exploration and production segment is a key contributor, leveraging AUVs for efficient and cost-effective subsea inspections and surveys. The defense and security sector also represents a significant growth engine, with AUVs playing a critical role in mine countermeasures, seabed surveillance, and underwater reconnaissance. While the "others" segment currently represents a smaller market share, its growth is anticipated due to expanding applications in scientific research, underwater cable maintenance, and nascent sectors. Key market restraints include the substantial initial capital expenditure required for AUV technology and the necessity for specialized expertise in operation and maintenance. Nevertheless, continuous technological progress and increasing governmental support are expected to overcome these challenges, fostering continued market expansion in the GCC region.
GCC AUV Market Company Market Share
GCC AUV Market: A Comprehensive Report (2019-2033)
This insightful report provides a detailed analysis of the GCC Autonomous Underwater Vehicle (AUV) market, offering a comprehensive overview of market trends, leading players, and future growth prospects. The study period covers 2019-2033, with 2025 as the base and estimated year. The forecast period spans 2025-2033, while the historical period encompasses 2019-2024. This report is essential for stakeholders seeking to understand the dynamics of this rapidly evolving market, valued at xx Million in 2025 and projected to reach xx Million by 2033.
GCC AUV Market Composition & Trends
This section delves into the competitive landscape of the GCC AUV market, examining market concentration, innovation drivers, regulatory frameworks, substitute products, end-user profiles, and M&A activities. The market share distribution among key players like DOF Subsea, Fugro NV, Kongsberg Gruppen ASA, Oceaneering International Inc, and others is analyzed, revealing a moderately concentrated market with opportunities for both established players and new entrants. Innovation is fueled by advancements in sensor technology, AI, and communication systems, while regulatory landscapes vary across GCC countries, influencing market access and adoption rates. Substitute technologies, including remotely operated vehicles (ROVs), are also considered. The report includes analysis of M&A activities, providing insights into deal values and their implications for market consolidation. Examples include the xx Million deal between [Company A] and [Company B] in [Year].
- Market Concentration: Moderately concentrated, with top 5 players holding approximately xx% market share in 2025.
- Innovation Catalysts: Advancements in AI, sensor technology, and communication systems.
- Regulatory Landscape: Varies across GCC countries, impacting market access and adoption.
- Substitute Products: ROVs, and other underwater exploration methods.
- End-User Profiles: Primarily Oil & Gas, Defense, and other research sectors.
- M&A Activity: Analysis of key mergers and acquisitions, including deal values and their impact.
GCC AUV Market Industry Evolution
This section meticulously charts the evolution of the GCC AUV market, examining market growth trajectories, technological advancements, and shifting consumer demands. The market experienced a CAGR of xx% during the historical period (2019-2024), driven by increasing demand from the oil and gas sector and defense applications. Technological advancements, particularly in autonomy, endurance, and payload capacity, have significantly expanded AUV capabilities, leading to wider adoption across various industries. The growing emphasis on subsea infrastructure development and environmental monitoring is also contributing to market expansion. Adoption rates are expected to further accelerate due to the ongoing digitalization of the offshore industry and rising investments in underwater infrastructure projects. Specific growth rates and adoption metrics are detailed within the full report.
Leading Regions, Countries, or Segments in GCC AUV Market
The report identifies the dominant region, country, and segment within the GCC AUV market. Analysis indicates that the Oil and Gas sector currently holds the largest market share, followed by the Defense sector. The UAE and Saudi Arabia are the leading countries driving market growth.
Key Drivers:
- Oil and Gas: High investments in offshore exploration and production, stringent safety regulations, and need for efficient subsea operations.
- Defense: Rising geopolitical tensions, increasing focus on maritime security, and the need for advanced underwater surveillance systems.
- Others (Research, Environmental Monitoring): Growing government and private sector investments in research activities and environmental protection initiatives.
Dominance Factors: The significant investments in the Oil and Gas sector in the UAE and Saudi Arabia, coupled with the strategic importance of maritime security in the region, are primarily responsible for the dominance of these segments and countries within the GCC AUV market.
GCC AUV Market Product Innovations
Recent years have witnessed significant innovation in AUV technology, with a focus on improving endurance, payload capacity, and operational efficiency. New AUVs are incorporating advanced sensors, such as high-resolution sonars and multibeam echosounders, enabling enhanced data acquisition and analysis. The integration of AI and machine learning algorithms is revolutionizing AUV navigation, obstacle avoidance, and data processing capabilities. These innovations are driving increased adoption across various sectors.
Propelling Factors for GCC AUV Market Growth
Several factors are driving the growth of the GCC AUV market. Technological advancements, including improved battery technology, enhanced navigation systems, and sophisticated sensor integration, are significantly expanding AUV capabilities. Furthermore, increasing investments in offshore oil and gas exploration and the growing demand for maritime security are boosting market demand. Favorable government policies and regulations promoting technological advancements and innovation are also contributing to market growth. The rise of autonomous systems in various industrial applications also presents a strong growth opportunity.
Obstacles in the GCC AUV Market
Despite the significant growth potential, the GCC AUV market faces several challenges. High initial investment costs for AUVs and associated infrastructure remain a major barrier to entry for smaller companies. Supply chain disruptions and the availability of skilled labor also pose significant concerns. Furthermore, the complex regulatory landscape in the region can create hurdles for market participants. Finally, intense competition from established players can impact market growth.
Future Opportunities in GCC AUV Market
The GCC AUV market is poised for significant growth, presenting several exciting opportunities. The expansion of offshore renewable energy projects creates a demand for AUVs in tasks like underwater cable inspection and installation. Advancements in AI and machine learning will further enhance AUV capabilities, leading to broader applications. Growing emphasis on environmental monitoring and underwater resource management opens up new markets.
Major Players in the GCC AUV Market Ecosystem
- DOF Subsea
- Fugro NV
- Kongsberg Gruppen ASA
- Oceaneering International Inc
- Oceanscan Ltd
- Forum Energy Technologies Inc
- Bluefin Robotics Corp
- Saab AB
- Atlas Elektronik GmbH
Key Developments in GCC AUV Market Industry
- June 2022: King Abdullah University of Science and Technology (KAUST) collaborated with Ocean Aero to deploy solar and battery-powered autonomous underwater and surface vehicles in the Red Sea, Saudi Arabia. This development showcases the growing interest in using AUVs for scientific research and environmental monitoring.
- November 2021: The United Arab Emirates Defense Conglomerate EDGE and Israel Aerospace Industries (IAI) announced a partnership to collaborate on developing unmanned vessels, including undersea drones, capable of anti-submarine warfare. This signifies the increasing role of AUVs in defense applications.
Strategic GCC AUV Market Forecast
The GCC AUV market is projected to experience robust growth over the forecast period, driven by technological advancements, rising investments in offshore infrastructure, and increasing demand for maritime security. New applications in renewable energy, environmental monitoring, and scientific research will further fuel market expansion. The market's potential is significant, with opportunities for both established players and new entrants to capitalize on the growing demand for advanced AUV technology.
GCC AUV Market Segmentation
-
1. Application
- 1.1. Oil and Gas
- 1.2. Defense
- 1.3. Others
-
2. Geography
- 2.1. UAE
- 2.2. Saudi Arabia
- 2.3. Rest of GCC Countries
GCC AUV Market Segmentation By Geography
- 1. UAE
- 2. Saudi Arabia
- 3. Rest of GCC Countries
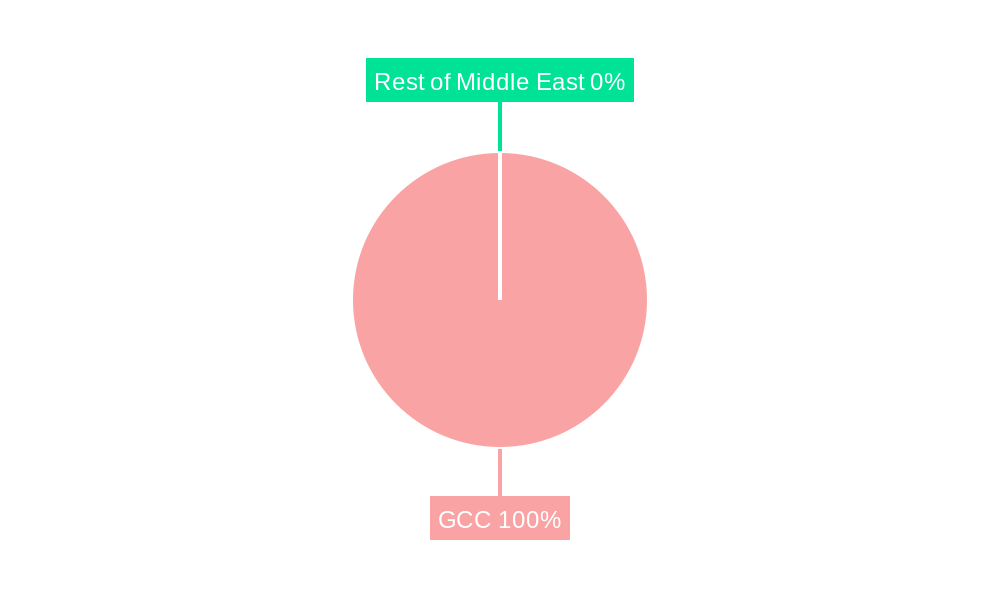
GCC AUV Market Regional Market Share
Geographic Coverage of GCC AUV Market
GCC AUV Market REPORT HIGHLIGHTS
| Aspects | Details |
|---|---|
| Study Period | 2020-2034 |
| Base Year | 2025 |
| Estimated Year | 2026 |
| Forecast Period | 2026-2034 |
| Historical Period | 2020-2025 |
| Growth Rate | CAGR of 21.7% from 2020-2034 |
| Segmentation |
|
Table of Contents
- 1. Introduction
- 1.1. Research Scope
- 1.2. Market Segmentation
- 1.3. Research Objective
- 1.4. Definitions and Assumptions
- 2. Executive Summary
- 2.1. Market Snapshot
- 3. Market Dynamics
- 3.1. Market Drivers
- 3.2. Market Restrains
- 3.3. Market Trends
- 3.4. Market Opportunities
- 4. Market Factor Analysis
- 4.1. Porters Five Forces
- 4.1.1. Bargaining Power of Suppliers
- 4.1.2. Bargaining Power of Buyers
- 4.1.3. Threat of New Entrants
- 4.1.4. Threat of Substitutes
- 4.1.5. Competitive Rivalry
- 4.2. PESTEL analysis
- 4.3. BCG Analysis
- 4.3.1. Stars (High Growth, High Market Share)
- 4.3.2. Cash Cows (Low Growth, High Market Share)
- 4.3.3. Question Mark (High Growth, Low Market Share)
- 4.3.4. Dogs (Low Growth, Low Market Share)
- 4.4. Ansoff Matrix Analysis
- 4.5. Supply Chain Analysis
- 4.6. Regulatory Landscape
- 4.7. Current Market Potential and Opportunity Assessment (TAM–SAM–SOM Framework)
- 4.8. DMV Analyst Note
- 4.1. Porters Five Forces
- 5. Market Analysis, Insights and Forecast 2021-2033
- 5.1. Market Analysis, Insights and Forecast - by Application
- 5.1.1. Oil and Gas
- 5.1.2. Defense
- 5.1.3. Others
- 5.2. Market Analysis, Insights and Forecast - by Geography
- 5.2.1. UAE
- 5.2.2. Saudi Arabia
- 5.2.3. Rest of GCC Countries
- 5.3. Market Analysis, Insights and Forecast - by Region
- 5.3.1. UAE
- 5.3.2. Saudi Arabia
- 5.3.3. Rest of GCC Countries
- 5.1. Market Analysis, Insights and Forecast - by Application
- 6. Global GCC AUV Market Analysis, Insights and Forecast, 2021-2033
- 6.1. Market Analysis, Insights and Forecast - by Application
- 6.1.1. Oil and Gas
- 6.1.2. Defense
- 6.1.3. Others
- 6.2. Market Analysis, Insights and Forecast - by Geography
- 6.2.1. UAE
- 6.2.2. Saudi Arabia
- 6.2.3. Rest of GCC Countries
- 6.1. Market Analysis, Insights and Forecast - by Application
- 7. UAE GCC AUV Market Analysis, Insights and Forecast, 2020-2032
- 7.1. Market Analysis, Insights and Forecast - by Application
- 7.1.1. Oil and Gas
- 7.1.2. Defense
- 7.1.3. Others
- 7.2. Market Analysis, Insights and Forecast - by Geography
- 7.2.1. UAE
- 7.2.2. Saudi Arabia
- 7.2.3. Rest of GCC Countries
- 7.1. Market Analysis, Insights and Forecast - by Application
- 8. Saudi Arabia GCC AUV Market Analysis, Insights and Forecast, 2020-2032
- 8.1. Market Analysis, Insights and Forecast - by Application
- 8.1.1. Oil and Gas
- 8.1.2. Defense
- 8.1.3. Others
- 8.2. Market Analysis, Insights and Forecast - by Geography
- 8.2.1. UAE
- 8.2.2. Saudi Arabia
- 8.2.3. Rest of GCC Countries
- 8.1. Market Analysis, Insights and Forecast - by Application
- 9. Rest of GCC Countries GCC AUV Market Analysis, Insights and Forecast, 2020-2032
- 9.1. Market Analysis, Insights and Forecast - by Application
- 9.1.1. Oil and Gas
- 9.1.2. Defense
- 9.1.3. Others
- 9.2. Market Analysis, Insights and Forecast - by Geography
- 9.2.1. UAE
- 9.2.2. Saudi Arabia
- 9.2.3. Rest of GCC Countries
- 9.1. Market Analysis, Insights and Forecast - by Application
- 10. Competitive Analysis
- 10.1. Company Profiles
- 10.1.1 DOF Subsea
- 10.1.1.1. Company Overview
- 10.1.1.2. Products
- 10.1.1.3. Company Financials
- 10.1.1.4. SWOT Analysis
- 10.1.2 Fugro NV
- 10.1.2.1. Company Overview
- 10.1.2.2. Products
- 10.1.2.3. Company Financials
- 10.1.2.4. SWOT Analysis
- 10.1.3 Kongsberg Gruppen ASA
- 10.1.3.1. Company Overview
- 10.1.3.2. Products
- 10.1.3.3. Company Financials
- 10.1.3.4. SWOT Analysis
- 10.1.4 Oceaneering International Inc
- 10.1.4.1. Company Overview
- 10.1.4.2. Products
- 10.1.4.3. Company Financials
- 10.1.4.4. SWOT Analysis
- 10.1.5 Oceanscan Ltd
- 10.1.5.1. Company Overview
- 10.1.5.2. Products
- 10.1.5.3. Company Financials
- 10.1.5.4. SWOT Analysis
- 10.1.6 Forum Energy Technologies Inc
- 10.1.6.1. Company Overview
- 10.1.6.2. Products
- 10.1.6.3. Company Financials
- 10.1.6.4. SWOT Analysis
- 10.1.7 Bluefin Robotics Corp
- 10.1.7.1. Company Overview
- 10.1.7.2. Products
- 10.1.7.3. Company Financials
- 10.1.7.4. SWOT Analysis
- 10.1.8 Saab AB*List Not Exhaustive
- 10.1.8.1. Company Overview
- 10.1.8.2. Products
- 10.1.8.3. Company Financials
- 10.1.8.4. SWOT Analysis
- 10.1.9 Atlas Elektronik GmbH
- 10.1.9.1. Company Overview
- 10.1.9.2. Products
- 10.1.9.3. Company Financials
- 10.1.9.4. SWOT Analysis
- 10.1.1 DOF Subsea
- 10.2. Market Entropy
- 10.2.1 Company's Key Areas Served
- 10.2.2 Recent Developments
- 10.3. Company Market Share Analysis 2025
- 10.3.1 Top 5 Companies Market Share Analysis
- 10.3.2 Top 3 Companies Market Share Analysis
- 10.4. List of Potential Customers
- 11. Research Methodology
List of Figures
- Figure 1: Global GCC AUV Market Revenue Breakdown (million, %) by Region 2025 & 2033
- Figure 2: Global GCC AUV Market Volume Breakdown (K Unit, %) by Region 2025 & 2033
- Figure 3: UAE GCC AUV Market Revenue (million), by Application 2025 & 2033
- Figure 4: UAE GCC AUV Market Volume (K Unit), by Application 2025 & 2033
- Figure 5: UAE GCC AUV Market Revenue Share (%), by Application 2025 & 2033
- Figure 6: UAE GCC AUV Market Volume Share (%), by Application 2025 & 2033
- Figure 7: UAE GCC AUV Market Revenue (million), by Geography 2025 & 2033
- Figure 8: UAE GCC AUV Market Volume (K Unit), by Geography 2025 & 2033
- Figure 9: UAE GCC AUV Market Revenue Share (%), by Geography 2025 & 2033
- Figure 10: UAE GCC AUV Market Volume Share (%), by Geography 2025 & 2033
- Figure 11: UAE GCC AUV Market Revenue (million), by Country 2025 & 2033
- Figure 12: UAE GCC AUV Market Volume (K Unit), by Country 2025 & 2033
- Figure 13: UAE GCC AUV Market Revenue Share (%), by Country 2025 & 2033
- Figure 14: UAE GCC AUV Market Volume Share (%), by Country 2025 & 2033
- Figure 15: Saudi Arabia GCC AUV Market Revenue (million), by Application 2025 & 2033
- Figure 16: Saudi Arabia GCC AUV Market Volume (K Unit), by Application 2025 & 2033
- Figure 17: Saudi Arabia GCC AUV Market Revenue Share (%), by Application 2025 & 2033
- Figure 18: Saudi Arabia GCC AUV Market Volume Share (%), by Application 2025 & 2033
- Figure 19: Saudi Arabia GCC AUV Market Revenue (million), by Geography 2025 & 2033
- Figure 20: Saudi Arabia GCC AUV Market Volume (K Unit), by Geography 2025 & 2033
- Figure 21: Saudi Arabia GCC AUV Market Revenue Share (%), by Geography 2025 & 2033
- Figure 22: Saudi Arabia GCC AUV Market Volume Share (%), by Geography 2025 & 2033
- Figure 23: Saudi Arabia GCC AUV Market Revenue (million), by Country 2025 & 2033
- Figure 24: Saudi Arabia GCC AUV Market Volume (K Unit), by Country 2025 & 2033
- Figure 25: Saudi Arabia GCC AUV Market Revenue Share (%), by Country 2025 & 2033
- Figure 26: Saudi Arabia GCC AUV Market Volume Share (%), by Country 2025 & 2033
- Figure 27: Rest of GCC Countries GCC AUV Market Revenue (million), by Application 2025 & 2033
- Figure 28: Rest of GCC Countries GCC AUV Market Volume (K Unit), by Application 2025 & 2033
- Figure 29: Rest of GCC Countries GCC AUV Market Revenue Share (%), by Application 2025 & 2033
- Figure 30: Rest of GCC Countries GCC AUV Market Volume Share (%), by Application 2025 & 2033
- Figure 31: Rest of GCC Countries GCC AUV Market Revenue (million), by Geography 2025 & 2033
- Figure 32: Rest of GCC Countries GCC AUV Market Volume (K Unit), by Geography 2025 & 2033
- Figure 33: Rest of GCC Countries GCC AUV Market Revenue Share (%), by Geography 2025 & 2033
- Figure 34: Rest of GCC Countries GCC AUV Market Volume Share (%), by Geography 2025 & 2033
- Figure 35: Rest of GCC Countries GCC AUV Market Revenue (million), by Country 2025 & 2033
- Figure 36: Rest of GCC Countries GCC AUV Market Volume (K Unit), by Country 2025 & 2033
- Figure 37: Rest of GCC Countries GCC AUV Market Revenue Share (%), by Country 2025 & 2033
- Figure 38: Rest of GCC Countries GCC AUV Market Volume Share (%), by Country 2025 & 2033
List of Tables
- Table 1: Global GCC AUV Market Revenue million Forecast, by Application 2020 & 2033
- Table 2: Global GCC AUV Market Volume K Unit Forecast, by Application 2020 & 2033
- Table 3: Global GCC AUV Market Revenue million Forecast, by Geography 2020 & 2033
- Table 4: Global GCC AUV Market Volume K Unit Forecast, by Geography 2020 & 2033
- Table 5: Global GCC AUV Market Revenue million Forecast, by Region 2020 & 2033
- Table 6: Global GCC AUV Market Volume K Unit Forecast, by Region 2020 & 2033
- Table 7: Global GCC AUV Market Revenue million Forecast, by Application 2020 & 2033
- Table 8: Global GCC AUV Market Volume K Unit Forecast, by Application 2020 & 2033
- Table 9: Global GCC AUV Market Revenue million Forecast, by Geography 2020 & 2033
- Table 10: Global GCC AUV Market Volume K Unit Forecast, by Geography 2020 & 2033
- Table 11: Global GCC AUV Market Revenue million Forecast, by Country 2020 & 2033
- Table 12: Global GCC AUV Market Volume K Unit Forecast, by Country 2020 & 2033
- Table 13: Global GCC AUV Market Revenue million Forecast, by Application 2020 & 2033
- Table 14: Global GCC AUV Market Volume K Unit Forecast, by Application 2020 & 2033
- Table 15: Global GCC AUV Market Revenue million Forecast, by Geography 2020 & 2033
- Table 16: Global GCC AUV Market Volume K Unit Forecast, by Geography 2020 & 2033
- Table 17: Global GCC AUV Market Revenue million Forecast, by Country 2020 & 2033
- Table 18: Global GCC AUV Market Volume K Unit Forecast, by Country 2020 & 2033
- Table 19: Global GCC AUV Market Revenue million Forecast, by Application 2020 & 2033
- Table 20: Global GCC AUV Market Volume K Unit Forecast, by Application 2020 & 2033
- Table 21: Global GCC AUV Market Revenue million Forecast, by Geography 2020 & 2033
- Table 22: Global GCC AUV Market Volume K Unit Forecast, by Geography 2020 & 2033
- Table 23: Global GCC AUV Market Revenue million Forecast, by Country 2020 & 2033
- Table 24: Global GCC AUV Market Volume K Unit Forecast, by Country 2020 & 2033
Frequently Asked Questions
1. What is the projected Compound Annual Growth Rate (CAGR) of the GCC AUV Market?
The projected CAGR is approximately 21.7%.
2. Which companies are prominent players in the GCC AUV Market?
Key companies in the market include DOF Subsea, Fugro NV, Kongsberg Gruppen ASA, Oceaneering International Inc, Oceanscan Ltd, Forum Energy Technologies Inc, Bluefin Robotics Corp, Saab AB*List Not Exhaustive, Atlas Elektronik GmbH.
3. What are the main segments of the GCC AUV Market?
The market segments include Application, Geography.
4. Can you provide details about the market size?
The market size is estimated to be USD 3830.7 million as of 2022.
5. What are some drivers contributing to market growth?
4.; Increasing Number of Automobiles4.; The Government Policy Regarding Pollution Emission Control Parameters.
6. What are the notable trends driving market growth?
Oil and gas Segment to have a Significant Share in the Market.
7. Are there any restraints impacting market growth?
4.; The Technological Limitations of Air Filters.
8. Can you provide examples of recent developments in the market?
June 2022: King Abdullah University of Science and Technology (KAUST) collaborated with Ocean Aero to deploy solar and battery-powered autonomous underwater and surface vehicles in the Red Sea, Saudi Arabia, which is expected to enhance KAUST research of the Red Sea.
9. What pricing options are available for accessing the report?
Pricing options include single-user, multi-user, and enterprise licenses priced at USD 4750, USD 5250, and USD 8750 respectively.
10. Is the market size provided in terms of value or volume?
The market size is provided in terms of value, measured in million and volume, measured in K Unit.
11. Are there any specific market keywords associated with the report?
Yes, the market keyword associated with the report is "GCC AUV Market," which aids in identifying and referencing the specific market segment covered.
12. How do I determine which pricing option suits my needs best?
The pricing options vary based on user requirements and access needs. Individual users may opt for single-user licenses, while businesses requiring broader access may choose multi-user or enterprise licenses for cost-effective access to the report.
13. Are there any additional resources or data provided in the GCC AUV Market report?
While the report offers comprehensive insights, it's advisable to review the specific contents or supplementary materials provided to ascertain if additional resources or data are available.
14. How can I stay updated on further developments or reports in the GCC AUV Market?
To stay informed about further developments, trends, and reports in the GCC AUV Market, consider subscribing to industry newsletters, following relevant companies and organizations, or regularly checking reputable industry news sources and publications.
Methodology
Step 1 - Identification of Relevant Samples Size from Population Database


Step 2 - Approaches for Defining Global Market Size (Value, Volume* & Price*)

Note*: In applicable scenarios
Step 3 - Data Sources
Primary Research
- Web Analytics
- Survey Reports
- Research Institute
- Latest Research Reports
- Opinion Leaders
Secondary Research
- Annual Reports
- White Paper
- Latest Press Release
- Industry Association
- Paid Database
- Investor Presentations

Step 4 - Data Triangulation
Involves using different sources of information in order to increase the validity of a study
These sources are likely to be stakeholders in a program - participants, other researchers, program staff, other community members, and so on.
Then we put all data in single framework & apply various statistical tools to find out the dynamic on the market.
During the analysis stage, feedback from the stakeholder groups would be compared to determine areas of agreement as well as areas of divergence