

Key Insights
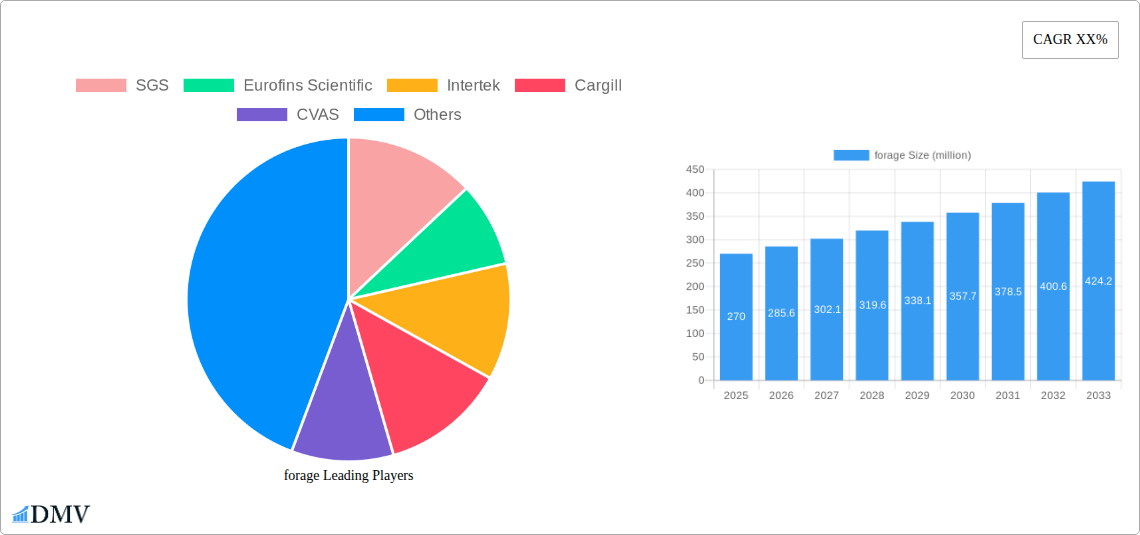
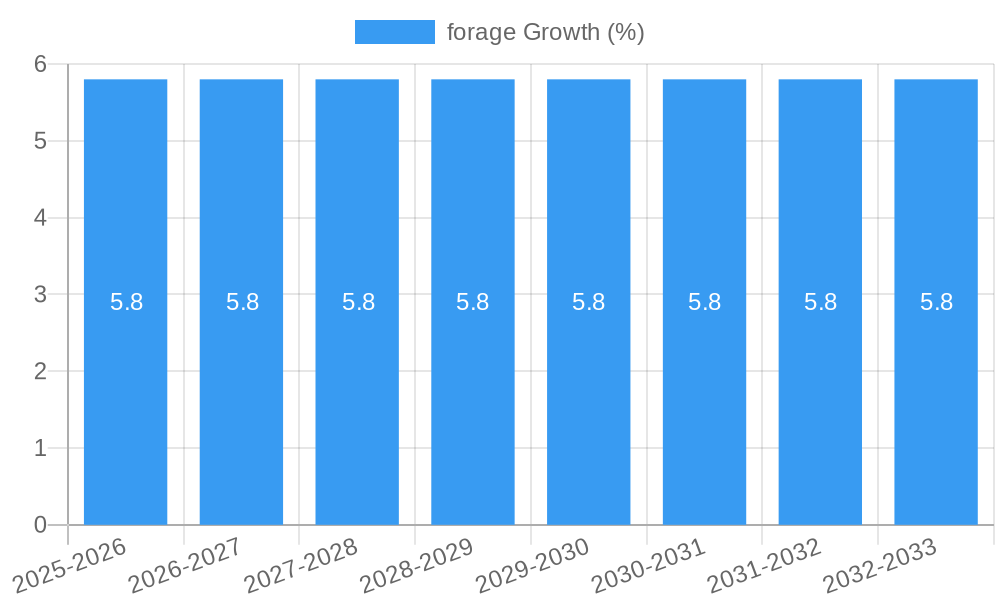
The global forage market is poised for significant expansion, projected to reach a market size of approximately $350 million by 2033, growing at a Compound Annual Growth Rate (CAGR) of around 5.8% from an estimated $270 million in 2025. This robust growth is primarily fueled by the increasing global demand for livestock products, including meat and dairy, which in turn drives the need for high-quality animal feed. The expanding livestock population, particularly in developing regions of Asia Pacific and Latin America, coupled with a growing awareness among farmers regarding the importance of balanced nutrition for optimal animal health and productivity, are key market accelerators. Furthermore, advancements in agricultural technology, such as precision farming and improved cultivation techniques for forage crops, are enhancing yield and quality, contributing to market momentum. The market's trajectory is also influenced by government initiatives aimed at supporting livestock production and ensuring food security, which indirectly bolster the demand for essential feed components like forage.
Despite the optimistic outlook, the forage market faces certain restraints that could temper growth. Fluctuations in raw material prices, including fertilizers and seeds, can impact the profitability of forage production and, consequently, its market price. Additionally, adverse weather conditions and the increasing prevalence of climate change pose risks to crop yields and availability, creating supply chain uncertainties. Stringent regulatory frameworks surrounding animal feed safety and quality standards, while beneficial for the long term, can also add to production costs and complexities for market participants. Nevertheless, the inherent demand for sustainable and efficient animal farming practices, coupled with ongoing innovation in forage varieties and cultivation methods, is expected to enable the market to overcome these challenges and sustain its growth trajectory throughout the forecast period.
Global Forage Market Report: Trends, Innovations, and Forecast (2019-2033)
This comprehensive report delves into the dynamic global forage market, offering an in-depth analysis of its current composition, evolutionary trajectory, and future potential. Covering the study period of 2019–2033, with a base year of 2025 and an estimated year also of 2025, this analysis provides critical insights for stakeholders navigating the evolving agricultural and feed industries. The forecast period spans 2025–2033, building upon detailed examination of the historical period (2019–2024). This report is essential for agribusiness professionals, feed manufacturers, livestock producers, and investors seeking to capitalize on the growing demand for high-quality forage solutions.
forage Market Composition & Trends
The global forage market, valued at an estimated XX million in the base year, exhibits a moderate concentration with key players vying for market share. Innovation in forage genetics, including drought-resistant and nutrient-dense varieties, is a significant catalyst, driving demand and differentiating product offerings. The regulatory landscape, particularly concerning animal feed safety and sustainability standards, plays a crucial role in shaping market access and product development. Substitute products, such as synthetic feed additives, present a minor competitive threat, though the inherent nutritional benefits and cost-effectiveness of natural forage remain paramount. End-user profiles are predominantly livestock farmers, dairies, and beef producers, with a growing segment in equine and pet feed applications. Mergers and acquisitions are anticipated to intensify, with estimated deal values reaching XX million during the forecast period, consolidating market power and fostering synergistic growth. Key players are strategically investing in research and development to enhance forage quality and yield, anticipating a market share distribution where leading companies command approximately XX% of the global market by 2025.
forage Industry Evolution
The forage industry has witnessed remarkable evolution, driven by an escalating global demand for animal protein and a heightened focus on sustainable agricultural practices. Over the historical period (2019-2024), the market experienced a consistent compound annual growth rate (CAGR) of approximately XX%, a trend projected to continue into the forecast period (2025-2033) with an estimated CAGR of XX%. Technological advancements have been pivotal, with the introduction of precision agriculture techniques and advanced breeding programs significantly improving forage yields and nutritional profiles. For instance, advancements in genomic selection have led to the development of forage varieties with XX% higher protein content and XX% improved digestibility, directly impacting livestock health and productivity. Shifting consumer demands for ethically produced and environmentally friendly food products are also indirectly fueling the forage market, as producers seek to optimize animal welfare and reduce the environmental footprint of livestock operations. The adoption of advanced forage analytics, utilizing AI and machine learning to predict optimal harvesting times and soil nutrient management, has seen a XX% increase in adoption among large-scale agricultural enterprises during the past two years. This continuous innovation cycle ensures that the forage industry remains responsive to both market needs and the imperative for a more sustainable food system.
Leading Regions, Countries, or Segments in forage
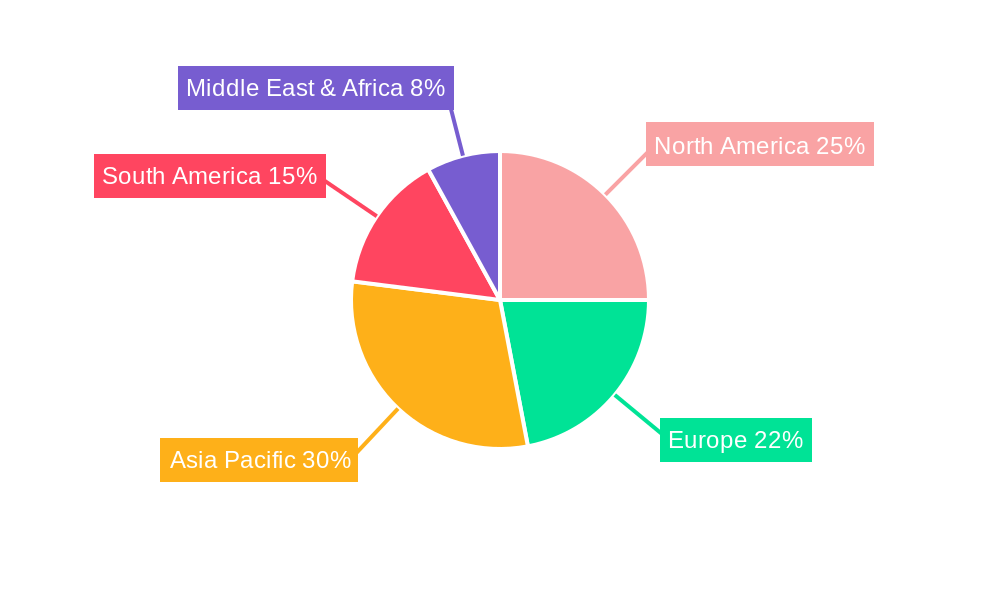
The North American region, particularly the United States, currently dominates the global forage market, driven by its expansive livestock industry and significant agricultural output. The Application segment of Dairy Farming holds the largest market share, accounting for an estimated XX% of the total forage consumption in the base year. This dominance is further propelled by consistent investments in advanced dairy farming technologies and a strong emphasis on optimizing milk production through superior nutrition. Within the Types of forage, Alfalfa remains the most widely cultivated and utilized, owing to its high protein content, adaptability to various soil conditions, and excellent palatability for livestock. Key drivers for this regional and segment dominance include substantial government subsidies for agricultural research and development, a robust regulatory framework that supports quality assurance, and a strong network of forage seed producers and distributors. Investment trends in the US forage sector have seen a XX% increase in the last fiscal year, focusing on enhancing forage resilience against climate change and improving nutrient cycling. Regulatory support for sustainable farming practices further encourages the adoption of high-yielding and environmentally sound forage solutions. The continuous expansion of dairy herds and a persistent demand for high-quality feed are expected to maintain North America's leading position and the preeminence of alfalfa in dairy applications throughout the forecast period.
forage Product Innovations
Innovations in the forage sector are rapidly transforming livestock nutrition and farm productivity. Cutting-edge research is yielding forage varieties with enhanced protein digestibility, improved mineral content, and increased resistance to pests and diseases, promising a XX% uplift in animal growth rates. Novel forage-based feed supplements are emerging, designed to boost gut health and reduce methane emissions from ruminants, a crucial development for environmental sustainability. Performance metrics for these new varieties indicate a XX% reduction in the need for complementary feed additives. Unique selling propositions include the development of perennial forage systems that require less tillage, contributing to soil health and carbon sequestration. Technological advancements in seed coating and pelletization are also improving seed viability and ease of application, further streamlining on-farm operations.
Propelling Factors for forage Growth
Several key factors are propelling the growth of the global forage market. Technologically, advancements in genetic engineering and precision breeding are leading to the development of higher-yielding, more nutrient-dense, and climate-resilient forage crops, such as drought-tolerant varieties capable of producing XX% more yield in arid conditions. Economically, the escalating global demand for animal protein, driven by a growing population and rising disposable incomes, necessitates increased livestock production, directly boosting forage consumption. Regulatory shifts towards sustainable agriculture and the reduction of greenhouse gas emissions are also creating opportunities for forage solutions that enhance animal efficiency and reduce environmental impact. For instance, initiatives promoting reduced reliance on synthetic fertilizers are driving demand for nitrogen-fixing forages.
Obstacles in the forage Market
Despite robust growth prospects, the forage market faces several significant obstacles. Stringent and evolving regulatory frameworks, particularly concerning genetically modified organisms (GMOs) and novel breeding techniques, can create barriers to market entry and adoption in certain regions. Climate change presents a pervasive challenge, with unpredictable weather patterns, increased incidence of extreme events like droughts and floods, and shifting pest pressures impacting forage yield and quality, potentially leading to a XX% decline in harvest yields in vulnerable areas. Supply chain disruptions, exacerbated by geopolitical factors and logistical complexities, can affect the availability and cost of forage seeds and related inputs. Competitive pressures from alternative feed sources and the constant need for significant R&D investment to maintain a competitive edge also pose ongoing challenges for market participants.
Future Opportunities in forage
Emerging opportunities within the forage market are abundant and poised for significant expansion. The growing demand for sustainable and organic food products is creating a niche for organically certified forage seeds and feeds, with an anticipated market growth of XX% over the next decade. Advancements in biotechnology are paving the way for the development of highly specialized forage varieties tailored for specific animal breeds and production systems, offering enhanced nutritional benefits and improved animal health outcomes. Furthermore, the expansion of the global livestock industry into emerging economies presents substantial untapped market potential, requiring localized forage solutions adapted to regional climate and farming practices. The increasing focus on reducing the environmental impact of agriculture also drives opportunities for perennial forage systems that improve soil health and sequester carbon.
Major Players in the forage Ecosystem
The global forage market is characterized by the presence of several prominent companies that are actively shaping its trajectory. These include:
- SGS
- Eurofins Scientific
- Intertek
- Cargill
- CVAS
- R J Hill Laboratories
- Dodson & Horrell
- Cawood Scientific
- Servi-Tech
- Dairyland Laboratories
- Dairy One
- Minnesota Valley Testing Laboratories
- Massey Feeds
Key Developments in forage Industry
- 2024, Q1: Launch of a new drought-resistant alfalfa variety by a leading seed company, promising XX% higher yields in arid regions.
- 2023, Q4: Acquisition of a specialized forage analytics firm by a major agricultural conglomerate, enhancing data-driven farm management solutions.
- 2023, Q3: Introduction of a novel microbial inoculant to improve nitrogen fixation in forage crops, reducing synthetic fertilizer dependency by an estimated XX%.
- 2022, Q2: Significant investment in R&D for climate-resilient forage grasses in response to increasing global weather volatility.
- 2021, Q4: Strategic partnership formed between a global feed producer and a forage research institute to develop premium nutritional feed ingredients.
Strategic forage Market Forecast
The strategic outlook for the forage market is overwhelmingly positive, driven by a confluence of sustained demand for animal protein, technological innovation, and a global imperative for sustainable agriculture. Key growth catalysts include the ongoing development of genetically superior forage varieties that offer enhanced nutritional value and environmental resilience, coupled with the increasing adoption of precision agriculture techniques for optimized forage cultivation. Emerging markets represent a significant expansion frontier, while advancements in feed efficiency and animal health technologies will further underpin market growth. The increasing consumer preference for ethically produced and environmentally sound food products will continue to incentivize the development and adoption of sustainable forage solutions. The market is projected to experience robust growth, offering substantial opportunities for stakeholders who can adapt to evolving agricultural landscapes and capitalize on these powerful growth drivers, with an estimated market value reaching XX million by 2033.
forage Segmentation
- 1. Application
- 2. Types
forage Segmentation By Geography
-
1. North America
- 1.1. United States
- 1.2. Canada
- 1.3. Mexico
-
2. South America
- 2.1. Brazil
- 2.2. Argentina
- 2.3. Rest of South America
-
3. Europe
- 3.1. United Kingdom
- 3.2. Germany
- 3.3. France
- 3.4. Italy
- 3.5. Spain
- 3.6. Russia
- 3.7. Benelux
- 3.8. Nordics
- 3.9. Rest of Europe
-
4. Middle East & Africa
- 4.1. Turkey
- 4.2. Israel
- 4.3. GCC
- 4.4. North Africa
- 4.5. South Africa
- 4.6. Rest of Middle East & Africa
-
5. Asia Pacific
- 5.1. China
- 5.2. India
- 5.3. Japan
- 5.4. South Korea
- 5.5. ASEAN
- 5.6. Oceania
- 5.7. Rest of Asia Pacific
forage REPORT HIGHLIGHTS
| Aspects | Details |
|---|---|
| Study Period | 2019-2033 |
| Base Year | 2024 |
| Estimated Year | 2025 |
| Forecast Period | 2025-2033 |
| Historical Period | 2019-2024 |
| Growth Rate | CAGR of XX% from 2019-2033 |
| Segmentation |
|
Table of Contents
- 1. Introduction
- 1.1. Research Scope
- 1.2. Market Segmentation
- 1.3. Research Methodology
- 1.4. Definitions and Assumptions
- 2. Executive Summary
- 2.1. Introduction
- 3. Market Dynamics
- 3.1. Introduction
- 3.2. Market Drivers
- 3.3. Market Restrains
- 3.4. Market Trends
- 4. Market Factor Analysis
- 4.1. Porters Five Forces
- 4.2. Supply/Value Chain
- 4.3. PESTEL analysis
- 4.4. Market Entropy
- 4.5. Patent/Trademark Analysis
- 5. Global forage Analysis, Insights and Forecast, 2019-2031
- 5.1. Market Analysis, Insights and Forecast - by Application
- 5.2. Market Analysis, Insights and Forecast - by Types
- 5.3. Market Analysis, Insights and Forecast - by Region
- 5.3.1. North America
- 5.3.2. South America
- 5.3.3. Europe
- 5.3.4. Middle East & Africa
- 5.3.5. Asia Pacific
- 5.1. Market Analysis, Insights and Forecast - by Application
- 6. North America forage Analysis, Insights and Forecast, 2019-2031
- 6.1. Market Analysis, Insights and Forecast - by Application
- 6.2. Market Analysis, Insights and Forecast - by Types
- 6.1. Market Analysis, Insights and Forecast - by Application
- 7. South America forage Analysis, Insights and Forecast, 2019-2031
- 7.1. Market Analysis, Insights and Forecast - by Application
- 7.2. Market Analysis, Insights and Forecast - by Types
- 7.1. Market Analysis, Insights and Forecast - by Application
- 8. Europe forage Analysis, Insights and Forecast, 2019-2031
- 8.1. Market Analysis, Insights and Forecast - by Application
- 8.2. Market Analysis, Insights and Forecast - by Types
- 8.1. Market Analysis, Insights and Forecast - by Application
- 9. Middle East & Africa forage Analysis, Insights and Forecast, 2019-2031
- 9.1. Market Analysis, Insights and Forecast - by Application
- 9.2. Market Analysis, Insights and Forecast - by Types
- 9.1. Market Analysis, Insights and Forecast - by Application
- 10. Asia Pacific forage Analysis, Insights and Forecast, 2019-2031
- 10.1. Market Analysis, Insights and Forecast - by Application
- 10.2. Market Analysis, Insights and Forecast - by Types
- 10.1. Market Analysis, Insights and Forecast - by Application
- 11. Competitive Analysis
- 11.1. Global Market Share Analysis 2024
- 11.2. Company Profiles
- 11.2.1 SGS
- 11.2.1.1. Overview
- 11.2.1.2. Products
- 11.2.1.3. SWOT Analysis
- 11.2.1.4. Recent Developments
- 11.2.1.5. Financials (Based on Availability)
- 11.2.2 Eurofins Scientific
- 11.2.2.1. Overview
- 11.2.2.2. Products
- 11.2.2.3. SWOT Analysis
- 11.2.2.4. Recent Developments
- 11.2.2.5. Financials (Based on Availability)
- 11.2.3 Intertek
- 11.2.3.1. Overview
- 11.2.3.2. Products
- 11.2.3.3. SWOT Analysis
- 11.2.3.4. Recent Developments
- 11.2.3.5. Financials (Based on Availability)
- 11.2.4 Cargill
- 11.2.4.1. Overview
- 11.2.4.2. Products
- 11.2.4.3. SWOT Analysis
- 11.2.4.4. Recent Developments
- 11.2.4.5. Financials (Based on Availability)
- 11.2.5 CVAS
- 11.2.5.1. Overview
- 11.2.5.2. Products
- 11.2.5.3. SWOT Analysis
- 11.2.5.4. Recent Developments
- 11.2.5.5. Financials (Based on Availability)
- 11.2.6 R J Hill Laboratories
- 11.2.6.1. Overview
- 11.2.6.2. Products
- 11.2.6.3. SWOT Analysis
- 11.2.6.4. Recent Developments
- 11.2.6.5. Financials (Based on Availability)
- 11.2.7 Dodson & Horrell
- 11.2.7.1. Overview
- 11.2.7.2. Products
- 11.2.7.3. SWOT Analysis
- 11.2.7.4. Recent Developments
- 11.2.7.5. Financials (Based on Availability)
- 11.2.8 Cawood Scientific
- 11.2.8.1. Overview
- 11.2.8.2. Products
- 11.2.8.3. SWOT Analysis
- 11.2.8.4. Recent Developments
- 11.2.8.5. Financials (Based on Availability)
- 11.2.9 Servi-Tech
- 11.2.9.1. Overview
- 11.2.9.2. Products
- 11.2.9.3. SWOT Analysis
- 11.2.9.4. Recent Developments
- 11.2.9.5. Financials (Based on Availability)
- 11.2.10 Dairyland Laboratories
- 11.2.10.1. Overview
- 11.2.10.2. Products
- 11.2.10.3. SWOT Analysis
- 11.2.10.4. Recent Developments
- 11.2.10.5. Financials (Based on Availability)
- 11.2.11 Dairy One
- 11.2.11.1. Overview
- 11.2.11.2. Products
- 11.2.11.3. SWOT Analysis
- 11.2.11.4. Recent Developments
- 11.2.11.5. Financials (Based on Availability)
- 11.2.12 Minnesota Valley Testing Laboratories
- 11.2.12.1. Overview
- 11.2.12.2. Products
- 11.2.12.3. SWOT Analysis
- 11.2.12.4. Recent Developments
- 11.2.12.5. Financials (Based on Availability)
- 11.2.13 Massey Feeds
- 11.2.13.1. Overview
- 11.2.13.2. Products
- 11.2.13.3. SWOT Analysis
- 11.2.13.4. Recent Developments
- 11.2.13.5. Financials (Based on Availability)
- 11.2.1 SGS
List of Figures
- Figure 1: Global forage Revenue Breakdown (million, %) by Region 2024 & 2032
- Figure 2: North America forage Revenue (million), by Application 2024 & 2032
- Figure 3: North America forage Revenue Share (%), by Application 2024 & 2032
- Figure 4: North America forage Revenue (million), by Types 2024 & 2032
- Figure 5: North America forage Revenue Share (%), by Types 2024 & 2032
- Figure 6: North America forage Revenue (million), by Country 2024 & 2032
- Figure 7: North America forage Revenue Share (%), by Country 2024 & 2032
- Figure 8: South America forage Revenue (million), by Application 2024 & 2032
- Figure 9: South America forage Revenue Share (%), by Application 2024 & 2032
- Figure 10: South America forage Revenue (million), by Types 2024 & 2032
- Figure 11: South America forage Revenue Share (%), by Types 2024 & 2032
- Figure 12: South America forage Revenue (million), by Country 2024 & 2032
- Figure 13: South America forage Revenue Share (%), by Country 2024 & 2032
- Figure 14: Europe forage Revenue (million), by Application 2024 & 2032
- Figure 15: Europe forage Revenue Share (%), by Application 2024 & 2032
- Figure 16: Europe forage Revenue (million), by Types 2024 & 2032
- Figure 17: Europe forage Revenue Share (%), by Types 2024 & 2032
- Figure 18: Europe forage Revenue (million), by Country 2024 & 2032
- Figure 19: Europe forage Revenue Share (%), by Country 2024 & 2032
- Figure 20: Middle East & Africa forage Revenue (million), by Application 2024 & 2032
- Figure 21: Middle East & Africa forage Revenue Share (%), by Application 2024 & 2032
- Figure 22: Middle East & Africa forage Revenue (million), by Types 2024 & 2032
- Figure 23: Middle East & Africa forage Revenue Share (%), by Types 2024 & 2032
- Figure 24: Middle East & Africa forage Revenue (million), by Country 2024 & 2032
- Figure 25: Middle East & Africa forage Revenue Share (%), by Country 2024 & 2032
- Figure 26: Asia Pacific forage Revenue (million), by Application 2024 & 2032
- Figure 27: Asia Pacific forage Revenue Share (%), by Application 2024 & 2032
- Figure 28: Asia Pacific forage Revenue (million), by Types 2024 & 2032
- Figure 29: Asia Pacific forage Revenue Share (%), by Types 2024 & 2032
- Figure 30: Asia Pacific forage Revenue (million), by Country 2024 & 2032
- Figure 31: Asia Pacific forage Revenue Share (%), by Country 2024 & 2032
List of Tables
- Table 1: Global forage Revenue million Forecast, by Region 2019 & 2032
- Table 2: Global forage Revenue million Forecast, by Application 2019 & 2032
- Table 3: Global forage Revenue million Forecast, by Types 2019 & 2032
- Table 4: Global forage Revenue million Forecast, by Region 2019 & 2032
- Table 5: Global forage Revenue million Forecast, by Application 2019 & 2032
- Table 6: Global forage Revenue million Forecast, by Types 2019 & 2032
- Table 7: Global forage Revenue million Forecast, by Country 2019 & 2032
- Table 8: United States forage Revenue (million) Forecast, by Application 2019 & 2032
- Table 9: Canada forage Revenue (million) Forecast, by Application 2019 & 2032
- Table 10: Mexico forage Revenue (million) Forecast, by Application 2019 & 2032
- Table 11: Global forage Revenue million Forecast, by Application 2019 & 2032
- Table 12: Global forage Revenue million Forecast, by Types 2019 & 2032
- Table 13: Global forage Revenue million Forecast, by Country 2019 & 2032
- Table 14: Brazil forage Revenue (million) Forecast, by Application 2019 & 2032
- Table 15: Argentina forage Revenue (million) Forecast, by Application 2019 & 2032
- Table 16: Rest of South America forage Revenue (million) Forecast, by Application 2019 & 2032
- Table 17: Global forage Revenue million Forecast, by Application 2019 & 2032
- Table 18: Global forage Revenue million Forecast, by Types 2019 & 2032
- Table 19: Global forage Revenue million Forecast, by Country 2019 & 2032
- Table 20: United Kingdom forage Revenue (million) Forecast, by Application 2019 & 2032
- Table 21: Germany forage Revenue (million) Forecast, by Application 2019 & 2032
- Table 22: France forage Revenue (million) Forecast, by Application 2019 & 2032
- Table 23: Italy forage Revenue (million) Forecast, by Application 2019 & 2032
- Table 24: Spain forage Revenue (million) Forecast, by Application 2019 & 2032
- Table 25: Russia forage Revenue (million) Forecast, by Application 2019 & 2032
- Table 26: Benelux forage Revenue (million) Forecast, by Application 2019 & 2032
- Table 27: Nordics forage Revenue (million) Forecast, by Application 2019 & 2032
- Table 28: Rest of Europe forage Revenue (million) Forecast, by Application 2019 & 2032
- Table 29: Global forage Revenue million Forecast, by Application 2019 & 2032
- Table 30: Global forage Revenue million Forecast, by Types 2019 & 2032
- Table 31: Global forage Revenue million Forecast, by Country 2019 & 2032
- Table 32: Turkey forage Revenue (million) Forecast, by Application 2019 & 2032
- Table 33: Israel forage Revenue (million) Forecast, by Application 2019 & 2032
- Table 34: GCC forage Revenue (million) Forecast, by Application 2019 & 2032
- Table 35: North Africa forage Revenue (million) Forecast, by Application 2019 & 2032
- Table 36: South Africa forage Revenue (million) Forecast, by Application 2019 & 2032
- Table 37: Rest of Middle East & Africa forage Revenue (million) Forecast, by Application 2019 & 2032
- Table 38: Global forage Revenue million Forecast, by Application 2019 & 2032
- Table 39: Global forage Revenue million Forecast, by Types 2019 & 2032
- Table 40: Global forage Revenue million Forecast, by Country 2019 & 2032
- Table 41: China forage Revenue (million) Forecast, by Application 2019 & 2032
- Table 42: India forage Revenue (million) Forecast, by Application 2019 & 2032
- Table 43: Japan forage Revenue (million) Forecast, by Application 2019 & 2032
- Table 44: South Korea forage Revenue (million) Forecast, by Application 2019 & 2032
- Table 45: ASEAN forage Revenue (million) Forecast, by Application 2019 & 2032
- Table 46: Oceania forage Revenue (million) Forecast, by Application 2019 & 2032
- Table 47: Rest of Asia Pacific forage Revenue (million) Forecast, by Application 2019 & 2032
Frequently Asked Questions
1. What is the projected Compound Annual Growth Rate (CAGR) of the forage?
The projected CAGR is approximately XX%.
2. Which companies are prominent players in the forage?
Key companies in the market include SGS, Eurofins Scientific, Intertek, Cargill, CVAS, R J Hill Laboratories, Dodson & Horrell, Cawood Scientific, Servi-Tech, Dairyland Laboratories, Dairy One, Minnesota Valley Testing Laboratories, Massey Feeds.
3. What are the main segments of the forage?
The market segments include Application, Types.
4. Can you provide details about the market size?
The market size is estimated to be USD XXX million as of 2022.
5. What are some drivers contributing to market growth?
N/A
6. What are the notable trends driving market growth?
N/A
7. Are there any restraints impacting market growth?
N/A
8. Can you provide examples of recent developments in the market?
N/A
9. What pricing options are available for accessing the report?
Pricing options include single-user, multi-user, and enterprise licenses priced at USD 4350.00, USD 6525.00, and USD 8700.00 respectively.
10. Is the market size provided in terms of value or volume?
The market size is provided in terms of value, measured in million.
11. Are there any specific market keywords associated with the report?
Yes, the market keyword associated with the report is "forage," which aids in identifying and referencing the specific market segment covered.
12. How do I determine which pricing option suits my needs best?
The pricing options vary based on user requirements and access needs. Individual users may opt for single-user licenses, while businesses requiring broader access may choose multi-user or enterprise licenses for cost-effective access to the report.
13. Are there any additional resources or data provided in the forage report?
While the report offers comprehensive insights, it's advisable to review the specific contents or supplementary materials provided to ascertain if additional resources or data are available.
14. How can I stay updated on further developments or reports in the forage?
To stay informed about further developments, trends, and reports in the forage, consider subscribing to industry newsletters, following relevant companies and organizations, or regularly checking reputable industry news sources and publications.
Methodology
Step 1 - Identification of Relevant Samples Size from Population Database


Step 2 - Approaches for Defining Global Market Size (Value, Volume* & Price*)

Note*: In applicable scenarios
Step 3 - Data Sources
Primary Research
- Web Analytics
- Survey Reports
- Research Institute
- Latest Research Reports
- Opinion Leaders
Secondary Research
- Annual Reports
- White Paper
- Latest Press Release
- Industry Association
- Paid Database
- Investor Presentations

Step 4 - Data Triangulation
Involves using different sources of information in order to increase the validity of a study
These sources are likely to be stakeholders in a program - participants, other researchers, program staff, other community members, and so on.
Then we put all data in single framework & apply various statistical tools to find out the dynamic on the market.
During the analysis stage, feedback from the stakeholder groups would be compared to determine areas of agreement as well as areas of divergence
