

Key Insights
The global Fish Oil Omega-3 market is poised for significant expansion, projected to reach an estimated $4.36 billion in 2025. This robust growth trajectory is underpinned by a compelling compound annual growth rate (CAGR) of 12.2% from 2019 to 2033. A primary driver behind this surge is the escalating consumer awareness regarding the profound health benefits of Omega-3 fatty acids, particularly DHA and EPA. These nutrients are increasingly recognized for their crucial roles in cognitive function, cardiovascular health, and inflammatory response management. Consequently, demand for fish oil-derived Omega-3s is experiencing a substantial uptick across various applications, including dietary supplements, fortified foods and beverages, and infant formula. The pharmaceutical sector also contributes to this growth, utilizing Omega-3s in specialized drug formulations. Furthermore, the pet food industry is witnessing a growing trend of incorporating Omega-3s for improved animal health and well-being, adding another layer of market dynamism.
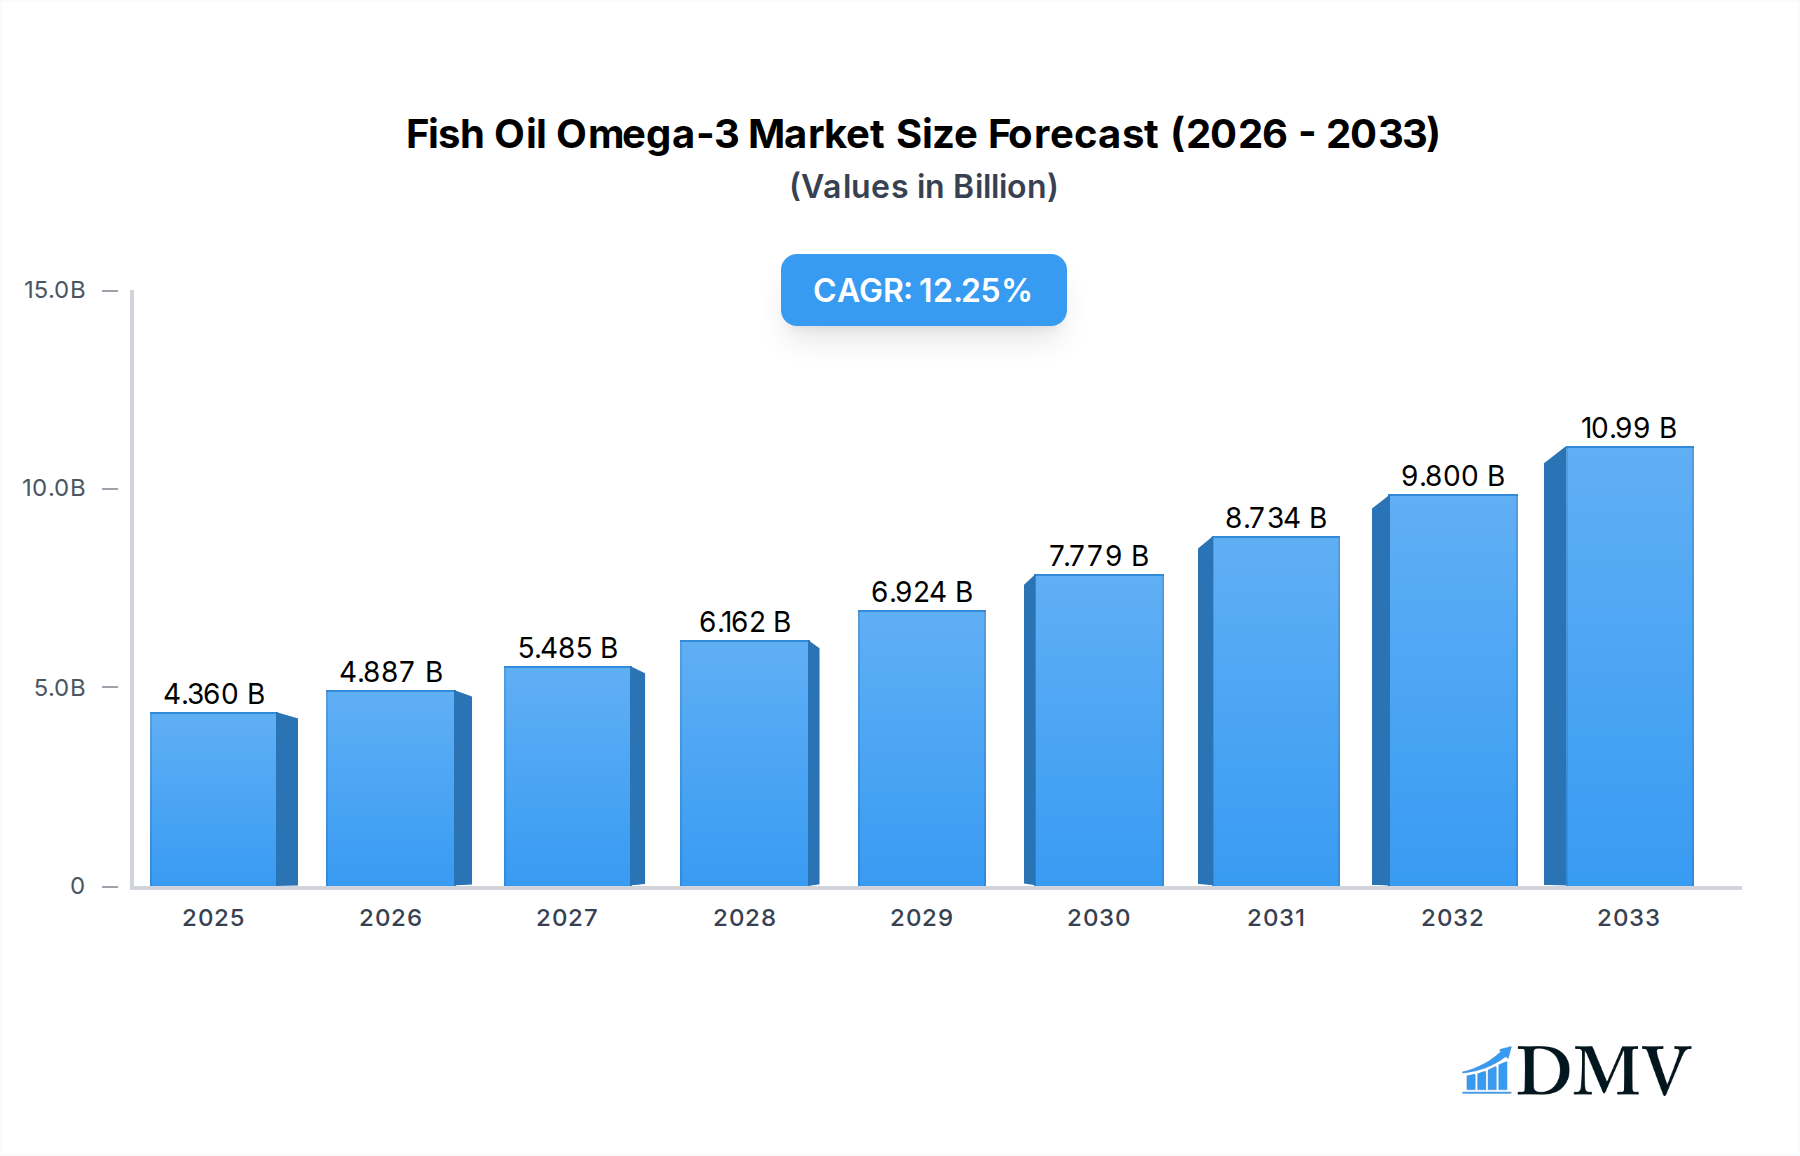
Fish Oil Omega-3 Market Size (In Billion)
Key trends shaping the Fish Oil Omega-3 market include a strong emphasis on product innovation and diversification. Manufacturers are investing in advanced purification and encapsulation technologies to enhance the quality, stability, and bioavailability of Omega-3 ingredients. This also extends to offering a wider variety of product formats to cater to diverse consumer preferences. The growing preference for sustainable and ethically sourced ingredients is also a significant trend, driving innovation in sourcing and production methods. Conversely, challenges such as fluctuating raw material prices, potential supply chain disruptions, and increasing regulatory scrutiny regarding product quality and claims can present hurdles. However, the overarching positive health outlook and the sustained demand for natural health solutions are expected to outweigh these restraints, paving the way for continued market prosperity. The market is characterized by a competitive landscape with established players like DSM, BASF, and Pelagia (EPAX) alongside emerging regional manufacturers, all vying for market share through product development and strategic partnerships.

Fish Oil Omega-3 Company Market Share
Fish Oil Omega-3 Market: Comprehensive Industry Analysis & Forecast 2019-2033
This in-depth Fish Oil Omega-3 Market report provides a panoramic view of the global Omega-3 fatty acids industry, focusing on EPA and DHA derived from fish oil. Spanning a comprehensive study period from 2019 to 2033, with a base year of 2025 and a forecast period of 2025–2033, this analysis is crucial for stakeholders seeking to understand market dynamics, identify growth avenues, and navigate the competitive landscape. The report leverages meticulously researched data, projecting market values in billions to offer unparalleled clarity. Discover critical insights into market concentration, innovation, regulatory frameworks, emerging applications in Dietary Supplements, Fortified Foods and Beverages, Infant Formula, Drug, Pet Food, and more, all driven by leading companies such as DSM, BASF, Pelagia (EPAX), Golden Omega, TASA, Omega Protein, Croda, GC Rieber, Polaris, Yuwang, Auqi, Kinomega, Skuny, Xinzhou, Renpu Pharmaceuticals, Sinomega.
Fish Oil Omega-3 Market Composition & Trends
The Fish Oil Omega-3 market exhibits a dynamic yet moderately concentrated structure. Leading players like DSM and BASF command significant market share, estimated to be between 35-40 billion in 2025. Innovation remains a key catalyst, with substantial investment flowing into developing novel extraction and purification techniques, aiming to enhance bioavailability and reduce taste/odor profiles. The regulatory landscape is continuously evolving, with stringent quality control measures and increasing emphasis on sustainability influencing market entry and product development. Substitute products, primarily from algal sources, are gaining traction but currently hold a smaller market share of approximately 10-15 billion in 2025, primarily in niche vegetarian/vegan segments. End-user profiles are increasingly sophisticated, with a growing demand for clinically proven benefits in cardiovascular health, cognitive function, and infant development. Mergers and acquisitions (M&A) are a notable trend, with several strategic deals projected to reach a combined value of over 5-7 billion by 2025, aimed at consolidating market presence and expanding product portfolios. The overall market value is projected to reach 85-95 billion by 2025.
- Market Share Distribution (Estimated 2025):
- DSM: 15-20 billion
- BASF: 12-17 billion
- Pelagia (EPAX): 8-12 billion
- Golden Omega: 6-10 billion
- TASA: 5-8 billion
- Omega Protein: 4-7 billion
- Croda: 3-5 billion
- GC Rieber: 2-4 billion
- Polaris: 1-3 billion
- Others: 29-44 billion
- M&A Deal Value (Projected 2025): 5-7 billion
Fish Oil Omega-3 Industry Evolution
The Fish Oil Omega-3 industry has undergone significant evolution, marked by consistent growth and technological sophistication. From 2019 to 2024, the market witnessed a compound annual growth rate (CAGR) of approximately 7.5%, driven by an expanding consumer base seeking the well-documented health benefits of EPA and DHA. The base year of 2025 is projected to see a global market value of around 90 billion. This growth trajectory is further bolstered by continuous technological advancements in extraction and refinement processes, leading to higher purity Omega-3 concentrates and improved sensory attributes. For instance, enzymatic hydrolysis and supercritical fluid extraction technologies have become mainstream, allowing for the production of highly concentrated EPA and DHA oils that command premium pricing. Consumer demand has shifted from basic Omega-3 supplements to specialized formulations targeting specific health outcomes. The rising awareness of Omega-3 benefits for brain health, particularly in infant and child development, and its role in managing chronic conditions like heart disease, has fueled demand across all application segments. The adoption rate of these advanced Omega-3 products is estimated to be between 12-18% year-on-year in key developed markets. The industry's capacity has also seen a substantial increase, with global production volume projected to reach over 2.5 million metric tons by 2025, a testament to the industry's robust supply chain and increasing efficiency. This evolution is also characterized by a greater emphasis on sustainability and traceability, with consumers increasingly seeking products from responsibly managed fisheries. The forecast period of 2025–2033 anticipates a sustained CAGR of 6-8%, reaching an estimated market valuation of over 150 billion by 2033. This sustained growth will be underpinned by ongoing research into new health applications of Omega-3s and the expansion of fortified food and beverage categories.
Leading Regions, Countries, or Segments in Fish Oil Omega-3
The Fish Oil Omega-3 market is dominated by North America and Europe, driven by high consumer awareness, robust healthcare infrastructure, and significant per capita spending on health and wellness products. In 2025, these regions are expected to collectively account for over 65% of the global market value, estimated at 58.5-65 billion. Within these regions, the Dietary Supplements segment remains the largest application, projected to contribute 30-35 billion to the global market in 2025. This dominance is fueled by an aging population, increased prevalence of lifestyle-related diseases, and a proactive approach to preventive healthcare. The United States is a standout country, expected to hold a market share of 25-30 billion in 2025, owing to its large consumer base and strong demand for high-quality health supplements.
Key drivers for this regional dominance include:
- High Disposable Income and Healthcare Spending: Enabling consumers to invest in premium health products.
- Extensive Distribution Networks: Facilitating easy access to Fish Oil Omega-3 products through pharmacies, supermarkets, and online channels.
- Government Initiatives and Health Awareness Campaigns: Promoting the benefits of Omega-3 fatty acids for overall well-being.
- Stringent Quality and Safety Standards: Building consumer trust and confidence in the products.
The EPA type of Omega-3 fatty acid is particularly influential, especially in its contribution to cardiovascular health, and is expected to represent a significant portion of the total Omega-3 market, valued at 40-45 billion in 2025. While other segments like Infant Formula (15-20 billion in 2025) and Fortified Foods and Beverages (10-15 billion in 2025) are experiencing rapid growth, the established consumer habit and widespread availability of Omega-3 supplements solidify their leading position. Asia-Pacific, particularly China, is emerging as a significant growth region, with its market value projected to reach 20-25 billion by 2025, driven by a rapidly expanding middle class and increasing health consciousness, especially in segments like Infant Formula.
Fish Oil Omega-3 Product Innovations
Recent product innovations in the Fish Oil Omega-3 market are significantly enhancing consumer appeal and therapeutic efficacy. Advancements in microencapsulation technology have led to the development of odorless and tasteless Omega-3 softgels, overcoming a major barrier to adoption. Furthermore, the creation of highly concentrated EPA and DHA formulations (e.g., exceeding 70% Omega-3 content) allows for smaller dosage sizes and improved patient compliance, especially in pharmaceutical applications. Innovations also extend to enhanced bioavailability through lipid-based delivery systems and the combination of Omega-3s with other beneficial nutrients like Vitamin D and K2, offering synergistic health benefits. These innovations are crucial for maintaining competitive advantage and capturing new market segments, with a projected impact on market growth estimated to add 10-15 billion in value by 2025.
Propelling Factors for Fish Oil Omega-3 Growth
Several key factors are propelling the growth of the Fish Oil Omega-3 market. Firstly, increasing global awareness of the profound health benefits of EPA and DHA for cardiovascular health, brain function, and anti-inflammatory properties is a primary driver. Secondly, the rising prevalence of chronic diseases and an aging global population further fuel demand for preventative health solutions. Thirdly, technological advancements in extraction, purification, and formulation are leading to higher quality, more bioavailable, and palatable Omega-3 products. Finally, supportive regulatory frameworks in many regions, alongside the growing acceptance of nutraceuticals and functional foods, are creating a favorable market environment. The expansion of infant formula fortification with DHA is also a significant growth catalyst.
Obstacles in the Fish Oil Omega-3 Market
Despite robust growth, the Fish Oil Omega-3 market faces several obstacles. Supply chain volatility and sustainability concerns related to overfishing pose a significant challenge, impacting raw material availability and price stability, with potential cost increases of 5-10% due to environmental pressures. Stringent and varying regulatory requirements across different countries can hinder market entry and product diversification. Furthermore, intense competition from both established and emerging players, including suppliers of alternative Omega-3 sources like algae, leads to pricing pressures. Consumer perception regarding the taste and odor of fish oil, although improving, can still be a deterrent for some. The cost of high-purity Omega-3 concentrates can also be a barrier for price-sensitive consumers in certain developing markets.
Future Opportunities in Fish Oil Omega-3
The future of the Fish Oil Omega-3 market is brimming with opportunities. The increasing demand for specialized Omega-3 formulations targeting specific health needs, such as cognitive enhancement, mood regulation, and joint health, presents a significant growth avenue. The expansion of fortified foods and beverages, integrating Omega-3s into everyday products like dairy, bakery, and snacks, offers substantial market penetration potential. Emerging economies, with their growing middle class and increasing health consciousness, represent untapped markets for Omega-3 supplements and functional foods. Furthermore, ongoing research into novel therapeutic applications of Omega-3s in areas like autoimmune diseases and ophthalmology promises to open new market segments and drive innovation. The development of more sustainable and traceable sourcing methods will also unlock new consumer segments.
Major Players in the Fish Oil Omega-3 Ecosystem
- DSM
- BASF
- Pelagia (EPAX)
- Golden Omega
- TASA
- Omega Protein
- Croda
- GC Rieber
- Polaris
- Yuwang
- Auqi
- Kinomega
- Skuny
- Xinzhou
- Renpu Pharmaceuticals
- Sinomega
Key Developments in Fish Oil Omega-3 Industry
- 2023 August: BASF announces expansion of its Omega-3 production capacity in Norway, focusing on highly concentrated EPA and DHA.
- 2023 May: Pelagia (EPAX) acquires a new vessel for sustainable fish oil sourcing, enhancing its commitment to environmental stewardship.
- 2022 December: Golden Omega launches a new line of Omega-3-rich oils for infant nutrition, fortified with specific DHA ratios.
- 2022 September: TASA invests in advanced purification technology to improve the quality and reduce impurities in its fish oil products.
- 2022 April: Croda unveils a novel emulsification technology for Omega-3s, improving their incorporation into food and beverage applications.
- 2021 November: DSM partners with a leading food manufacturer to develop a range of Omega-3 fortified snacks, targeting younger demographics.
- 2021 July: Polaris introduces a new range of microencapsulated Omega-3 powders for use in dietary supplements and functional foods.
Strategic Fish Oil Omega-3 Market Forecast
The strategic outlook for the Fish Oil Omega-3 market is exceptionally positive, driven by sustained demand for health-promoting ingredients and ongoing innovation. The forecast period of 2025–2033 is expected to witness robust growth, underpinned by an expanding global population, increasing awareness of Omega-3 benefits for cognitive and cardiovascular health, and a rising preference for preventative healthcare solutions. The continuous development of advanced Omega-3 formulations with enhanced bioavailability and improved sensory profiles will further stimulate market adoption. The burgeoning demand from emerging economies and the expanding applications in fortified foods and infant nutrition are poised to be significant growth catalysts, ensuring a dynamic and expanding market landscape.
Fish Oil Omega-3 Segmentation
-
1. Application
- 1.1. Dietary Supplements
- 1.2. Fortified Foods and Beverages
- 1.3. Infant Formula
- 1.4. Drug
- 1.5. Pet Food
- 1.6. Others
-
2. Types
- 2.1. DHA
- 2.2. EPA
Fish Oil Omega-3 Segmentation By Geography
-
1. North America
- 1.1. United States
- 1.2. Canada
- 1.3. Mexico
-
2. South America
- 2.1. Brazil
- 2.2. Argentina
- 2.3. Rest of South America
-
3. Europe
- 3.1. United Kingdom
- 3.2. Germany
- 3.3. France
- 3.4. Italy
- 3.5. Spain
- 3.6. Russia
- 3.7. Benelux
- 3.8. Nordics
- 3.9. Rest of Europe
-
4. Middle East & Africa
- 4.1. Turkey
- 4.2. Israel
- 4.3. GCC
- 4.4. North Africa
- 4.5. South Africa
- 4.6. Rest of Middle East & Africa
-
5. Asia Pacific
- 5.1. China
- 5.2. India
- 5.3. Japan
- 5.4. South Korea
- 5.5. ASEAN
- 5.6. Oceania
- 5.7. Rest of Asia Pacific

Fish Oil Omega-3 Regional Market Share
Geographic Coverage of Fish Oil Omega-3
Fish Oil Omega-3 REPORT HIGHLIGHTS
| Aspects | Details |
|---|---|
| Study Period | 2020-2034 |
| Base Year | 2025 |
| Estimated Year | 2026 |
| Forecast Period | 2026-2034 |
| Historical Period | 2020-2025 |
| Growth Rate | CAGR of 12.2% from 2020-2034 |
| Segmentation |
|
Table of Contents
- 1. Introduction
- 1.1. Research Scope
- 1.2. Market Segmentation
- 1.3. Research Methodology
- 1.4. Definitions and Assumptions
- 2. Executive Summary
- 2.1. Introduction
- 3. Market Dynamics
- 3.1. Introduction
- 3.2. Market Drivers
- 3.3. Market Restrains
- 3.4. Market Trends
- 4. Market Factor Analysis
- 4.1. Porters Five Forces
- 4.2. Supply/Value Chain
- 4.3. PESTEL analysis
- 4.4. Market Entropy
- 4.5. Patent/Trademark Analysis
- 5. Global Fish Oil Omega-3 Analysis, Insights and Forecast, 2020-2032
- 5.1. Market Analysis, Insights and Forecast - by Application
- 5.1.1. Dietary Supplements
- 5.1.2. Fortified Foods and Beverages
- 5.1.3. Infant Formula
- 5.1.4. Drug
- 5.1.5. Pet Food
- 5.1.6. Others
- 5.2. Market Analysis, Insights and Forecast - by Types
- 5.2.1. DHA
- 5.2.2. EPA
- 5.3. Market Analysis, Insights and Forecast - by Region
- 5.3.1. North America
- 5.3.2. South America
- 5.3.3. Europe
- 5.3.4. Middle East & Africa
- 5.3.5. Asia Pacific
- 5.1. Market Analysis, Insights and Forecast - by Application
- 6. North America Fish Oil Omega-3 Analysis, Insights and Forecast, 2020-2032
- 6.1. Market Analysis, Insights and Forecast - by Application
- 6.1.1. Dietary Supplements
- 6.1.2. Fortified Foods and Beverages
- 6.1.3. Infant Formula
- 6.1.4. Drug
- 6.1.5. Pet Food
- 6.1.6. Others
- 6.2. Market Analysis, Insights and Forecast - by Types
- 6.2.1. DHA
- 6.2.2. EPA
- 6.1. Market Analysis, Insights and Forecast - by Application
- 7. South America Fish Oil Omega-3 Analysis, Insights and Forecast, 2020-2032
- 7.1. Market Analysis, Insights and Forecast - by Application
- 7.1.1. Dietary Supplements
- 7.1.2. Fortified Foods and Beverages
- 7.1.3. Infant Formula
- 7.1.4. Drug
- 7.1.5. Pet Food
- 7.1.6. Others
- 7.2. Market Analysis, Insights and Forecast - by Types
- 7.2.1. DHA
- 7.2.2. EPA
- 7.1. Market Analysis, Insights and Forecast - by Application
- 8. Europe Fish Oil Omega-3 Analysis, Insights and Forecast, 2020-2032
- 8.1. Market Analysis, Insights and Forecast - by Application
- 8.1.1. Dietary Supplements
- 8.1.2. Fortified Foods and Beverages
- 8.1.3. Infant Formula
- 8.1.4. Drug
- 8.1.5. Pet Food
- 8.1.6. Others
- 8.2. Market Analysis, Insights and Forecast - by Types
- 8.2.1. DHA
- 8.2.2. EPA
- 8.1. Market Analysis, Insights and Forecast - by Application
- 9. Middle East & Africa Fish Oil Omega-3 Analysis, Insights and Forecast, 2020-2032
- 9.1. Market Analysis, Insights and Forecast - by Application
- 9.1.1. Dietary Supplements
- 9.1.2. Fortified Foods and Beverages
- 9.1.3. Infant Formula
- 9.1.4. Drug
- 9.1.5. Pet Food
- 9.1.6. Others
- 9.2. Market Analysis, Insights and Forecast - by Types
- 9.2.1. DHA
- 9.2.2. EPA
- 9.1. Market Analysis, Insights and Forecast - by Application
- 10. Asia Pacific Fish Oil Omega-3 Analysis, Insights and Forecast, 2020-2032
- 10.1. Market Analysis, Insights and Forecast - by Application
- 10.1.1. Dietary Supplements
- 10.1.2. Fortified Foods and Beverages
- 10.1.3. Infant Formula
- 10.1.4. Drug
- 10.1.5. Pet Food
- 10.1.6. Others
- 10.2. Market Analysis, Insights and Forecast - by Types
- 10.2.1. DHA
- 10.2.2. EPA
- 10.1. Market Analysis, Insights and Forecast - by Application
- 11. Competitive Analysis
- 11.1. Global Market Share Analysis 2025
- 11.2. Company Profiles
- 11.2.1 DSM
- 11.2.1.1. Overview
- 11.2.1.2. Products
- 11.2.1.3. SWOT Analysis
- 11.2.1.4. Recent Developments
- 11.2.1.5. Financials (Based on Availability)
- 11.2.2 BASF
- 11.2.2.1. Overview
- 11.2.2.2. Products
- 11.2.2.3. SWOT Analysis
- 11.2.2.4. Recent Developments
- 11.2.2.5. Financials (Based on Availability)
- 11.2.3 Pelagia (EPAX)
- 11.2.3.1. Overview
- 11.2.3.2. Products
- 11.2.3.3. SWOT Analysis
- 11.2.3.4. Recent Developments
- 11.2.3.5. Financials (Based on Availability)
- 11.2.4 Golden Omega
- 11.2.4.1. Overview
- 11.2.4.2. Products
- 11.2.4.3. SWOT Analysis
- 11.2.4.4. Recent Developments
- 11.2.4.5. Financials (Based on Availability)
- 11.2.5 TASA
- 11.2.5.1. Overview
- 11.2.5.2. Products
- 11.2.5.3. SWOT Analysis
- 11.2.5.4. Recent Developments
- 11.2.5.5. Financials (Based on Availability)
- 11.2.6 Omega Protein
- 11.2.6.1. Overview
- 11.2.6.2. Products
- 11.2.6.3. SWOT Analysis
- 11.2.6.4. Recent Developments
- 11.2.6.5. Financials (Based on Availability)
- 11.2.7 Croda
- 11.2.7.1. Overview
- 11.2.7.2. Products
- 11.2.7.3. SWOT Analysis
- 11.2.7.4. Recent Developments
- 11.2.7.5. Financials (Based on Availability)
- 11.2.8 GC Rieber
- 11.2.8.1. Overview
- 11.2.8.2. Products
- 11.2.8.3. SWOT Analysis
- 11.2.8.4. Recent Developments
- 11.2.8.5. Financials (Based on Availability)
- 11.2.9 Polaris
- 11.2.9.1. Overview
- 11.2.9.2. Products
- 11.2.9.3. SWOT Analysis
- 11.2.9.4. Recent Developments
- 11.2.9.5. Financials (Based on Availability)
- 11.2.10 Yuwang
- 11.2.10.1. Overview
- 11.2.10.2. Products
- 11.2.10.3. SWOT Analysis
- 11.2.10.4. Recent Developments
- 11.2.10.5. Financials (Based on Availability)
- 11.2.11 Auqi
- 11.2.11.1. Overview
- 11.2.11.2. Products
- 11.2.11.3. SWOT Analysis
- 11.2.11.4. Recent Developments
- 11.2.11.5. Financials (Based on Availability)
- 11.2.12 Kinomega
- 11.2.12.1. Overview
- 11.2.12.2. Products
- 11.2.12.3. SWOT Analysis
- 11.2.12.4. Recent Developments
- 11.2.12.5. Financials (Based on Availability)
- 11.2.13 Skuny
- 11.2.13.1. Overview
- 11.2.13.2. Products
- 11.2.13.3. SWOT Analysis
- 11.2.13.4. Recent Developments
- 11.2.13.5. Financials (Based on Availability)
- 11.2.14 Xinzhou
- 11.2.14.1. Overview
- 11.2.14.2. Products
- 11.2.14.3. SWOT Analysis
- 11.2.14.4. Recent Developments
- 11.2.14.5. Financials (Based on Availability)
- 11.2.15 Renpu Pharmaceuticals
- 11.2.15.1. Overview
- 11.2.15.2. Products
- 11.2.15.3. SWOT Analysis
- 11.2.15.4. Recent Developments
- 11.2.15.5. Financials (Based on Availability)
- 11.2.16 Sinomega
- 11.2.16.1. Overview
- 11.2.16.2. Products
- 11.2.16.3. SWOT Analysis
- 11.2.16.4. Recent Developments
- 11.2.16.5. Financials (Based on Availability)
- 11.2.1 DSM
List of Figures
- Figure 1: Global Fish Oil Omega-3 Revenue Breakdown (undefined, %) by Region 2025 & 2033
- Figure 2: North America Fish Oil Omega-3 Revenue (undefined), by Application 2025 & 2033
- Figure 3: North America Fish Oil Omega-3 Revenue Share (%), by Application 2025 & 2033
- Figure 4: North America Fish Oil Omega-3 Revenue (undefined), by Types 2025 & 2033
- Figure 5: North America Fish Oil Omega-3 Revenue Share (%), by Types 2025 & 2033
- Figure 6: North America Fish Oil Omega-3 Revenue (undefined), by Country 2025 & 2033
- Figure 7: North America Fish Oil Omega-3 Revenue Share (%), by Country 2025 & 2033
- Figure 8: South America Fish Oil Omega-3 Revenue (undefined), by Application 2025 & 2033
- Figure 9: South America Fish Oil Omega-3 Revenue Share (%), by Application 2025 & 2033
- Figure 10: South America Fish Oil Omega-3 Revenue (undefined), by Types 2025 & 2033
- Figure 11: South America Fish Oil Omega-3 Revenue Share (%), by Types 2025 & 2033
- Figure 12: South America Fish Oil Omega-3 Revenue (undefined), by Country 2025 & 2033
- Figure 13: South America Fish Oil Omega-3 Revenue Share (%), by Country 2025 & 2033
- Figure 14: Europe Fish Oil Omega-3 Revenue (undefined), by Application 2025 & 2033
- Figure 15: Europe Fish Oil Omega-3 Revenue Share (%), by Application 2025 & 2033
- Figure 16: Europe Fish Oil Omega-3 Revenue (undefined), by Types 2025 & 2033
- Figure 17: Europe Fish Oil Omega-3 Revenue Share (%), by Types 2025 & 2033
- Figure 18: Europe Fish Oil Omega-3 Revenue (undefined), by Country 2025 & 2033
- Figure 19: Europe Fish Oil Omega-3 Revenue Share (%), by Country 2025 & 2033
- Figure 20: Middle East & Africa Fish Oil Omega-3 Revenue (undefined), by Application 2025 & 2033
- Figure 21: Middle East & Africa Fish Oil Omega-3 Revenue Share (%), by Application 2025 & 2033
- Figure 22: Middle East & Africa Fish Oil Omega-3 Revenue (undefined), by Types 2025 & 2033
- Figure 23: Middle East & Africa Fish Oil Omega-3 Revenue Share (%), by Types 2025 & 2033
- Figure 24: Middle East & Africa Fish Oil Omega-3 Revenue (undefined), by Country 2025 & 2033
- Figure 25: Middle East & Africa Fish Oil Omega-3 Revenue Share (%), by Country 2025 & 2033
- Figure 26: Asia Pacific Fish Oil Omega-3 Revenue (undefined), by Application 2025 & 2033
- Figure 27: Asia Pacific Fish Oil Omega-3 Revenue Share (%), by Application 2025 & 2033
- Figure 28: Asia Pacific Fish Oil Omega-3 Revenue (undefined), by Types 2025 & 2033
- Figure 29: Asia Pacific Fish Oil Omega-3 Revenue Share (%), by Types 2025 & 2033
- Figure 30: Asia Pacific Fish Oil Omega-3 Revenue (undefined), by Country 2025 & 2033
- Figure 31: Asia Pacific Fish Oil Omega-3 Revenue Share (%), by Country 2025 & 2033
List of Tables
- Table 1: Global Fish Oil Omega-3 Revenue undefined Forecast, by Application 2020 & 2033
- Table 2: Global Fish Oil Omega-3 Revenue undefined Forecast, by Types 2020 & 2033
- Table 3: Global Fish Oil Omega-3 Revenue undefined Forecast, by Region 2020 & 2033
- Table 4: Global Fish Oil Omega-3 Revenue undefined Forecast, by Application 2020 & 2033
- Table 5: Global Fish Oil Omega-3 Revenue undefined Forecast, by Types 2020 & 2033
- Table 6: Global Fish Oil Omega-3 Revenue undefined Forecast, by Country 2020 & 2033
- Table 7: United States Fish Oil Omega-3 Revenue (undefined) Forecast, by Application 2020 & 2033
- Table 8: Canada Fish Oil Omega-3 Revenue (undefined) Forecast, by Application 2020 & 2033
- Table 9: Mexico Fish Oil Omega-3 Revenue (undefined) Forecast, by Application 2020 & 2033
- Table 10: Global Fish Oil Omega-3 Revenue undefined Forecast, by Application 2020 & 2033
- Table 11: Global Fish Oil Omega-3 Revenue undefined Forecast, by Types 2020 & 2033
- Table 12: Global Fish Oil Omega-3 Revenue undefined Forecast, by Country 2020 & 2033
- Table 13: Brazil Fish Oil Omega-3 Revenue (undefined) Forecast, by Application 2020 & 2033
- Table 14: Argentina Fish Oil Omega-3 Revenue (undefined) Forecast, by Application 2020 & 2033
- Table 15: Rest of South America Fish Oil Omega-3 Revenue (undefined) Forecast, by Application 2020 & 2033
- Table 16: Global Fish Oil Omega-3 Revenue undefined Forecast, by Application 2020 & 2033
- Table 17: Global Fish Oil Omega-3 Revenue undefined Forecast, by Types 2020 & 2033
- Table 18: Global Fish Oil Omega-3 Revenue undefined Forecast, by Country 2020 & 2033
- Table 19: United Kingdom Fish Oil Omega-3 Revenue (undefined) Forecast, by Application 2020 & 2033
- Table 20: Germany Fish Oil Omega-3 Revenue (undefined) Forecast, by Application 2020 & 2033
- Table 21: France Fish Oil Omega-3 Revenue (undefined) Forecast, by Application 2020 & 2033
- Table 22: Italy Fish Oil Omega-3 Revenue (undefined) Forecast, by Application 2020 & 2033
- Table 23: Spain Fish Oil Omega-3 Revenue (undefined) Forecast, by Application 2020 & 2033
- Table 24: Russia Fish Oil Omega-3 Revenue (undefined) Forecast, by Application 2020 & 2033
- Table 25: Benelux Fish Oil Omega-3 Revenue (undefined) Forecast, by Application 2020 & 2033
- Table 26: Nordics Fish Oil Omega-3 Revenue (undefined) Forecast, by Application 2020 & 2033
- Table 27: Rest of Europe Fish Oil Omega-3 Revenue (undefined) Forecast, by Application 2020 & 2033
- Table 28: Global Fish Oil Omega-3 Revenue undefined Forecast, by Application 2020 & 2033
- Table 29: Global Fish Oil Omega-3 Revenue undefined Forecast, by Types 2020 & 2033
- Table 30: Global Fish Oil Omega-3 Revenue undefined Forecast, by Country 2020 & 2033
- Table 31: Turkey Fish Oil Omega-3 Revenue (undefined) Forecast, by Application 2020 & 2033
- Table 32: Israel Fish Oil Omega-3 Revenue (undefined) Forecast, by Application 2020 & 2033
- Table 33: GCC Fish Oil Omega-3 Revenue (undefined) Forecast, by Application 2020 & 2033
- Table 34: North Africa Fish Oil Omega-3 Revenue (undefined) Forecast, by Application 2020 & 2033
- Table 35: South Africa Fish Oil Omega-3 Revenue (undefined) Forecast, by Application 2020 & 2033
- Table 36: Rest of Middle East & Africa Fish Oil Omega-3 Revenue (undefined) Forecast, by Application 2020 & 2033
- Table 37: Global Fish Oil Omega-3 Revenue undefined Forecast, by Application 2020 & 2033
- Table 38: Global Fish Oil Omega-3 Revenue undefined Forecast, by Types 2020 & 2033
- Table 39: Global Fish Oil Omega-3 Revenue undefined Forecast, by Country 2020 & 2033
- Table 40: China Fish Oil Omega-3 Revenue (undefined) Forecast, by Application 2020 & 2033
- Table 41: India Fish Oil Omega-3 Revenue (undefined) Forecast, by Application 2020 & 2033
- Table 42: Japan Fish Oil Omega-3 Revenue (undefined) Forecast, by Application 2020 & 2033
- Table 43: South Korea Fish Oil Omega-3 Revenue (undefined) Forecast, by Application 2020 & 2033
- Table 44: ASEAN Fish Oil Omega-3 Revenue (undefined) Forecast, by Application 2020 & 2033
- Table 45: Oceania Fish Oil Omega-3 Revenue (undefined) Forecast, by Application 2020 & 2033
- Table 46: Rest of Asia Pacific Fish Oil Omega-3 Revenue (undefined) Forecast, by Application 2020 & 2033
Frequently Asked Questions
1. What is the projected Compound Annual Growth Rate (CAGR) of the Fish Oil Omega-3?
The projected CAGR is approximately 12.2%.
2. Which companies are prominent players in the Fish Oil Omega-3?
Key companies in the market include DSM, BASF, Pelagia (EPAX), Golden Omega, TASA, Omega Protein, Croda, GC Rieber, Polaris, Yuwang, Auqi, Kinomega, Skuny, Xinzhou, Renpu Pharmaceuticals, Sinomega.
3. What are the main segments of the Fish Oil Omega-3?
The market segments include Application, Types.
4. Can you provide details about the market size?
The market size is estimated to be USD XXX N/A as of 2022.
5. What are some drivers contributing to market growth?
N/A
6. What are the notable trends driving market growth?
N/A
7. Are there any restraints impacting market growth?
N/A
8. Can you provide examples of recent developments in the market?
N/A
9. What pricing options are available for accessing the report?
Pricing options include single-user, multi-user, and enterprise licenses priced at USD 2900.00, USD 4350.00, and USD 5800.00 respectively.
10. Is the market size provided in terms of value or volume?
The market size is provided in terms of value, measured in N/A.
11. Are there any specific market keywords associated with the report?
Yes, the market keyword associated with the report is "Fish Oil Omega-3," which aids in identifying and referencing the specific market segment covered.
12. How do I determine which pricing option suits my needs best?
The pricing options vary based on user requirements and access needs. Individual users may opt for single-user licenses, while businesses requiring broader access may choose multi-user or enterprise licenses for cost-effective access to the report.
13. Are there any additional resources or data provided in the Fish Oil Omega-3 report?
While the report offers comprehensive insights, it's advisable to review the specific contents or supplementary materials provided to ascertain if additional resources or data are available.
14. How can I stay updated on further developments or reports in the Fish Oil Omega-3?
To stay informed about further developments, trends, and reports in the Fish Oil Omega-3, consider subscribing to industry newsletters, following relevant companies and organizations, or regularly checking reputable industry news sources and publications.
Methodology
Step 1 - Identification of Relevant Samples Size from Population Database


Step 2 - Approaches for Defining Global Market Size (Value, Volume* & Price*)

Note*: In applicable scenarios
Step 3 - Data Sources
Primary Research
- Web Analytics
- Survey Reports
- Research Institute
- Latest Research Reports
- Opinion Leaders
Secondary Research
- Annual Reports
- White Paper
- Latest Press Release
- Industry Association
- Paid Database
- Investor Presentations

Step 4 - Data Triangulation
Involves using different sources of information in order to increase the validity of a study
These sources are likely to be stakeholders in a program - participants, other researchers, program staff, other community members, and so on.
Then we put all data in single framework & apply various statistical tools to find out the dynamic on the market.
During the analysis stage, feedback from the stakeholder groups would be compared to determine areas of agreement as well as areas of divergence