


Key Insights
The global DC Fast Charging Pile market is poised for significant expansion, driven by the accelerating adoption of electric vehicles (EVs) and supportive government initiatives worldwide. With an estimated market size of around USD 15 billion in 2025, the sector is projected to experience a robust Compound Annual Growth Rate (CAGR) of approximately 25% during the forecast period of 2025-2033. This rapid growth is fundamentally underpinned by the increasing demand for convenient and rapid charging solutions that address range anxiety and reduce charging times. Key applications within this market include residential districts, car parks, and business districts, reflecting the integration of charging infrastructure into daily life and commercial spaces. The proliferation of high-power charging stations, particularly the 180 KW segment and above, is crucial for accommodating the growing battery capacities of modern EVs and enabling faster refueling, thereby facilitating wider EV adoption.
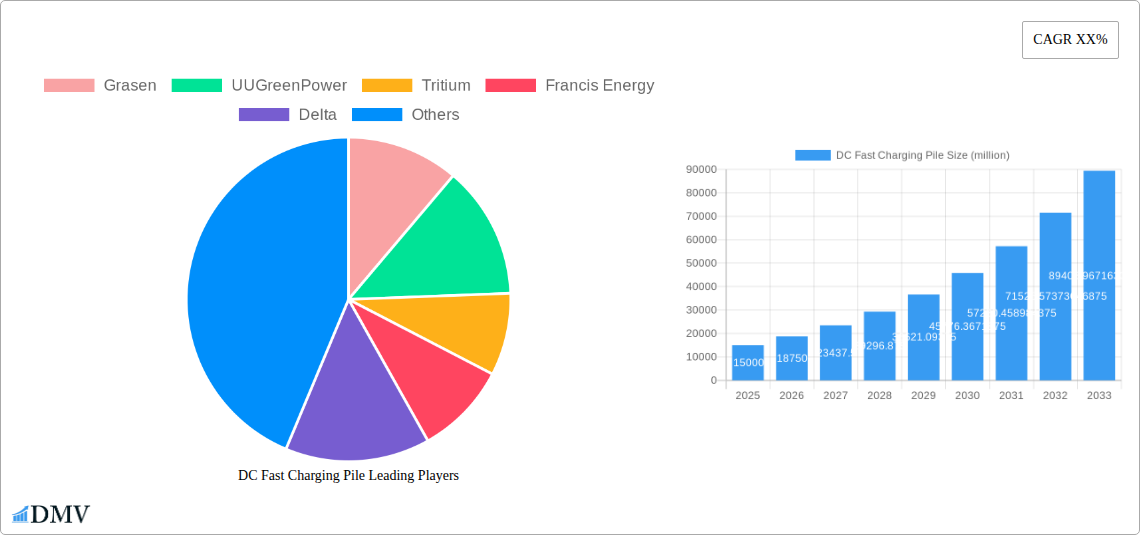
DC Fast Charging Pile Market Size (In Billion)

Several factors are propelling this market forward. Government incentives, such as subsidies for charging infrastructure installation and favorable EV tax policies, are playing a pivotal role in stimulating investment and deployment. Furthermore, technological advancements in battery technology and charging efficiency are contributing to the development of more sophisticated and reliable DC fast chargers. The market also benefits from the increasing awareness and demand for sustainable transportation solutions. However, challenges such as high initial installation costs, the need for grid upgrades to support increased electricity demand, and standardization issues across different charging protocols can pose restraints. Despite these hurdles, the overwhelming trend towards electrification, coupled with strategic investments from key players like Grasen, UUGreenPower, and Tritium, positions the DC Fast Charging Pile market for sustained and dynamic growth across major regions, with North America, Europe, and Asia Pacific anticipated to lead the charge.
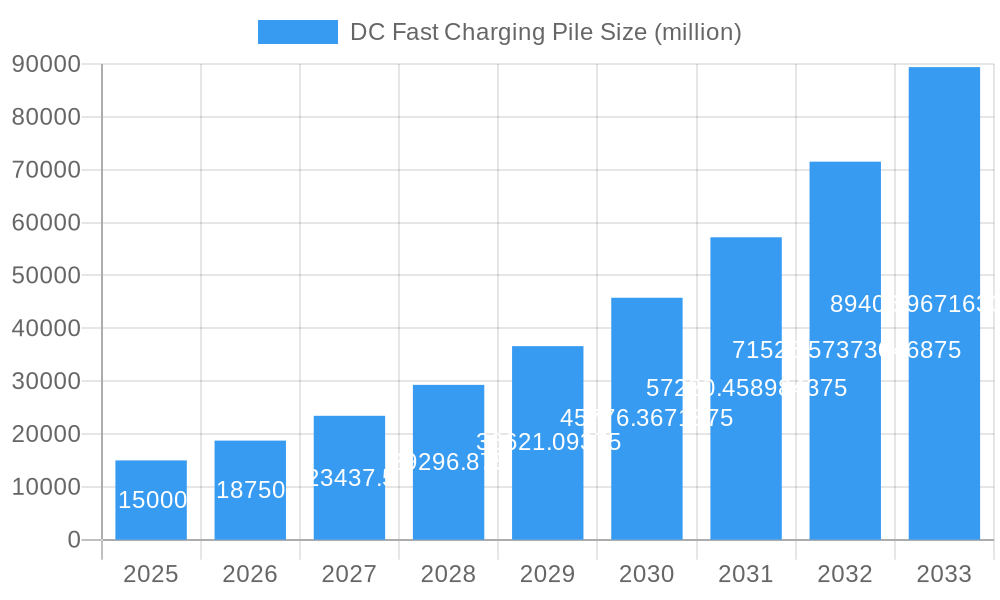
DC Fast Charging Pile Company Market Share
Unlocking the Future of Electric Mobility: A Comprehensive Report on the DC Fast Charging Pile Market
This in-depth market research report provides an unparalleled analysis of the global DC Fast Charging Pile market, forecasting its trajectory from 2019 to 2033, with a focus on the Base Year 2025 and a robust Forecast Period of 2025–2033. Delve into the intricate dynamics shaping this rapidly evolving sector, crucial for electric vehicle (EV) infrastructure, charging solutions, and the broader sustainable transportation ecosystem. This report is essential for stakeholders seeking to understand market drivers, technological advancements, competitive landscapes, and future growth opportunities within the DC fast charging industry.
DC Fast Charging Pile Market Composition & Trends
The DC Fast Charging Pile market is characterized by a dynamic and evolving composition, driven by increasing EV adoption and supportive government policies. Market concentration is currently moderate, with a significant presence of both established players and emerging innovators. Key innovation catalysts include advancements in charging speed, smart grid integration, and enhanced user experience. The regulatory landscape is continuously evolving, with many governments implementing mandates and incentives to accelerate the deployment of EV charging infrastructure. Substitute products, such as Level 2 charging solutions and battery swapping technologies, present a degree of competition, though DC fast charging remains the preferred option for rapid replenishment. End-user profiles are diverse, encompassing individual EV owners, fleet operators, commercial businesses, and public utility companies. Mergers and acquisitions (M&A) are playing a pivotal role in consolidating the market and fostering strategic alliances. For instance, M&A deal values are projected to reach billions of dollars over the forecast period, as companies seek to expand their market share and technological capabilities. Market share distribution among leading players is dynamic, reflecting ongoing investments and product innovations.
DC Fast Charging Pile Industry Evolution
The DC Fast Charging Pile industry has undergone a remarkable evolution, transforming from a nascent sector to a critical component of global sustainable transportation. Over the Historical Period (2019–2024), the market witnessed steady growth driven by early EV adoption and pilot programs. The Study Period (2019–2033) captures this entire transformative journey. In the Base Year (2025), the industry stands at a pivotal point, poised for accelerated expansion. This growth trajectory is underpinned by continuous technological advancements, pushing the boundaries of charging speed and efficiency. Innovations in power electronics, battery management systems, and grid integration technologies are constantly redefining the capabilities of DC fast chargers. Consumer demand is shifting rapidly, with a growing preference for longer EV range and convenient, readily available charging solutions. The increasing awareness of environmental concerns and government mandates promoting zero-emission vehicles are powerful forces driving this shift. Adoption metrics for DC fast charging stations are expected to see a significant surge, with the number of installed units projected to grow at a compound annual growth rate (CAGR) of over XX% during the Forecast Period (2025–2033). This expansion is crucial for alleviating range anxiety and facilitating the widespread adoption of electric vehicles, thereby contributing to a cleaner and more sustainable future.
Leading Regions, Countries, or Segments in DC Fast Charging Pile
The dominance within the DC Fast Charging Pile market is influenced by a confluence of factors, with certain regions, countries, and application segments emerging as key growth hubs.
Dominant Regions and Countries:
- North America: Led by the United States and Canada, this region benefits from strong government incentives, substantial EV sales, and significant investments from both private entities and utilities. Key drivers include federal tax credits for EV chargers and ambitious state-level targets for EV infrastructure deployment.
- Europe: Countries such as Germany, Norway, the UK, and France are at the forefront, propelled by stringent emissions regulations, widespread consumer adoption of EVs, and robust funding initiatives for charging networks. The European Union's commitment to a green transition strongly supports the expansion of DC fast charging.
- Asia-Pacific: China stands out as the world's largest EV market, naturally leading in DC fast charging pile installations. Supportive government policies, extensive manufacturing capabilities, and a rapidly growing urban population drive this dominance. Other countries like South Korea and Japan are also making significant strides.
Dominant Application Segments:
- Service Area: Strategically located along major highways and interstates, service area DC fast charging stations are critical for long-distance EV travel. These locations offer high utilization rates and are crucial for building a comprehensive charging network. Investment trends here focus on high-power, ultra-fast charging solutions.
- Car Park: Public and private car parks in urban centers, shopping malls, and workplaces are increasingly integrating DC fast charging piles. This segment caters to the daily charging needs of EV owners and businesses, offering convenience and supporting EV adoption in densely populated areas. Regulatory support for business district charging integration is a key driver.
- Residential District: While Level 2 charging is more common for overnight charging in residential districts, the inclusion of DC fast charging piles in multi-unit dwellings and shared community charging hubs is gaining traction for residents who lack dedicated home charging solutions.
Dominant Types:
- 180 KW: The 180 KW DC fast charging pile is becoming a de facto standard for many new installations, offering a balance of rapid charging times and manageable grid impact. This power level effectively reduces charging times for most EVs, catering to both private and commercial use.
- Other (Higher Power): With advancements in battery technology and grid infrastructure, ultra-fast DC charging piles exceeding 180 KW (e.g., 350 KW and higher) are emerging as a critical product innovation for specialized applications and future-proofing charging networks. These are crucial for high-utilization locations like commercial fleets and public transit hubs.
DC Fast Charging Pile Product Innovations
Product innovation in the DC Fast Charging Pile market is primarily focused on enhancing charging speed, efficiency, and user experience. Advancements in power electronics, such as Gallium Nitride (GaN) and Silicon Carbide (SiC) technologies, are enabling smaller, more efficient, and higher-power charging solutions. Smart charging capabilities, including load balancing, grid integration, and demand-response functionalities, are becoming standard features, optimizing energy usage and reducing operational costs. The integration of plug-and-charge technology simplifies the charging process for users, eliminating the need for multiple apps or cards. Performance metrics such as charging speed (e.g., adding 200 miles of range in under 30 minutes), operational uptime, and energy efficiency are key areas of continuous improvement. Unique selling propositions often revolve around modular designs for scalability, advanced thermal management systems for longevity, and robust cybersecurity features to protect user data and operational integrity.
Propelling Factors for DC Fast Charging Pile Growth
The growth of the DC Fast Charging Pile market is propelled by a confluence of powerful factors. Technological advancements in battery technology and power electronics are enabling faster charging speeds and greater efficiency. The economic imperative of reducing reliance on fossil fuels and the falling costs of EVs are driving adoption. Crucially, regulatory influences, including government mandates for EV sales, subsidies for charging infrastructure, and ambitious climate change targets, are creating a favorable environment for market expansion. For instance, the US government's infrastructure bill allocates billions of dollars to build a national EV charging network.
Obstacles in the DC Fast Charging Pile Market
Despite robust growth, the DC Fast Charging Pile market faces several obstacles. Regulatory challenges can arise from complex permitting processes, varying standards across regions, and grid interconnection hurdles. Supply chain disruptions, as seen in recent years, can impact the availability of critical components and lead to increased costs. Furthermore, competitive pressures from established players and new entrants can lead to pricing wars and necessitate significant investment in R&D and market penetration. The initial high cost of DC fast charging infrastructure installation also remains a barrier for some operators and municipalities.
Future Opportunities in DC Fast Charging Pile
Emerging opportunities in the DC Fast Charging Pile market are vast and promising. The expansion of the electric vehicle fleet, particularly in commercial sectors like logistics and ride-sharing, presents a significant demand for reliable DC fast charging solutions. The integration of smart grid technologies and vehicle-to-grid (V2G) capabilities offers opportunities for revenue generation and grid stabilization. New markets in developing economies are opening up as EV adoption gains momentum. Furthermore, advancements in wireless charging technology could revolutionize the convenience of EV charging, though wired DC fast charging will remain dominant for speed and power delivery in the near to mid-term.
Major Players in the DC Fast Charging Pile Ecosystem
- Grasen
- UUGreenPower
- Tritium
- Francis Energy
- Delta
- Anaheim(AE)
- Sicon Chat Union Electric Co.
- Newyea Group
- ELECTWAY Charger
- MOREDAY
- Fiver New Energy Technology Co.,ltd
- EN
- SUC
- Sinexcel
- Guangxi Angsheng Energy Saving Technology
- Boguang Electric Technology
- Zhejiang Benyi Electric
- Guangdong Gongshi Intelligent Technology
Key Developments in DC Fast Charging Pile Industry
- 2023 Q4: Tritium partners with an Australian energy company to deploy XXX DC fast charging stations across key travel corridors, aiming to expand the national EV charging network.
- 2024 Q1: Delta Electronics unveils its new generation of XXX KW DC fast chargers with enhanced cybersecurity features and improved energy efficiency, targeting commercial fleet operators.
- 2024 Q2: Francis Energy announces a strategic investment of XXX million to build a network of XXX DC fast charging piles in underserved rural areas of the United States, enhancing accessibility for EV drivers.
- 2024 Q3: Grasen launches a modular XXX KW DC fast charging solution designed for scalability and easy upgrades, catering to the evolving needs of charging infrastructure providers.
- 2024 Q4: The European Union announces new regulations promoting interoperability standards for DC fast charging infrastructure, aiming to simplify cross-border EV charging and boost consumer confidence.
Strategic DC Fast Charging Pile Market Forecast
The DC Fast Charging Pile market is poised for substantial growth, driven by escalating EV adoption, supportive government policies, and continuous technological innovation. The increasing demand for rapid and convenient charging solutions will fuel investments across residential districts, car parks, business districts, and service areas. Higher power chargers, such as the 180 KW and beyond, will become increasingly prevalent. Strategic partnerships and M&A activities will continue to shape the competitive landscape, leading to greater market consolidation and technological advancements. The global shift towards decarbonization and sustainable transportation ensures a bright future for DC fast charging infrastructure, making it a critical enabler of the electric mobility revolution.
DC Fast Charging Pile Segmentation
-
1. Application
- 1.1. Residential District
- 1.2. Car Park
- 1.3. Business District
- 1.4. Service Area
- 1.5. Other
-
2. Types
- 2.1. 50 KW
- 2.2. 180 KW
- 2.3. Other
DC Fast Charging Pile Segmentation By Geography
-
1. North America
- 1.1. United States
- 1.2. Canada
- 1.3. Mexico
-
2. South America
- 2.1. Brazil
- 2.2. Argentina
- 2.3. Rest of South America
-
3. Europe
- 3.1. United Kingdom
- 3.2. Germany
- 3.3. France
- 3.4. Italy
- 3.5. Spain
- 3.6. Russia
- 3.7. Benelux
- 3.8. Nordics
- 3.9. Rest of Europe
-
4. Middle East & Africa
- 4.1. Turkey
- 4.2. Israel
- 4.3. GCC
- 4.4. North Africa
- 4.5. South Africa
- 4.6. Rest of Middle East & Africa
-
5. Asia Pacific
- 5.1. China
- 5.2. India
- 5.3. Japan
- 5.4. South Korea
- 5.5. ASEAN
- 5.6. Oceania
- 5.7. Rest of Asia Pacific
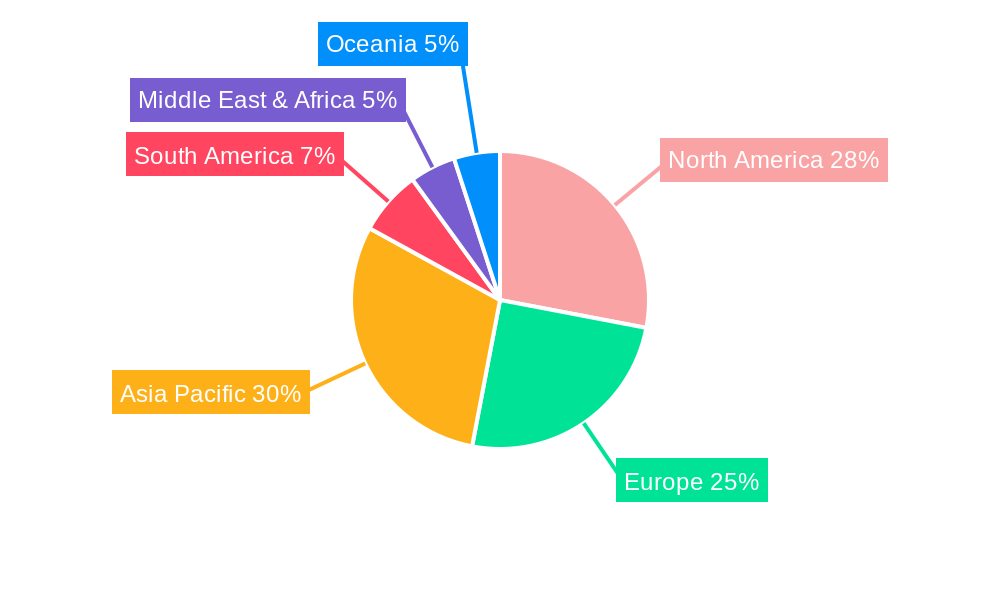
DC Fast Charging Pile Regional Market Share
Geographic Coverage of DC Fast Charging Pile
DC Fast Charging Pile REPORT HIGHLIGHTS
| Aspects | Details |
|---|---|
| Study Period | 2020-2034 |
| Base Year | 2025 |
| Estimated Year | 2026 |
| Forecast Period | 2026-2034 |
| Historical Period | 2020-2025 |
| Growth Rate | CAGR of 6.17% from 2020-2034 |
| Segmentation |
|
Table of Contents
- 1. Introduction
- 1.1. Research Scope
- 1.2. Market Segmentation
- 1.3. Research Objective
- 1.4. Definitions and Assumptions
- 2. Executive Summary
- 2.1. Market Snapshot
- 3. Market Dynamics
- 3.1. Market Drivers
- 3.2. Market Restrains
- 3.3. Market Trends
- 3.4. Market Opportunities
- 4. Market Factor Analysis
- 4.1. Porters Five Forces
- 4.1.1. Bargaining Power of Suppliers
- 4.1.2. Bargaining Power of Buyers
- 4.1.3. Threat of New Entrants
- 4.1.4. Threat of Substitutes
- 4.1.5. Competitive Rivalry
- 4.2. PESTEL analysis
- 4.3. BCG Analysis
- 4.3.1. Stars (High Growth, High Market Share)
- 4.3.2. Cash Cows (Low Growth, High Market Share)
- 4.3.3. Question Mark (High Growth, Low Market Share)
- 4.3.4. Dogs (Low Growth, Low Market Share)
- 4.4. Ansoff Matrix Analysis
- 4.5. Supply Chain Analysis
- 4.6. Regulatory Landscape
- 4.7. Current Market Potential and Opportunity Assessment (TAM–SAM–SOM Framework)
- 4.8. DMV Analyst Note
- 4.1. Porters Five Forces
- 5. Market Analysis, Insights and Forecast 2021-2033
- 5.1. Market Analysis, Insights and Forecast - by Application
- 5.1.1. Residential District
- 5.1.2. Car Park
- 5.1.3. Business District
- 5.1.4. Service Area
- 5.1.5. Other
- 5.2. Market Analysis, Insights and Forecast - by Types
- 5.2.1. 50 KW
- 5.2.2. 180 KW
- 5.2.3. Other
- 5.3. Market Analysis, Insights and Forecast - by Region
- 5.3.1. North America
- 5.3.2. South America
- 5.3.3. Europe
- 5.3.4. Middle East & Africa
- 5.3.5. Asia Pacific
- 5.1. Market Analysis, Insights and Forecast - by Application
- 6. Global DC Fast Charging Pile Analysis, Insights and Forecast, 2021-2033
- 6.1. Market Analysis, Insights and Forecast - by Application
- 6.1.1. Residential District
- 6.1.2. Car Park
- 6.1.3. Business District
- 6.1.4. Service Area
- 6.1.5. Other
- 6.2. Market Analysis, Insights and Forecast - by Types
- 6.2.1. 50 KW
- 6.2.2. 180 KW
- 6.2.3. Other
- 6.1. Market Analysis, Insights and Forecast - by Application
- 7. North America DC Fast Charging Pile Analysis, Insights and Forecast, 2020-2032
- 7.1. Market Analysis, Insights and Forecast - by Application
- 7.1.1. Residential District
- 7.1.2. Car Park
- 7.1.3. Business District
- 7.1.4. Service Area
- 7.1.5. Other
- 7.2. Market Analysis, Insights and Forecast - by Types
- 7.2.1. 50 KW
- 7.2.2. 180 KW
- 7.2.3. Other
- 7.1. Market Analysis, Insights and Forecast - by Application
- 8. South America DC Fast Charging Pile Analysis, Insights and Forecast, 2020-2032
- 8.1. Market Analysis, Insights and Forecast - by Application
- 8.1.1. Residential District
- 8.1.2. Car Park
- 8.1.3. Business District
- 8.1.4. Service Area
- 8.1.5. Other
- 8.2. Market Analysis, Insights and Forecast - by Types
- 8.2.1. 50 KW
- 8.2.2. 180 KW
- 8.2.3. Other
- 8.1. Market Analysis, Insights and Forecast - by Application
- 9. Europe DC Fast Charging Pile Analysis, Insights and Forecast, 2020-2032
- 9.1. Market Analysis, Insights and Forecast - by Application
- 9.1.1. Residential District
- 9.1.2. Car Park
- 9.1.3. Business District
- 9.1.4. Service Area
- 9.1.5. Other
- 9.2. Market Analysis, Insights and Forecast - by Types
- 9.2.1. 50 KW
- 9.2.2. 180 KW
- 9.2.3. Other
- 9.1. Market Analysis, Insights and Forecast - by Application
- 10. Middle East & Africa DC Fast Charging Pile Analysis, Insights and Forecast, 2020-2032
- 10.1. Market Analysis, Insights and Forecast - by Application
- 10.1.1. Residential District
- 10.1.2. Car Park
- 10.1.3. Business District
- 10.1.4. Service Area
- 10.1.5. Other
- 10.2. Market Analysis, Insights and Forecast - by Types
- 10.2.1. 50 KW
- 10.2.2. 180 KW
- 10.2.3. Other
- 10.1. Market Analysis, Insights and Forecast - by Application
- 11. Asia Pacific DC Fast Charging Pile Analysis, Insights and Forecast, 2020-2032
- 11.1. Market Analysis, Insights and Forecast - by Application
- 11.1.1. Residential District
- 11.1.2. Car Park
- 11.1.3. Business District
- 11.1.4. Service Area
- 11.1.5. Other
- 11.2. Market Analysis, Insights and Forecast - by Types
- 11.2.1. 50 KW
- 11.2.2. 180 KW
- 11.2.3. Other
- 11.1. Market Analysis, Insights and Forecast - by Application
- 12. Competitive Analysis
- 12.1. Company Profiles
- 12.1.1 Grasen
- 12.1.1.1. Company Overview
- 12.1.1.2. Products
- 12.1.1.3. Company Financials
- 12.1.1.4. SWOT Analysis
- 12.1.2 UUGreenPower
- 12.1.2.1. Company Overview
- 12.1.2.2. Products
- 12.1.2.3. Company Financials
- 12.1.2.4. SWOT Analysis
- 12.1.3 Tritium
- 12.1.3.1. Company Overview
- 12.1.3.2. Products
- 12.1.3.3. Company Financials
- 12.1.3.4. SWOT Analysis
- 12.1.4 Francis Energy
- 12.1.4.1. Company Overview
- 12.1.4.2. Products
- 12.1.4.3. Company Financials
- 12.1.4.4. SWOT Analysis
- 12.1.5 Delta
- 12.1.5.1. Company Overview
- 12.1.5.2. Products
- 12.1.5.3. Company Financials
- 12.1.5.4. SWOT Analysis
- 12.1.6 Anaheim(AE)
- 12.1.6.1. Company Overview
- 12.1.6.2. Products
- 12.1.6.3. Company Financials
- 12.1.6.4. SWOT Analysis
- 12.1.7 Sicon Chat Union Electric Co.
- 12.1.7.1. Company Overview
- 12.1.7.2. Products
- 12.1.7.3. Company Financials
- 12.1.7.4. SWOT Analysis
- 12.1.8 Newyea Group
- 12.1.8.1. Company Overview
- 12.1.8.2. Products
- 12.1.8.3. Company Financials
- 12.1.8.4. SWOT Analysis
- 12.1.9 ELECTWAY Charger
- 12.1.9.1. Company Overview
- 12.1.9.2. Products
- 12.1.9.3. Company Financials
- 12.1.9.4. SWOT Analysis
- 12.1.10 MOREDAY
- 12.1.10.1. Company Overview
- 12.1.10.2. Products
- 12.1.10.3. Company Financials
- 12.1.10.4. SWOT Analysis
- 12.1.11 Fiver New Energy Technology Co.
- 12.1.11.1. Company Overview
- 12.1.11.2. Products
- 12.1.11.3. Company Financials
- 12.1.11.4. SWOT Analysis
- 12.1.12 ltd
- 12.1.12.1. Company Overview
- 12.1.12.2. Products
- 12.1.12.3. Company Financials
- 12.1.12.4. SWOT Analysis
- 12.1.13 EN
- 12.1.13.1. Company Overview
- 12.1.13.2. Products
- 12.1.13.3. Company Financials
- 12.1.13.4. SWOT Analysis
- 12.1.14 SUC
- 12.1.14.1. Company Overview
- 12.1.14.2. Products
- 12.1.14.3. Company Financials
- 12.1.14.4. SWOT Analysis
- 12.1.15 Sinexcel
- 12.1.15.1. Company Overview
- 12.1.15.2. Products
- 12.1.15.3. Company Financials
- 12.1.15.4. SWOT Analysis
- 12.1.16 Guangxi Angsheng Energy Saving Technology
- 12.1.16.1. Company Overview
- 12.1.16.2. Products
- 12.1.16.3. Company Financials
- 12.1.16.4. SWOT Analysis
- 12.1.17 Boguang Electric Technology
- 12.1.17.1. Company Overview
- 12.1.17.2. Products
- 12.1.17.3. Company Financials
- 12.1.17.4. SWOT Analysis
- 12.1.18 Zhejiang Benyi Electric
- 12.1.18.1. Company Overview
- 12.1.18.2. Products
- 12.1.18.3. Company Financials
- 12.1.18.4. SWOT Analysis
- 12.1.19 Guangdong Gongshi Intelligent Technology
- 12.1.19.1. Company Overview
- 12.1.19.2. Products
- 12.1.19.3. Company Financials
- 12.1.19.4. SWOT Analysis
- 12.1.1 Grasen
- 12.2. Market Entropy
- 12.2.1 Company's Key Areas Served
- 12.2.2 Recent Developments
- 12.3. Company Market Share Analysis 2025
- 12.3.1 Top 5 Companies Market Share Analysis
- 12.3.2 Top 3 Companies Market Share Analysis
- 12.4. List of Potential Customers
- 13. Research Methodology
List of Figures
- Figure 1: Global DC Fast Charging Pile Revenue Breakdown (billion, %) by Region 2025 & 2033
- Figure 2: North America DC Fast Charging Pile Revenue (billion), by Application 2025 & 2033
- Figure 3: North America DC Fast Charging Pile Revenue Share (%), by Application 2025 & 2033
- Figure 4: North America DC Fast Charging Pile Revenue (billion), by Types 2025 & 2033
- Figure 5: North America DC Fast Charging Pile Revenue Share (%), by Types 2025 & 2033
- Figure 6: North America DC Fast Charging Pile Revenue (billion), by Country 2025 & 2033
- Figure 7: North America DC Fast Charging Pile Revenue Share (%), by Country 2025 & 2033
- Figure 8: South America DC Fast Charging Pile Revenue (billion), by Application 2025 & 2033
- Figure 9: South America DC Fast Charging Pile Revenue Share (%), by Application 2025 & 2033
- Figure 10: South America DC Fast Charging Pile Revenue (billion), by Types 2025 & 2033
- Figure 11: South America DC Fast Charging Pile Revenue Share (%), by Types 2025 & 2033
- Figure 12: South America DC Fast Charging Pile Revenue (billion), by Country 2025 & 2033
- Figure 13: South America DC Fast Charging Pile Revenue Share (%), by Country 2025 & 2033
- Figure 14: Europe DC Fast Charging Pile Revenue (billion), by Application 2025 & 2033
- Figure 15: Europe DC Fast Charging Pile Revenue Share (%), by Application 2025 & 2033
- Figure 16: Europe DC Fast Charging Pile Revenue (billion), by Types 2025 & 2033
- Figure 17: Europe DC Fast Charging Pile Revenue Share (%), by Types 2025 & 2033
- Figure 18: Europe DC Fast Charging Pile Revenue (billion), by Country 2025 & 2033
- Figure 19: Europe DC Fast Charging Pile Revenue Share (%), by Country 2025 & 2033
- Figure 20: Middle East & Africa DC Fast Charging Pile Revenue (billion), by Application 2025 & 2033
- Figure 21: Middle East & Africa DC Fast Charging Pile Revenue Share (%), by Application 2025 & 2033
- Figure 22: Middle East & Africa DC Fast Charging Pile Revenue (billion), by Types 2025 & 2033
- Figure 23: Middle East & Africa DC Fast Charging Pile Revenue Share (%), by Types 2025 & 2033
- Figure 24: Middle East & Africa DC Fast Charging Pile Revenue (billion), by Country 2025 & 2033
- Figure 25: Middle East & Africa DC Fast Charging Pile Revenue Share (%), by Country 2025 & 2033
- Figure 26: Asia Pacific DC Fast Charging Pile Revenue (billion), by Application 2025 & 2033
- Figure 27: Asia Pacific DC Fast Charging Pile Revenue Share (%), by Application 2025 & 2033
- Figure 28: Asia Pacific DC Fast Charging Pile Revenue (billion), by Types 2025 & 2033
- Figure 29: Asia Pacific DC Fast Charging Pile Revenue Share (%), by Types 2025 & 2033
- Figure 30: Asia Pacific DC Fast Charging Pile Revenue (billion), by Country 2025 & 2033
- Figure 31: Asia Pacific DC Fast Charging Pile Revenue Share (%), by Country 2025 & 2033
List of Tables
- Table 1: Global DC Fast Charging Pile Revenue billion Forecast, by Application 2020 & 2033
- Table 2: Global DC Fast Charging Pile Revenue billion Forecast, by Types 2020 & 2033
- Table 3: Global DC Fast Charging Pile Revenue billion Forecast, by Region 2020 & 2033
- Table 4: Global DC Fast Charging Pile Revenue billion Forecast, by Application 2020 & 2033
- Table 5: Global DC Fast Charging Pile Revenue billion Forecast, by Types 2020 & 2033
- Table 6: Global DC Fast Charging Pile Revenue billion Forecast, by Country 2020 & 2033
- Table 7: United States DC Fast Charging Pile Revenue (billion) Forecast, by Application 2020 & 2033
- Table 8: Canada DC Fast Charging Pile Revenue (billion) Forecast, by Application 2020 & 2033
- Table 9: Mexico DC Fast Charging Pile Revenue (billion) Forecast, by Application 2020 & 2033
- Table 10: Global DC Fast Charging Pile Revenue billion Forecast, by Application 2020 & 2033
- Table 11: Global DC Fast Charging Pile Revenue billion Forecast, by Types 2020 & 2033
- Table 12: Global DC Fast Charging Pile Revenue billion Forecast, by Country 2020 & 2033
- Table 13: Brazil DC Fast Charging Pile Revenue (billion) Forecast, by Application 2020 & 2033
- Table 14: Argentina DC Fast Charging Pile Revenue (billion) Forecast, by Application 2020 & 2033
- Table 15: Rest of South America DC Fast Charging Pile Revenue (billion) Forecast, by Application 2020 & 2033
- Table 16: Global DC Fast Charging Pile Revenue billion Forecast, by Application 2020 & 2033
- Table 17: Global DC Fast Charging Pile Revenue billion Forecast, by Types 2020 & 2033
- Table 18: Global DC Fast Charging Pile Revenue billion Forecast, by Country 2020 & 2033
- Table 19: United Kingdom DC Fast Charging Pile Revenue (billion) Forecast, by Application 2020 & 2033
- Table 20: Germany DC Fast Charging Pile Revenue (billion) Forecast, by Application 2020 & 2033
- Table 21: France DC Fast Charging Pile Revenue (billion) Forecast, by Application 2020 & 2033
- Table 22: Italy DC Fast Charging Pile Revenue (billion) Forecast, by Application 2020 & 2033
- Table 23: Spain DC Fast Charging Pile Revenue (billion) Forecast, by Application 2020 & 2033
- Table 24: Russia DC Fast Charging Pile Revenue (billion) Forecast, by Application 2020 & 2033
- Table 25: Benelux DC Fast Charging Pile Revenue (billion) Forecast, by Application 2020 & 2033
- Table 26: Nordics DC Fast Charging Pile Revenue (billion) Forecast, by Application 2020 & 2033
- Table 27: Rest of Europe DC Fast Charging Pile Revenue (billion) Forecast, by Application 2020 & 2033
- Table 28: Global DC Fast Charging Pile Revenue billion Forecast, by Application 2020 & 2033
- Table 29: Global DC Fast Charging Pile Revenue billion Forecast, by Types 2020 & 2033
- Table 30: Global DC Fast Charging Pile Revenue billion Forecast, by Country 2020 & 2033
- Table 31: Turkey DC Fast Charging Pile Revenue (billion) Forecast, by Application 2020 & 2033
- Table 32: Israel DC Fast Charging Pile Revenue (billion) Forecast, by Application 2020 & 2033
- Table 33: GCC DC Fast Charging Pile Revenue (billion) Forecast, by Application 2020 & 2033
- Table 34: North Africa DC Fast Charging Pile Revenue (billion) Forecast, by Application 2020 & 2033
- Table 35: South Africa DC Fast Charging Pile Revenue (billion) Forecast, by Application 2020 & 2033
- Table 36: Rest of Middle East & Africa DC Fast Charging Pile Revenue (billion) Forecast, by Application 2020 & 2033
- Table 37: Global DC Fast Charging Pile Revenue billion Forecast, by Application 2020 & 2033
- Table 38: Global DC Fast Charging Pile Revenue billion Forecast, by Types 2020 & 2033
- Table 39: Global DC Fast Charging Pile Revenue billion Forecast, by Country 2020 & 2033
- Table 40: China DC Fast Charging Pile Revenue (billion) Forecast, by Application 2020 & 2033
- Table 41: India DC Fast Charging Pile Revenue (billion) Forecast, by Application 2020 & 2033
- Table 42: Japan DC Fast Charging Pile Revenue (billion) Forecast, by Application 2020 & 2033
- Table 43: South Korea DC Fast Charging Pile Revenue (billion) Forecast, by Application 2020 & 2033
- Table 44: ASEAN DC Fast Charging Pile Revenue (billion) Forecast, by Application 2020 & 2033
- Table 45: Oceania DC Fast Charging Pile Revenue (billion) Forecast, by Application 2020 & 2033
- Table 46: Rest of Asia Pacific DC Fast Charging Pile Revenue (billion) Forecast, by Application 2020 & 2033
Frequently Asked Questions
1. What is the projected Compound Annual Growth Rate (CAGR) of the DC Fast Charging Pile?
The projected CAGR is approximately 6.17%.
2. Which companies are prominent players in the DC Fast Charging Pile?
Key companies in the market include Grasen, UUGreenPower, Tritium, Francis Energy, Delta, Anaheim(AE), Sicon Chat Union Electric Co., Newyea Group, ELECTWAY Charger, MOREDAY, Fiver New Energy Technology Co., ltd, EN, SUC, Sinexcel, Guangxi Angsheng Energy Saving Technology, Boguang Electric Technology, Zhejiang Benyi Electric, Guangdong Gongshi Intelligent Technology.
3. What are the main segments of the DC Fast Charging Pile?
The market segments include Application, Types.
4. Can you provide details about the market size?
The market size is estimated to be USD 8.04 billion as of 2022.
5. What are some drivers contributing to market growth?
N/A
6. What are the notable trends driving market growth?
N/A
7. Are there any restraints impacting market growth?
N/A
8. Can you provide examples of recent developments in the market?
N/A
9. What pricing options are available for accessing the report?
Pricing options include single-user, multi-user, and enterprise licenses priced at USD 4900.00, USD 7350.00, and USD 9800.00 respectively.
10. Is the market size provided in terms of value or volume?
The market size is provided in terms of value, measured in billion.
11. Are there any specific market keywords associated with the report?
Yes, the market keyword associated with the report is "DC Fast Charging Pile," which aids in identifying and referencing the specific market segment covered.
12. How do I determine which pricing option suits my needs best?
The pricing options vary based on user requirements and access needs. Individual users may opt for single-user licenses, while businesses requiring broader access may choose multi-user or enterprise licenses for cost-effective access to the report.
13. Are there any additional resources or data provided in the DC Fast Charging Pile report?
While the report offers comprehensive insights, it's advisable to review the specific contents or supplementary materials provided to ascertain if additional resources or data are available.
14. How can I stay updated on further developments or reports in the DC Fast Charging Pile?
To stay informed about further developments, trends, and reports in the DC Fast Charging Pile, consider subscribing to industry newsletters, following relevant companies and organizations, or regularly checking reputable industry news sources and publications.
Methodology
Step 1 - Identification of Relevant Samples Size from Population Database



Step 2 - Approaches for Defining Global Market Size (Value, Volume* & Price*)

Note*: In applicable scenarios
Step 3 - Data Sources
Primary Research
- Web Analytics
- Survey Reports
- Research Institute
- Latest Research Reports
- Opinion Leaders
Secondary Research
- Annual Reports
- White Paper
- Latest Press Release
- Industry Association
- Paid Database
- Investor Presentations

Step 4 - Data Triangulation
Involves using different sources of information in order to increase the validity of a study
These sources are likely to be stakeholders in a program - participants, other researchers, program staff, other community members, and so on.
Then we put all data in single framework & apply various statistical tools to find out the dynamic on the market.
During the analysis stage, feedback from the stakeholder groups would be compared to determine areas of agreement as well as areas of divergence