

Key Insights
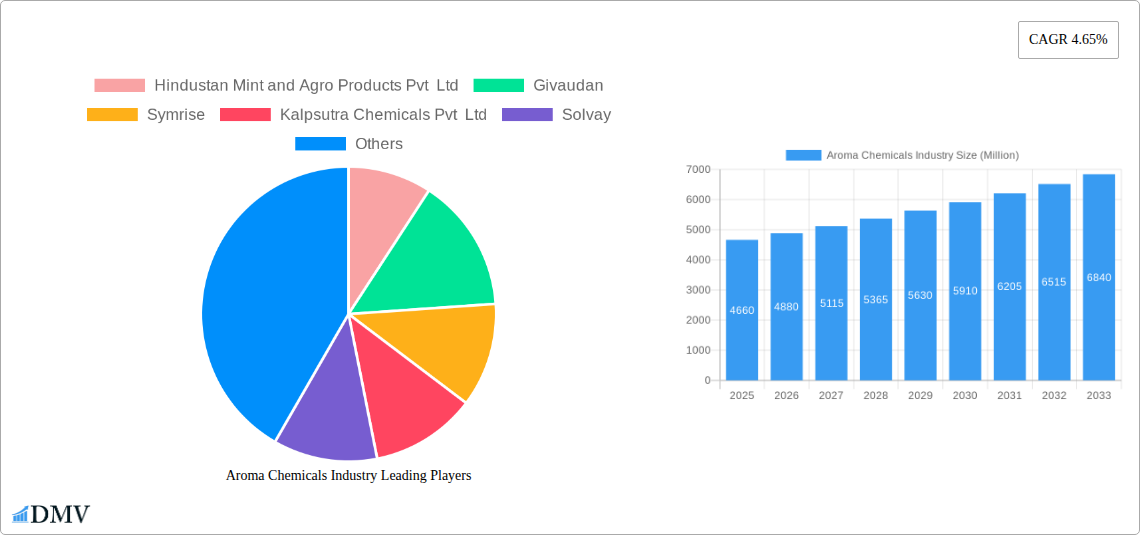
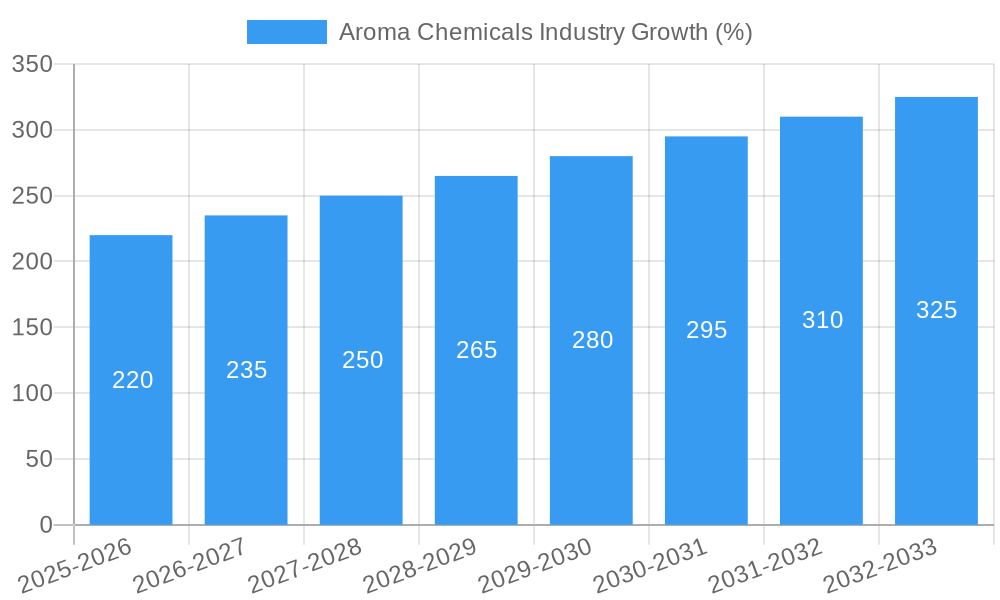
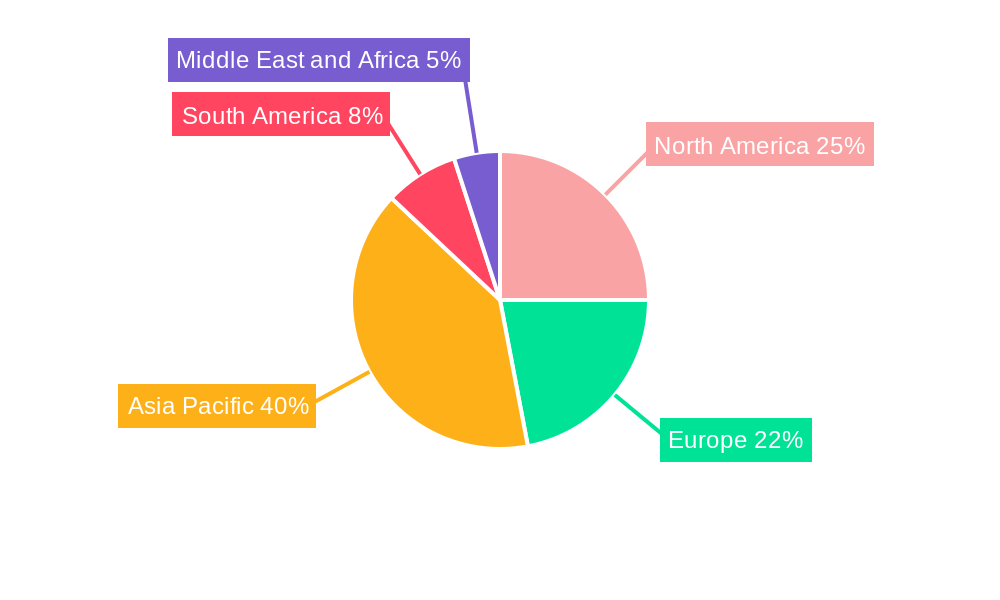
The global aroma chemicals market, valued at $4.66 billion in 2025, is projected to experience robust growth, driven by increasing demand across diverse sectors. A compound annual growth rate (CAGR) of 4.65% from 2025 to 2033 indicates a significant expansion, reaching an estimated value exceeding $7 billion by 2033. Key growth drivers include the burgeoning cosmetics and personal care industry, the rising popularity of natural and organic products, and the expanding food and beverage sector's focus on enhancing flavor profiles. The market's segmentation reveals substantial opportunities in terpenes and benzenoids, which are widely used in fragrances and flavors. The increasing consumer preference for premium and specialized fragrances further fuels demand, with fine fragrances and cosmetics representing lucrative application segments. However, stringent regulatory frameworks concerning the use of certain aroma chemicals and the potential volatility of raw material prices present challenges to sustained growth. Geographic analysis shows strong market presence in Asia Pacific, particularly China and India, owing to rapid industrialization and growing disposable incomes. North America and Europe also represent significant markets, driven by established industries and high consumer spending on aroma-enhanced products. Competitive dynamics are characterized by the presence of both large multinational corporations and smaller specialized players, leading to a dynamic and innovative market landscape.
The aroma chemicals market's future growth trajectory will be shaped by several factors. Continued innovation in aroma chemical formulations, focusing on sustainability and natural ingredients, will attract environmentally conscious consumers. The development of novel aroma chemicals with unique olfactory properties will also create new market opportunities. Furthermore, strategic partnerships between aroma chemical manufacturers and downstream industries, such as cosmetic and food companies, will accelerate market penetration. While challenges such as fluctuating raw material prices and regulatory hurdles persist, the overall outlook for the aroma chemicals market remains positive, supported by consistent growth in consumer demand across key application sectors and geographic regions. The market's ability to adapt to changing consumer preferences and address sustainability concerns will be crucial for realizing its full growth potential.
Aroma Chemicals Industry Market Report: 2019-2033 Forecast
This comprehensive report provides an in-depth analysis of the Aroma Chemicals industry, projecting a market value of $XX Million by 2033. It covers market trends, competitive landscape, technological advancements, and future growth opportunities, offering invaluable insights for stakeholders across the value chain. The report leverages data from the historical period (2019-2024), the base year (2025), and the forecast period (2025-2033).
Aroma Chemicals Industry Market Composition & Trends
The Aroma Chemicals market, valued at $XX Million in 2025, exhibits a moderately consolidated structure. Key players like Givaudan, Symrise, and BASF SE hold significant market share, while several smaller companies such as Hindustan Mint and Agro Products Pvt Ltd and Kalpsutra Chemicals Pvt Ltd contribute to a competitive landscape. Innovation is driven by consumer demand for natural and sustainable products, leading to significant R&D investment in terpenes, benzenoids, and other natural aroma chemical categories. Stringent regulatory frameworks regarding safety and labeling influence product development and marketing strategies. Substitute products, including natural extracts and essential oils, exert competitive pressure. The market also witnesses considerable M&A activity, with deals valued at $XX Million annually on average (2019-2024). End-users span diverse sectors, including soap and detergents, cosmetics, fine fragrances, food and beverage, and household products, exhibiting varying growth trajectories and demands.
- Market Share Distribution: Givaudan (XX%), Symrise (XX%), BASF SE (XX%), Others (XX%)
- M&A Deal Value (Avg. 2019-2024): $XX Million
- Key End-Users: Soap & Detergents, Cosmetics & Toiletries, Fine Fragrances
Aroma Chemicals Industry Industry Evolution
The Aroma Chemicals industry has witnessed robust growth over the past decade, fueled by rising disposable incomes, changing consumer preferences, and technological advancements. The market exhibited a CAGR of XX% during 2019-2024, primarily driven by the increasing demand for natural and sustainable aroma chemicals. The adoption of novel extraction and synthesis techniques, coupled with the development of advanced analytical tools, is transforming the industry landscape. Consumers are increasingly seeking naturally-derived, ethically sourced, and high-quality aroma chemicals, impacting product formulations and marketing strategies. The shift towards natural products is significantly affecting the demand for various aroma chemical types, with terpenes and benzenoids witnessing the fastest growth.
Leading Regions, Countries, or Segments in Aroma Chemicals Industry
The Aroma Chemicals market is geographically diverse, with North America and Europe holding prominent positions. However, Asia-Pacific is emerging as a high-growth region, propelled by rapid economic development and a burgeoning consumer base. Within the product categories, the demand for terpenes and benzenoids is particularly strong across all regions due to their wide range of applications. Cosmetics and toiletries remain the largest application segment, followed by food & beverage and fine fragrances.
- Dominant Region: Europe and North America
- Fastest Growing Region: Asia-Pacific
- Key Drivers (Asia-Pacific): Rising disposable incomes, growing middle class, increasing demand for personal care products.
- Key Drivers (Europe): Stringent regulations favoring natural ingredients, high consumer awareness of sustainability.
- Key Drivers (North America): Well-established market for aroma chemicals, strong innovation and R&D investment.
Within application segments, Cosmetics and Toiletries holds the largest market share, driven by increasing demand for personal care products. The demand for natural and sustainable products is driving growth in Food and Beverage application segments.
Aroma Chemicals Industry Product Innovations
Recent innovations focus on developing sustainable and bio-based aroma chemicals to meet growing consumer demand for environmentally friendly products. This includes utilizing advanced extraction methods for natural ingredients and exploring new synthesis routes for more sustainable chemical production. Companies are also focusing on enhancing product performance and creating customized aroma profiles to meet the diverse requirements of different applications, leading to the development of unique selling propositions based on superior efficacy, safety, and sustainability.
Propelling Factors for Aroma Chemicals Industry Growth
The Aroma Chemicals industry's growth is fueled by several factors: the rising demand for personal care and food products, particularly in developing economies, coupled with technological advancements in extraction and synthesis methods. Government regulations promoting the use of natural and sustainable ingredients are also creating positive market momentum. Moreover, the increasing consumer awareness of the link between aroma and well-being is driving innovation and demand for specialized aroma chemicals.
Obstacles in the Aroma Chemicals Industry Market
The Aroma Chemicals industry faces challenges such as fluctuating raw material prices, stringent regulatory requirements, and intense competition. Supply chain disruptions, particularly in the procurement of natural ingredients, also pose a significant risk. These factors can lead to cost increases and impact product availability, affecting overall market growth and profitability.
Future Opportunities in Aroma Chemicals Industry
Future growth opportunities lie in exploring new applications for aroma chemicals, such as in pharmaceuticals and industrial cleaning. The development of novel bio-based aroma chemicals with enhanced properties, combined with a focus on eco-friendly and sustainable production methods, presents significant potential. Furthermore, catering to personalized aroma preferences through customized product offerings is a key area of expansion.
Major Players in the Aroma Chemicals Industry Ecosystem
- Givaudan
- Symrise
- BASF SE
- Hindustan Mint and Agro Products Pvt Ltd
- Kalpsutra Chemicals Pvt Ltd
- Solvay
- Takasago International Corporation
- S H Kelkar And Company Limited
- Robertet Group
- DSM
- Bell Flavors & Fragrances
- Treatt Plc
- Kao Corporation
- Silverline Chemicals
Key Developments in Aroma Chemicals Industry Industry
- Sept 2022: Solvay launched three new natural flavors (Rhovanil Natural Delica, Alta, and Sublima) expanding its Rhovanil Natural CW product line, catering to the growing demand for natural ingredients in the F&B sector.
- Aug 2022: Kao Corporation announced plans to expand its market share in Europe for methyl dihydro jasmonate (MDJ), a synthetic fragrance, leveraging its existing strong market position.
Strategic Aroma Chemicals Industry Market Forecast
The Aroma Chemicals market is poised for continued growth, driven by increasing demand across diverse sectors. The focus on sustainability and natural ingredients will shape future market dynamics, presenting opportunities for companies investing in innovative and eco-friendly solutions. The expanding applications in niche markets and the development of personalized aroma solutions will also contribute to overall market expansion.
Aroma Chemicals Industry Segmentation
-
1. Type
- 1.1. Terpenes
- 1.2. Benzenoids
- 1.3. Musk Chemicals
- 1.4. Other Types
-
2. Application
- 2.1. Soap and Detergents
- 2.2. Cosmetics and Toiletries
- 2.3. Fine Fragrances
- 2.4. Household Products
- 2.5. Food and Beverage
- 2.6. Other Applications
Aroma Chemicals Industry Segmentation By Geography
-
1. Asia Pacific
- 1.1. China
- 1.2. India
- 1.3. Japan
- 1.4. South Korea
- 1.5. Rest of Asia Pacific
-
2. North America
- 2.1. United States
- 2.2. Canada
- 2.3. Mexico
-
3. Europe
- 3.1. Germany
- 3.2. United Kingdom
- 3.3. Italy
- 3.4. France
- 3.5. Rest of Europe
-
4. South America
- 4.1. Brazil
- 4.2. Argentina
- 4.3. Rest of South America
-
5. Middle East and Africa
- 5.1. Saudi Arabia
- 5.2. South Africa
- 5.3. Rest of Middle East and Africa
Aroma Chemicals Industry REPORT HIGHLIGHTS
| Aspects | Details |
|---|---|
| Study Period | 2019-2033 |
| Base Year | 2024 |
| Estimated Year | 2025 |
| Forecast Period | 2025-2033 |
| Historical Period | 2019-2024 |
| Growth Rate | CAGR of 4.65% from 2019-2033 |
| Segmentation |
|
Table of Contents
- 1. Introduction
- 1.1. Research Scope
- 1.2. Market Segmentation
- 1.3. Research Methodology
- 1.4. Definitions and Assumptions
- 2. Executive Summary
- 2.1. Introduction
- 3. Market Dynamics
- 3.1. Introduction
- 3.2. Market Drivers
- 3.2.1. Blooming Use in Fragrance Industry; Increasing advancements in the personal care products industries; Other Drivers
- 3.3. Market Restrains
- 3.3.1. High R&D Cost Coupled with Stringent Government Regulation; Other Restraints
- 3.4. Market Trends
- 3.4.1. Growing Demand from Fine Fragrances Application
- 4. Market Factor Analysis
- 4.1. Porters Five Forces
- 4.2. Supply/Value Chain
- 4.3. PESTEL analysis
- 4.4. Market Entropy
- 4.5. Patent/Trademark Analysis
- 5. Global Aroma Chemicals Industry Analysis, Insights and Forecast, 2019-2031
- 5.1. Market Analysis, Insights and Forecast - by Type
- 5.1.1. Terpenes
- 5.1.2. Benzenoids
- 5.1.3. Musk Chemicals
- 5.1.4. Other Types
- 5.2. Market Analysis, Insights and Forecast - by Application
- 5.2.1. Soap and Detergents
- 5.2.2. Cosmetics and Toiletries
- 5.2.3. Fine Fragrances
- 5.2.4. Household Products
- 5.2.5. Food and Beverage
- 5.2.6. Other Applications
- 5.3. Market Analysis, Insights and Forecast - by Region
- 5.3.1. Asia Pacific
- 5.3.2. North America
- 5.3.3. Europe
- 5.3.4. South America
- 5.3.5. Middle East and Africa
- 5.1. Market Analysis, Insights and Forecast - by Type
- 6. Asia Pacific Aroma Chemicals Industry Analysis, Insights and Forecast, 2019-2031
- 6.1. Market Analysis, Insights and Forecast - by Type
- 6.1.1. Terpenes
- 6.1.2. Benzenoids
- 6.1.3. Musk Chemicals
- 6.1.4. Other Types
- 6.2. Market Analysis, Insights and Forecast - by Application
- 6.2.1. Soap and Detergents
- 6.2.2. Cosmetics and Toiletries
- 6.2.3. Fine Fragrances
- 6.2.4. Household Products
- 6.2.5. Food and Beverage
- 6.2.6. Other Applications
- 6.1. Market Analysis, Insights and Forecast - by Type
- 7. North America Aroma Chemicals Industry Analysis, Insights and Forecast, 2019-2031
- 7.1. Market Analysis, Insights and Forecast - by Type
- 7.1.1. Terpenes
- 7.1.2. Benzenoids
- 7.1.3. Musk Chemicals
- 7.1.4. Other Types
- 7.2. Market Analysis, Insights and Forecast - by Application
- 7.2.1. Soap and Detergents
- 7.2.2. Cosmetics and Toiletries
- 7.2.3. Fine Fragrances
- 7.2.4. Household Products
- 7.2.5. Food and Beverage
- 7.2.6. Other Applications
- 7.1. Market Analysis, Insights and Forecast - by Type
- 8. Europe Aroma Chemicals Industry Analysis, Insights and Forecast, 2019-2031
- 8.1. Market Analysis, Insights and Forecast - by Type
- 8.1.1. Terpenes
- 8.1.2. Benzenoids
- 8.1.3. Musk Chemicals
- 8.1.4. Other Types
- 8.2. Market Analysis, Insights and Forecast - by Application
- 8.2.1. Soap and Detergents
- 8.2.2. Cosmetics and Toiletries
- 8.2.3. Fine Fragrances
- 8.2.4. Household Products
- 8.2.5. Food and Beverage
- 8.2.6. Other Applications
- 8.1. Market Analysis, Insights and Forecast - by Type
- 9. South America Aroma Chemicals Industry Analysis, Insights and Forecast, 2019-2031
- 9.1. Market Analysis, Insights and Forecast - by Type
- 9.1.1. Terpenes
- 9.1.2. Benzenoids
- 9.1.3. Musk Chemicals
- 9.1.4. Other Types
- 9.2. Market Analysis, Insights and Forecast - by Application
- 9.2.1. Soap and Detergents
- 9.2.2. Cosmetics and Toiletries
- 9.2.3. Fine Fragrances
- 9.2.4. Household Products
- 9.2.5. Food and Beverage
- 9.2.6. Other Applications
- 9.1. Market Analysis, Insights and Forecast - by Type
- 10. Middle East and Africa Aroma Chemicals Industry Analysis, Insights and Forecast, 2019-2031
- 10.1. Market Analysis, Insights and Forecast - by Type
- 10.1.1. Terpenes
- 10.1.2. Benzenoids
- 10.1.3. Musk Chemicals
- 10.1.4. Other Types
- 10.2. Market Analysis, Insights and Forecast - by Application
- 10.2.1. Soap and Detergents
- 10.2.2. Cosmetics and Toiletries
- 10.2.3. Fine Fragrances
- 10.2.4. Household Products
- 10.2.5. Food and Beverage
- 10.2.6. Other Applications
- 10.1. Market Analysis, Insights and Forecast - by Type
- 11. Asia Pacific Aroma Chemicals Industry Analysis, Insights and Forecast, 2019-2031
- 11.1. Market Analysis, Insights and Forecast - By Country/Sub-region
- 11.1.1 China
- 11.1.2 India
- 11.1.3 Japan
- 11.1.4 South Korea
- 11.1.5 Rest of Asia Pacific
- 12. North America Aroma Chemicals Industry Analysis, Insights and Forecast, 2019-2031
- 12.1. Market Analysis, Insights and Forecast - By Country/Sub-region
- 12.1.1 United States
- 12.1.2 Canada
- 12.1.3 Mexico
- 13. Europe Aroma Chemicals Industry Analysis, Insights and Forecast, 2019-2031
- 13.1. Market Analysis, Insights and Forecast - By Country/Sub-region
- 13.1.1 Germany
- 13.1.2 United Kingdom
- 13.1.3 Italy
- 13.1.4 France
- 13.1.5 Rest of Europe
- 14. South America Aroma Chemicals Industry Analysis, Insights and Forecast, 2019-2031
- 14.1. Market Analysis, Insights and Forecast - By Country/Sub-region
- 14.1.1 Brazil
- 14.1.2 Argentina
- 14.1.3 Rest of South America
- 15. Middle East and Africa Aroma Chemicals Industry Analysis, Insights and Forecast, 2019-2031
- 15.1. Market Analysis, Insights and Forecast - By Country/Sub-region
- 15.1.1 Saudi Arabia
- 15.1.2 South Africa
- 15.1.3 Rest of Middle East and Africa
- 16. Competitive Analysis
- 16.1. Global Market Share Analysis 2024
- 16.2. Company Profiles
- 16.2.1 Hindustan Mint and Agro Products Pvt Ltd
- 16.2.1.1. Overview
- 16.2.1.2. Products
- 16.2.1.3. SWOT Analysis
- 16.2.1.4. Recent Developments
- 16.2.1.5. Financials (Based on Availability)
- 16.2.2 Givaudan
- 16.2.2.1. Overview
- 16.2.2.2. Products
- 16.2.2.3. SWOT Analysis
- 16.2.2.4. Recent Developments
- 16.2.2.5. Financials (Based on Availability)
- 16.2.3 Symrise
- 16.2.3.1. Overview
- 16.2.3.2. Products
- 16.2.3.3. SWOT Analysis
- 16.2.3.4. Recent Developments
- 16.2.3.5. Financials (Based on Availability)
- 16.2.4 Kalpsutra Chemicals Pvt Ltd
- 16.2.4.1. Overview
- 16.2.4.2. Products
- 16.2.4.3. SWOT Analysis
- 16.2.4.4. Recent Developments
- 16.2.4.5. Financials (Based on Availability)
- 16.2.5 Solvay
- 16.2.5.1. Overview
- 16.2.5.2. Products
- 16.2.5.3. SWOT Analysis
- 16.2.5.4. Recent Developments
- 16.2.5.5. Financials (Based on Availability)
- 16.2.6 Takasago International Corporation
- 16.2.6.1. Overview
- 16.2.6.2. Products
- 16.2.6.3. SWOT Analysis
- 16.2.6.4. Recent Developments
- 16.2.6.5. Financials (Based on Availability)
- 16.2.7 BASF SE
- 16.2.7.1. Overview
- 16.2.7.2. Products
- 16.2.7.3. SWOT Analysis
- 16.2.7.4. Recent Developments
- 16.2.7.5. Financials (Based on Availability)
- 16.2.8 S H Kelkar And Company Limited
- 16.2.8.1. Overview
- 16.2.8.2. Products
- 16.2.8.3. SWOT Analysis
- 16.2.8.4. Recent Developments
- 16.2.8.5. Financials (Based on Availability)
- 16.2.9 Robertet Group
- 16.2.9.1. Overview
- 16.2.9.2. Products
- 16.2.9.3. SWOT Analysis
- 16.2.9.4. Recent Developments
- 16.2.9.5. Financials (Based on Availability)
- 16.2.10 DSM
- 16.2.10.1. Overview
- 16.2.10.2. Products
- 16.2.10.3. SWOT Analysis
- 16.2.10.4. Recent Developments
- 16.2.10.5. Financials (Based on Availability)
- 16.2.11 Bell Flavors & Fragrances
- 16.2.11.1. Overview
- 16.2.11.2. Products
- 16.2.11.3. SWOT Analysis
- 16.2.11.4. Recent Developments
- 16.2.11.5. Financials (Based on Availability)
- 16.2.12 Treatt Plc*List Not Exhaustive
- 16.2.12.1. Overview
- 16.2.12.2. Products
- 16.2.12.3. SWOT Analysis
- 16.2.12.4. Recent Developments
- 16.2.12.5. Financials (Based on Availability)
- 16.2.13 Kao Corporation
- 16.2.13.1. Overview
- 16.2.13.2. Products
- 16.2.13.3. SWOT Analysis
- 16.2.13.4. Recent Developments
- 16.2.13.5. Financials (Based on Availability)
- 16.2.14 Silverline Chemicals
- 16.2.14.1. Overview
- 16.2.14.2. Products
- 16.2.14.3. SWOT Analysis
- 16.2.14.4. Recent Developments
- 16.2.14.5. Financials (Based on Availability)
- 16.2.1 Hindustan Mint and Agro Products Pvt Ltd
List of Figures
- Figure 1: Global Aroma Chemicals Industry Revenue Breakdown (Million, %) by Region 2024 & 2032
- Figure 2: Asia Pacific Aroma Chemicals Industry Revenue (Million), by Country 2024 & 2032
- Figure 3: Asia Pacific Aroma Chemicals Industry Revenue Share (%), by Country 2024 & 2032
- Figure 4: North America Aroma Chemicals Industry Revenue (Million), by Country 2024 & 2032
- Figure 5: North America Aroma Chemicals Industry Revenue Share (%), by Country 2024 & 2032
- Figure 6: Europe Aroma Chemicals Industry Revenue (Million), by Country 2024 & 2032
- Figure 7: Europe Aroma Chemicals Industry Revenue Share (%), by Country 2024 & 2032
- Figure 8: South America Aroma Chemicals Industry Revenue (Million), by Country 2024 & 2032
- Figure 9: South America Aroma Chemicals Industry Revenue Share (%), by Country 2024 & 2032
- Figure 10: Middle East and Africa Aroma Chemicals Industry Revenue (Million), by Country 2024 & 2032
- Figure 11: Middle East and Africa Aroma Chemicals Industry Revenue Share (%), by Country 2024 & 2032
- Figure 12: Asia Pacific Aroma Chemicals Industry Revenue (Million), by Type 2024 & 2032
- Figure 13: Asia Pacific Aroma Chemicals Industry Revenue Share (%), by Type 2024 & 2032
- Figure 14: Asia Pacific Aroma Chemicals Industry Revenue (Million), by Application 2024 & 2032
- Figure 15: Asia Pacific Aroma Chemicals Industry Revenue Share (%), by Application 2024 & 2032
- Figure 16: Asia Pacific Aroma Chemicals Industry Revenue (Million), by Country 2024 & 2032
- Figure 17: Asia Pacific Aroma Chemicals Industry Revenue Share (%), by Country 2024 & 2032
- Figure 18: North America Aroma Chemicals Industry Revenue (Million), by Type 2024 & 2032
- Figure 19: North America Aroma Chemicals Industry Revenue Share (%), by Type 2024 & 2032
- Figure 20: North America Aroma Chemicals Industry Revenue (Million), by Application 2024 & 2032
- Figure 21: North America Aroma Chemicals Industry Revenue Share (%), by Application 2024 & 2032
- Figure 22: North America Aroma Chemicals Industry Revenue (Million), by Country 2024 & 2032
- Figure 23: North America Aroma Chemicals Industry Revenue Share (%), by Country 2024 & 2032
- Figure 24: Europe Aroma Chemicals Industry Revenue (Million), by Type 2024 & 2032
- Figure 25: Europe Aroma Chemicals Industry Revenue Share (%), by Type 2024 & 2032
- Figure 26: Europe Aroma Chemicals Industry Revenue (Million), by Application 2024 & 2032
- Figure 27: Europe Aroma Chemicals Industry Revenue Share (%), by Application 2024 & 2032
- Figure 28: Europe Aroma Chemicals Industry Revenue (Million), by Country 2024 & 2032
- Figure 29: Europe Aroma Chemicals Industry Revenue Share (%), by Country 2024 & 2032
- Figure 30: South America Aroma Chemicals Industry Revenue (Million), by Type 2024 & 2032
- Figure 31: South America Aroma Chemicals Industry Revenue Share (%), by Type 2024 & 2032
- Figure 32: South America Aroma Chemicals Industry Revenue (Million), by Application 2024 & 2032
- Figure 33: South America Aroma Chemicals Industry Revenue Share (%), by Application 2024 & 2032
- Figure 34: South America Aroma Chemicals Industry Revenue (Million), by Country 2024 & 2032
- Figure 35: South America Aroma Chemicals Industry Revenue Share (%), by Country 2024 & 2032
- Figure 36: Middle East and Africa Aroma Chemicals Industry Revenue (Million), by Type 2024 & 2032
- Figure 37: Middle East and Africa Aroma Chemicals Industry Revenue Share (%), by Type 2024 & 2032
- Figure 38: Middle East and Africa Aroma Chemicals Industry Revenue (Million), by Application 2024 & 2032
- Figure 39: Middle East and Africa Aroma Chemicals Industry Revenue Share (%), by Application 2024 & 2032
- Figure 40: Middle East and Africa Aroma Chemicals Industry Revenue (Million), by Country 2024 & 2032
- Figure 41: Middle East and Africa Aroma Chemicals Industry Revenue Share (%), by Country 2024 & 2032
List of Tables
- Table 1: Global Aroma Chemicals Industry Revenue Million Forecast, by Region 2019 & 2032
- Table 2: Global Aroma Chemicals Industry Revenue Million Forecast, by Type 2019 & 2032
- Table 3: Global Aroma Chemicals Industry Revenue Million Forecast, by Application 2019 & 2032
- Table 4: Global Aroma Chemicals Industry Revenue Million Forecast, by Region 2019 & 2032
- Table 5: Global Aroma Chemicals Industry Revenue Million Forecast, by Country 2019 & 2032
- Table 6: China Aroma Chemicals Industry Revenue (Million) Forecast, by Application 2019 & 2032
- Table 7: India Aroma Chemicals Industry Revenue (Million) Forecast, by Application 2019 & 2032
- Table 8: Japan Aroma Chemicals Industry Revenue (Million) Forecast, by Application 2019 & 2032
- Table 9: South Korea Aroma Chemicals Industry Revenue (Million) Forecast, by Application 2019 & 2032
- Table 10: Rest of Asia Pacific Aroma Chemicals Industry Revenue (Million) Forecast, by Application 2019 & 2032
- Table 11: Global Aroma Chemicals Industry Revenue Million Forecast, by Country 2019 & 2032
- Table 12: United States Aroma Chemicals Industry Revenue (Million) Forecast, by Application 2019 & 2032
- Table 13: Canada Aroma Chemicals Industry Revenue (Million) Forecast, by Application 2019 & 2032
- Table 14: Mexico Aroma Chemicals Industry Revenue (Million) Forecast, by Application 2019 & 2032
- Table 15: Global Aroma Chemicals Industry Revenue Million Forecast, by Country 2019 & 2032
- Table 16: Germany Aroma Chemicals Industry Revenue (Million) Forecast, by Application 2019 & 2032
- Table 17: United Kingdom Aroma Chemicals Industry Revenue (Million) Forecast, by Application 2019 & 2032
- Table 18: Italy Aroma Chemicals Industry Revenue (Million) Forecast, by Application 2019 & 2032
- Table 19: France Aroma Chemicals Industry Revenue (Million) Forecast, by Application 2019 & 2032
- Table 20: Rest of Europe Aroma Chemicals Industry Revenue (Million) Forecast, by Application 2019 & 2032
- Table 21: Global Aroma Chemicals Industry Revenue Million Forecast, by Country 2019 & 2032
- Table 22: Brazil Aroma Chemicals Industry Revenue (Million) Forecast, by Application 2019 & 2032
- Table 23: Argentina Aroma Chemicals Industry Revenue (Million) Forecast, by Application 2019 & 2032
- Table 24: Rest of South America Aroma Chemicals Industry Revenue (Million) Forecast, by Application 2019 & 2032
- Table 25: Global Aroma Chemicals Industry Revenue Million Forecast, by Country 2019 & 2032
- Table 26: Saudi Arabia Aroma Chemicals Industry Revenue (Million) Forecast, by Application 2019 & 2032
- Table 27: South Africa Aroma Chemicals Industry Revenue (Million) Forecast, by Application 2019 & 2032
- Table 28: Rest of Middle East and Africa Aroma Chemicals Industry Revenue (Million) Forecast, by Application 2019 & 2032
- Table 29: Global Aroma Chemicals Industry Revenue Million Forecast, by Type 2019 & 2032
- Table 30: Global Aroma Chemicals Industry Revenue Million Forecast, by Application 2019 & 2032
- Table 31: Global Aroma Chemicals Industry Revenue Million Forecast, by Country 2019 & 2032
- Table 32: China Aroma Chemicals Industry Revenue (Million) Forecast, by Application 2019 & 2032
- Table 33: India Aroma Chemicals Industry Revenue (Million) Forecast, by Application 2019 & 2032
- Table 34: Japan Aroma Chemicals Industry Revenue (Million) Forecast, by Application 2019 & 2032
- Table 35: South Korea Aroma Chemicals Industry Revenue (Million) Forecast, by Application 2019 & 2032
- Table 36: Rest of Asia Pacific Aroma Chemicals Industry Revenue (Million) Forecast, by Application 2019 & 2032
- Table 37: Global Aroma Chemicals Industry Revenue Million Forecast, by Type 2019 & 2032
- Table 38: Global Aroma Chemicals Industry Revenue Million Forecast, by Application 2019 & 2032
- Table 39: Global Aroma Chemicals Industry Revenue Million Forecast, by Country 2019 & 2032
- Table 40: United States Aroma Chemicals Industry Revenue (Million) Forecast, by Application 2019 & 2032
- Table 41: Canada Aroma Chemicals Industry Revenue (Million) Forecast, by Application 2019 & 2032
- Table 42: Mexico Aroma Chemicals Industry Revenue (Million) Forecast, by Application 2019 & 2032
- Table 43: Global Aroma Chemicals Industry Revenue Million Forecast, by Type 2019 & 2032
- Table 44: Global Aroma Chemicals Industry Revenue Million Forecast, by Application 2019 & 2032
- Table 45: Global Aroma Chemicals Industry Revenue Million Forecast, by Country 2019 & 2032
- Table 46: Germany Aroma Chemicals Industry Revenue (Million) Forecast, by Application 2019 & 2032
- Table 47: United Kingdom Aroma Chemicals Industry Revenue (Million) Forecast, by Application 2019 & 2032
- Table 48: Italy Aroma Chemicals Industry Revenue (Million) Forecast, by Application 2019 & 2032
- Table 49: France Aroma Chemicals Industry Revenue (Million) Forecast, by Application 2019 & 2032
- Table 50: Rest of Europe Aroma Chemicals Industry Revenue (Million) Forecast, by Application 2019 & 2032
- Table 51: Global Aroma Chemicals Industry Revenue Million Forecast, by Type 2019 & 2032
- Table 52: Global Aroma Chemicals Industry Revenue Million Forecast, by Application 2019 & 2032
- Table 53: Global Aroma Chemicals Industry Revenue Million Forecast, by Country 2019 & 2032
- Table 54: Brazil Aroma Chemicals Industry Revenue (Million) Forecast, by Application 2019 & 2032
- Table 55: Argentina Aroma Chemicals Industry Revenue (Million) Forecast, by Application 2019 & 2032
- Table 56: Rest of South America Aroma Chemicals Industry Revenue (Million) Forecast, by Application 2019 & 2032
- Table 57: Global Aroma Chemicals Industry Revenue Million Forecast, by Type 2019 & 2032
- Table 58: Global Aroma Chemicals Industry Revenue Million Forecast, by Application 2019 & 2032
- Table 59: Global Aroma Chemicals Industry Revenue Million Forecast, by Country 2019 & 2032
- Table 60: Saudi Arabia Aroma Chemicals Industry Revenue (Million) Forecast, by Application 2019 & 2032
- Table 61: South Africa Aroma Chemicals Industry Revenue (Million) Forecast, by Application 2019 & 2032
- Table 62: Rest of Middle East and Africa Aroma Chemicals Industry Revenue (Million) Forecast, by Application 2019 & 2032
Frequently Asked Questions
1. What is the projected Compound Annual Growth Rate (CAGR) of the Aroma Chemicals Industry?
The projected CAGR is approximately 4.65%.
2. Which companies are prominent players in the Aroma Chemicals Industry?
Key companies in the market include Hindustan Mint and Agro Products Pvt Ltd, Givaudan, Symrise, Kalpsutra Chemicals Pvt Ltd, Solvay, Takasago International Corporation, BASF SE, S H Kelkar And Company Limited, Robertet Group, DSM, Bell Flavors & Fragrances, Treatt Plc*List Not Exhaustive, Kao Corporation, Silverline Chemicals.
3. What are the main segments of the Aroma Chemicals Industry?
The market segments include Type, Application.
4. Can you provide details about the market size?
The market size is estimated to be USD 4.66 Million as of 2022.
5. What are some drivers contributing to market growth?
Blooming Use in Fragrance Industry; Increasing advancements in the personal care products industries; Other Drivers.
6. What are the notable trends driving market growth?
Growing Demand from Fine Fragrances Application.
7. Are there any restraints impacting market growth?
High R&D Cost Coupled with Stringent Government Regulation; Other Restraints.
8. Can you provide examples of recent developments in the market?
Sept 2022: Solvay expanded the range of one of its flagship products, Rhovanil Natural CW, with three new natural flavors: Rhovanil Natural Delica, Alta, and Sublima. With these new products, the group will enable the F&B industry to make a cost-effective transition to natural products and respond to growing consumer expectations for healthier, safer, tastier, and more natural products.
9. What pricing options are available for accessing the report?
Pricing options include single-user, multi-user, and enterprise licenses priced at USD 4750, USD 5250, and USD 8750 respectively.
10. Is the market size provided in terms of value or volume?
The market size is provided in terms of value, measured in Million.
11. Are there any specific market keywords associated with the report?
Yes, the market keyword associated with the report is "Aroma Chemicals Industry," which aids in identifying and referencing the specific market segment covered.
12. How do I determine which pricing option suits my needs best?
The pricing options vary based on user requirements and access needs. Individual users may opt for single-user licenses, while businesses requiring broader access may choose multi-user or enterprise licenses for cost-effective access to the report.
13. Are there any additional resources or data provided in the Aroma Chemicals Industry report?
While the report offers comprehensive insights, it's advisable to review the specific contents or supplementary materials provided to ascertain if additional resources or data are available.
14. How can I stay updated on further developments or reports in the Aroma Chemicals Industry?
To stay informed about further developments, trends, and reports in the Aroma Chemicals Industry, consider subscribing to industry newsletters, following relevant companies and organizations, or regularly checking reputable industry news sources and publications.
Methodology
Step 1 - Identification of Relevant Samples Size from Population Database


Step 2 - Approaches for Defining Global Market Size (Value, Volume* & Price*)

Note*: In applicable scenarios
Step 3 - Data Sources
Primary Research
- Web Analytics
- Survey Reports
- Research Institute
- Latest Research Reports
- Opinion Leaders
Secondary Research
- Annual Reports
- White Paper
- Latest Press Release
- Industry Association
- Paid Database
- Investor Presentations

Step 4 - Data Triangulation
Involves using different sources of information in order to increase the validity of a study
These sources are likely to be stakeholders in a program - participants, other researchers, program staff, other community members, and so on.
Then we put all data in single framework & apply various statistical tools to find out the dynamic on the market.
During the analysis stage, feedback from the stakeholder groups would be compared to determine areas of agreement as well as areas of divergence
