

Key Insights
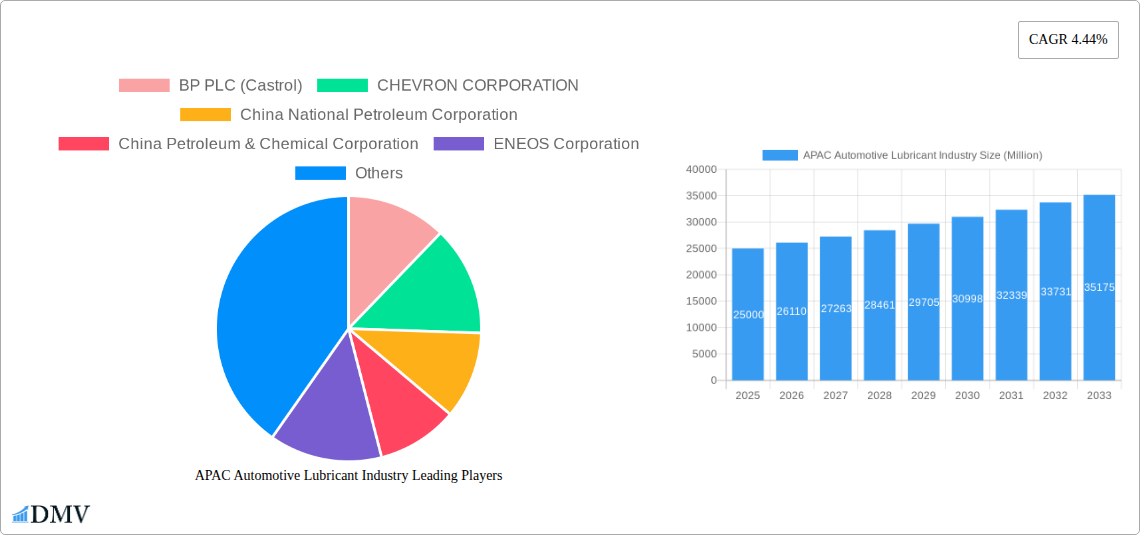
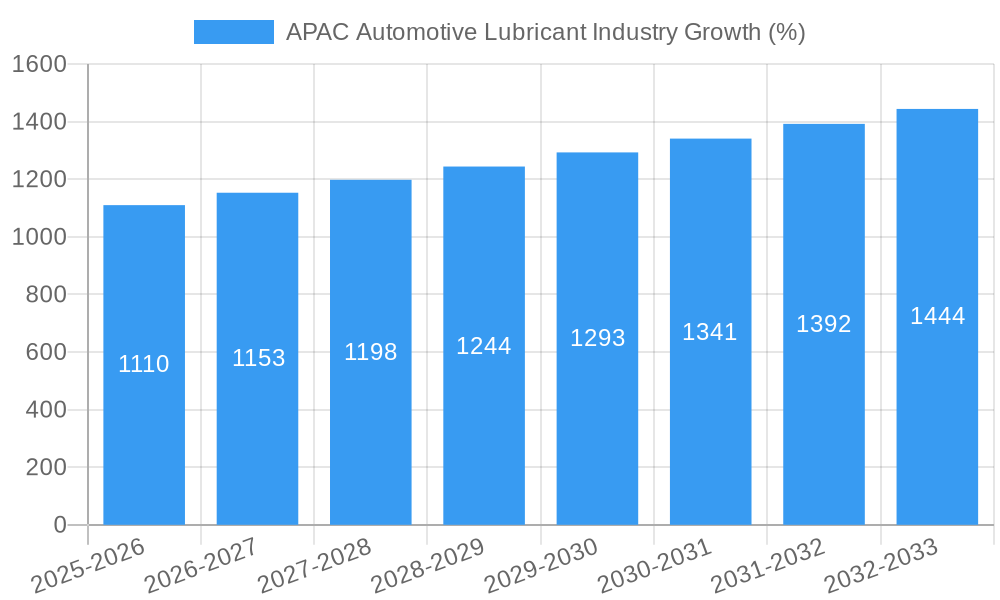
The APAC automotive lubricant market, valued at approximately $25 billion in 2025, is projected to experience robust growth, driven by a burgeoning automotive sector, rising vehicle ownership, and increasing demand for high-performance lubricants. The region's diverse economies and varying levels of automotive infrastructure contribute to a complex market landscape. Significant growth is anticipated in rapidly developing economies like India and China, fueled by expanding middle classes and rising disposable incomes leading to increased vehicle purchases. Furthermore, the shift towards stricter emission regulations and a growing preference for fuel-efficient vehicles are driving the demand for advanced lubricant technologies, such as synthetic oils and low-viscosity formulations. While factors like fluctuating crude oil prices and economic downturns pose potential challenges, the overall outlook for the market remains positive, with a projected Compound Annual Growth Rate (CAGR) of 4.44% from 2025 to 2033.
The competitive landscape is characterized by a mix of global giants and regional players. Major international companies like BP PLC (Castrol), Chevron Corporation, ExxonMobil Corporation, and Royal Dutch Shell Plc hold substantial market share, leveraging their established brands and extensive distribution networks. However, domestic players, including China National Petroleum Corporation, China Petroleum & Chemical Corporation, and Indian Oil Corporation Limited, are also significant competitors, benefiting from local market knowledge and cost advantages. The market is expected to witness increased consolidation and strategic partnerships in the coming years, as companies seek to expand their market reach and enhance their product portfolios to cater to evolving consumer preferences and technological advancements. Growth will be further fueled by increasing adoption of electric vehicles although the impact is yet to be fully realized within the forecast period.
APAC Automotive Lubricant Industry: A Comprehensive Market Report (2019-2033)
This insightful report provides a detailed analysis of the APAC automotive lubricant industry, offering a comprehensive overview of market trends, competitive dynamics, and future growth prospects. The study period spans 2019-2033, with a focus on the base year 2025 and a forecast period of 2025-2033. This report is essential for stakeholders seeking to understand the current landscape and navigate the evolving dynamics of this lucrative market, projected to be worth xx Million by 2033.
APAC Automotive Lubricant Industry Market Composition & Trends
This section delves into the intricate composition of the APAC automotive lubricant market, examining market concentration, innovation drivers, regulatory landscapes, substitute products, end-user profiles, and significant M&A activities. The report analyzes market share distribution among key players like BP PLC (Castrol), CHEVRON CORPORATION, and ExxonMobil Corporation, revealing a moderately concentrated market with ongoing consolidation. M&A activities are evaluated, with deal values analyzed to determine their impact on market dynamics. Regulatory changes impacting formulation standards and environmental regulations are assessed, along with the emergence of sustainable and bio-based lubricants as substitute products. End-user profiles encompassing passenger cars, commercial vehicles, and two-wheelers are detailed, providing a granular understanding of market segmentation.
- Market Concentration: Moderate, with top 5 players holding approximately xx% market share in 2024.
- Innovation Catalysts: Stringent emission norms, growing demand for fuel-efficient vehicles, and the rise of electric vehicles.
- Regulatory Landscape: Varying regulations across APAC nations influencing lubricant formulations and environmental compliance.
- Substitute Products: Growth of bio-based and synthetic lubricants, impacting the market share of conventional oils.
- M&A Activity: xx Million in M&A deal value recorded between 2019 and 2024, signifying industry consolidation.
APAC Automotive Lubricant Industry Industry Evolution
This section traces the evolution of the APAC automotive lubricant industry, charting its growth trajectory from 2019 to 2024 and projecting its future path until 2033. The analysis incorporates technological advancements driving product innovation, such as the shift towards higher-performance synthetic lubricants and the development of specialized oils for electric vehicles. Evolving consumer preferences, including a growing preference for environmentally friendly options and extended drain intervals, are also considered. Detailed data points, including CAGR and adoption rates of various lubricant types, illuminate industry transformation. The report analyses the impact of economic fluctuations, technological disruption, and evolving government policies on the market's growth and development. The rise in demand for passenger cars and commercial vehicles in high-growth economies significantly influenced market expansion. Technological advancements, particularly in synthetic lubricant formulations, have led to improved engine performance and efficiency, positively impacting industry growth.
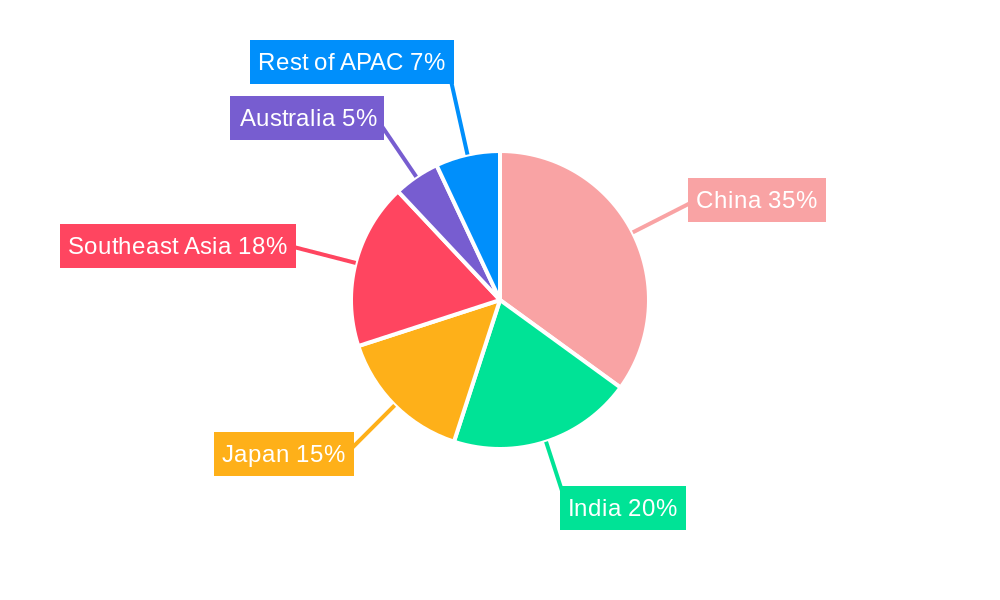
Leading Regions, Countries, or Segments in APAC Automotive Lubricant Industry
This section identifies the leading regions, countries, or segments within the APAC automotive lubricant market, providing a detailed analysis of their dominance. The report pinpoints the key factors driving growth in these leading markets and segments, utilizing a combination of insightful paragraphs and concise bullet points.
Dominant Region: China, driven by its massive automotive market and robust economic growth.
Key Drivers in China:
- Large and expanding automotive sector.
- Significant government investments in infrastructure development.
- Favorable regulatory environment supporting industry growth.
Dominant Segment: Passenger car lubricants, owing to the high growth in passenger vehicle sales across APAC.
Key Drivers in Passenger Car Segment:
- Rising disposable incomes and increased vehicle ownership.
- Technological advancements in engine design requiring specialized lubricants.
- Growing preference for fuel-efficient vehicles.
APAC Automotive Lubricant Industry Product Innovations
The APAC automotive lubricant market is witnessing significant product innovations, driven by technological advancements and evolving consumer needs. The introduction of advanced synthetic lubricants, tailored for specific engine types and performance requirements, is a key trend. Formulations focused on enhanced fuel efficiency, extended drain intervals, and improved engine protection are gaining traction. The development of environmentally friendly, bio-based lubricants also represents a notable area of innovation, addressing growing sustainability concerns.
Propelling Factors for APAP Automotive Lubricant Industry Growth
Several factors are driving the growth of the APAP automotive lubricant industry. Firstly, rapid economic growth in several APAC countries is boosting automotive sales. Secondly, the increasing popularity of vehicles with advanced engine technologies and stringent emission norms are propelling demand for high-performance lubricants. Lastly, government initiatives promoting sustainable transportation and stricter emission regulations are driving demand for eco-friendly products.
Obstacles in the APAC Automotive Lubricant Industry Market
Despite the positive outlook, the APAC automotive lubricant industry faces several challenges. Supply chain disruptions, particularly concerning raw material sourcing, pose a significant risk. Intense competition among established players and the emergence of new entrants create pricing pressures. Furthermore, fluctuations in crude oil prices directly impact lubricant production costs and market profitability. Finally, the increasing complexity of regulatory compliance across different APAC countries poses operational hurdles.
Future Opportunities in APAC Automotive Lubricant Industry
The APAC automotive lubricant market presents numerous opportunities for growth. The increasing adoption of electric vehicles creates demand for specialized lubricants catering to their unique requirements. Growing consumer awareness of eco-friendly products offers significant potential for bio-based and sustainable lubricant options. Furthermore, the expansion of automotive manufacturing and sales in developing APAC economies presents substantial growth potential.
Major Players in the APAC Automotive Lubricant Industry Ecosystem
- BP PLC (Castrol)
- CHEVRON CORPORATION
- China National Petroleum Corporation
- China Petroleum & Chemical Corporation
- ENEOS Corporation
- ExxonMobil Corporation
- GS Caltex
- Idemitsu Kosan Co Ltd
- Indian Oil Corporation Limited
- Motul
- PT Pertamina
- Royal Dutch Shell Plc
- TotalEnergies
Key Developments in APAC Automotive Lubricant Industry Industry
- October 2021: Castrol launched Castrol Power1 Ultimate, a 100% synthetic engine oil in Malaysia.
- December 2021: ExxonMobil introduced Mobil Super Pro synthetic engine oils for SUVs in India.
- January 2022: ExxonMobil reorganized into three business lines: Upstream Company, Product Solutions, and Low Carbon Solutions.
Strategic APAC Automotive Lubricant Industry Market Forecast
The APAC automotive lubricant market is poised for robust growth, driven by the expansion of the automotive sector and increasing demand for high-performance and eco-friendly lubricants. The forecast period will see continuous innovation in lubricant formulations, responding to evolving engine technologies and environmental regulations. Opportunities abound in emerging markets and segments, contributing to significant market expansion throughout the forecast period. The market is projected to witness considerable growth, driven by various factors like increasing vehicle sales, infrastructure development, and government initiatives promoting sustainable transportation.
APAC Automotive Lubricant Industry Segmentation
-
1. Vehicle Type
- 1.1. Commercial Vehicles
- 1.2. Motorcycles
- 1.3. Passenger Vehicles
-
2. Product Type
- 2.1. Engine Oils
- 2.2. Greases
- 2.3. Hydraulic Fluids
- 2.4. Transmission & Gear Oils
APAC Automotive Lubricant Industry Segmentation By Geography
-
1. North America
- 1.1. United States
- 1.2. Canada
- 1.3. Mexico
-
2. South America
- 2.1. Brazil
- 2.2. Argentina
- 2.3. Rest of South America
-
3. Europe
- 3.1. United Kingdom
- 3.2. Germany
- 3.3. France
- 3.4. Italy
- 3.5. Spain
- 3.6. Russia
- 3.7. Benelux
- 3.8. Nordics
- 3.9. Rest of Europe
-
4. Middle East & Africa
- 4.1. Turkey
- 4.2. Israel
- 4.3. GCC
- 4.4. North Africa
- 4.5. South Africa
- 4.6. Rest of Middle East & Africa
-
5. Asia Pacific
- 5.1. China
- 5.2. India
- 5.3. Japan
- 5.4. South Korea
- 5.5. ASEAN
- 5.6. Oceania
- 5.7. Rest of Asia Pacific
APAC Automotive Lubricant Industry REPORT HIGHLIGHTS
| Aspects | Details |
|---|---|
| Study Period | 2019-2033 |
| Base Year | 2024 |
| Estimated Year | 2025 |
| Forecast Period | 2025-2033 |
| Historical Period | 2019-2024 |
| Growth Rate | CAGR of 4.44% from 2019-2033 |
| Segmentation |
|
Table of Contents
- 1. Introduction
- 1.1. Research Scope
- 1.2. Market Segmentation
- 1.3. Research Methodology
- 1.4. Definitions and Assumptions
- 2. Executive Summary
- 2.1. Introduction
- 3. Market Dynamics
- 3.1. Introduction
- 3.2. Market Drivers
- 3.3. Market Restrains
- 3.4. Market Trends
- 3.4.1. Largest Segment By Vehicle Type
- 4. Market Factor Analysis
- 4.1. Porters Five Forces
- 4.2. Supply/Value Chain
- 4.3. PESTEL analysis
- 4.4. Market Entropy
- 4.5. Patent/Trademark Analysis
- 5. Global APAC Automotive Lubricant Industry Analysis, Insights and Forecast, 2019-2031
- 5.1. Market Analysis, Insights and Forecast - by Vehicle Type
- 5.1.1. Commercial Vehicles
- 5.1.2. Motorcycles
- 5.1.3. Passenger Vehicles
- 5.2. Market Analysis, Insights and Forecast - by Product Type
- 5.2.1. Engine Oils
- 5.2.2. Greases
- 5.2.3. Hydraulic Fluids
- 5.2.4. Transmission & Gear Oils
- 5.3. Market Analysis, Insights and Forecast - by Region
- 5.3.1. North America
- 5.3.2. South America
- 5.3.3. Europe
- 5.3.4. Middle East & Africa
- 5.3.5. Asia Pacific
- 5.1. Market Analysis, Insights and Forecast - by Vehicle Type
- 6. North America APAC Automotive Lubricant Industry Analysis, Insights and Forecast, 2019-2031
- 6.1. Market Analysis, Insights and Forecast - by Vehicle Type
- 6.1.1. Commercial Vehicles
- 6.1.2. Motorcycles
- 6.1.3. Passenger Vehicles
- 6.2. Market Analysis, Insights and Forecast - by Product Type
- 6.2.1. Engine Oils
- 6.2.2. Greases
- 6.2.3. Hydraulic Fluids
- 6.2.4. Transmission & Gear Oils
- 6.1. Market Analysis, Insights and Forecast - by Vehicle Type
- 7. South America APAC Automotive Lubricant Industry Analysis, Insights and Forecast, 2019-2031
- 7.1. Market Analysis, Insights and Forecast - by Vehicle Type
- 7.1.1. Commercial Vehicles
- 7.1.2. Motorcycles
- 7.1.3. Passenger Vehicles
- 7.2. Market Analysis, Insights and Forecast - by Product Type
- 7.2.1. Engine Oils
- 7.2.2. Greases
- 7.2.3. Hydraulic Fluids
- 7.2.4. Transmission & Gear Oils
- 7.1. Market Analysis, Insights and Forecast - by Vehicle Type
- 8. Europe APAC Automotive Lubricant Industry Analysis, Insights and Forecast, 2019-2031
- 8.1. Market Analysis, Insights and Forecast - by Vehicle Type
- 8.1.1. Commercial Vehicles
- 8.1.2. Motorcycles
- 8.1.3. Passenger Vehicles
- 8.2. Market Analysis, Insights and Forecast - by Product Type
- 8.2.1. Engine Oils
- 8.2.2. Greases
- 8.2.3. Hydraulic Fluids
- 8.2.4. Transmission & Gear Oils
- 8.1. Market Analysis, Insights and Forecast - by Vehicle Type
- 9. Middle East & Africa APAC Automotive Lubricant Industry Analysis, Insights and Forecast, 2019-2031
- 9.1. Market Analysis, Insights and Forecast - by Vehicle Type
- 9.1.1. Commercial Vehicles
- 9.1.2. Motorcycles
- 9.1.3. Passenger Vehicles
- 9.2. Market Analysis, Insights and Forecast - by Product Type
- 9.2.1. Engine Oils
- 9.2.2. Greases
- 9.2.3. Hydraulic Fluids
- 9.2.4. Transmission & Gear Oils
- 9.1. Market Analysis, Insights and Forecast - by Vehicle Type
- 10. Asia Pacific APAC Automotive Lubricant Industry Analysis, Insights and Forecast, 2019-2031
- 10.1. Market Analysis, Insights and Forecast - by Vehicle Type
- 10.1.1. Commercial Vehicles
- 10.1.2. Motorcycles
- 10.1.3. Passenger Vehicles
- 10.2. Market Analysis, Insights and Forecast - by Product Type
- 10.2.1. Engine Oils
- 10.2.2. Greases
- 10.2.3. Hydraulic Fluids
- 10.2.4. Transmission & Gear Oils
- 10.1. Market Analysis, Insights and Forecast - by Vehicle Type
- 11. Competitive Analysis
- 11.1. Global Market Share Analysis 2024
- 11.2. Company Profiles
- 11.2.1 BP PLC (Castrol)
- 11.2.1.1. Overview
- 11.2.1.2. Products
- 11.2.1.3. SWOT Analysis
- 11.2.1.4. Recent Developments
- 11.2.1.5. Financials (Based on Availability)
- 11.2.2 CHEVRON CORPORATION
- 11.2.2.1. Overview
- 11.2.2.2. Products
- 11.2.2.3. SWOT Analysis
- 11.2.2.4. Recent Developments
- 11.2.2.5. Financials (Based on Availability)
- 11.2.3 China National Petroleum Corporation
- 11.2.3.1. Overview
- 11.2.3.2. Products
- 11.2.3.3. SWOT Analysis
- 11.2.3.4. Recent Developments
- 11.2.3.5. Financials (Based on Availability)
- 11.2.4 China Petroleum & Chemical Corporation
- 11.2.4.1. Overview
- 11.2.4.2. Products
- 11.2.4.3. SWOT Analysis
- 11.2.4.4. Recent Developments
- 11.2.4.5. Financials (Based on Availability)
- 11.2.5 ENEOS Corporation
- 11.2.5.1. Overview
- 11.2.5.2. Products
- 11.2.5.3. SWOT Analysis
- 11.2.5.4. Recent Developments
- 11.2.5.5. Financials (Based on Availability)
- 11.2.6 ExxonMobil Corporation
- 11.2.6.1. Overview
- 11.2.6.2. Products
- 11.2.6.3. SWOT Analysis
- 11.2.6.4. Recent Developments
- 11.2.6.5. Financials (Based on Availability)
- 11.2.7 GS Caltex
- 11.2.7.1. Overview
- 11.2.7.2. Products
- 11.2.7.3. SWOT Analysis
- 11.2.7.4. Recent Developments
- 11.2.7.5. Financials (Based on Availability)
- 11.2.8 Idemitsu Kosan Co Ltd
- 11.2.8.1. Overview
- 11.2.8.2. Products
- 11.2.8.3. SWOT Analysis
- 11.2.8.4. Recent Developments
- 11.2.8.5. Financials (Based on Availability)
- 11.2.9 Indian Oil Corporation Limited
- 11.2.9.1. Overview
- 11.2.9.2. Products
- 11.2.9.3. SWOT Analysis
- 11.2.9.4. Recent Developments
- 11.2.9.5. Financials (Based on Availability)
- 11.2.10 Motul
- 11.2.10.1. Overview
- 11.2.10.2. Products
- 11.2.10.3. SWOT Analysis
- 11.2.10.4. Recent Developments
- 11.2.10.5. Financials (Based on Availability)
- 11.2.11 PT Pertamina
- 11.2.11.1. Overview
- 11.2.11.2. Products
- 11.2.11.3. SWOT Analysis
- 11.2.11.4. Recent Developments
- 11.2.11.5. Financials (Based on Availability)
- 11.2.12 Royal Dutch Shell Plc
- 11.2.12.1. Overview
- 11.2.12.2. Products
- 11.2.12.3. SWOT Analysis
- 11.2.12.4. Recent Developments
- 11.2.12.5. Financials (Based on Availability)
- 11.2.13 TotalEnergie
- 11.2.13.1. Overview
- 11.2.13.2. Products
- 11.2.13.3. SWOT Analysis
- 11.2.13.4. Recent Developments
- 11.2.13.5. Financials (Based on Availability)
- 11.2.1 BP PLC (Castrol)
List of Figures
- Figure 1: Global APAC Automotive Lubricant Industry Revenue Breakdown (Million, %) by Region 2024 & 2032
- Figure 2: North America APAC Automotive Lubricant Industry Revenue (Million), by Vehicle Type 2024 & 2032
- Figure 3: North America APAC Automotive Lubricant Industry Revenue Share (%), by Vehicle Type 2024 & 2032
- Figure 4: North America APAC Automotive Lubricant Industry Revenue (Million), by Product Type 2024 & 2032
- Figure 5: North America APAC Automotive Lubricant Industry Revenue Share (%), by Product Type 2024 & 2032
- Figure 6: North America APAC Automotive Lubricant Industry Revenue (Million), by Country 2024 & 2032
- Figure 7: North America APAC Automotive Lubricant Industry Revenue Share (%), by Country 2024 & 2032
- Figure 8: South America APAC Automotive Lubricant Industry Revenue (Million), by Vehicle Type 2024 & 2032
- Figure 9: South America APAC Automotive Lubricant Industry Revenue Share (%), by Vehicle Type 2024 & 2032
- Figure 10: South America APAC Automotive Lubricant Industry Revenue (Million), by Product Type 2024 & 2032
- Figure 11: South America APAC Automotive Lubricant Industry Revenue Share (%), by Product Type 2024 & 2032
- Figure 12: South America APAC Automotive Lubricant Industry Revenue (Million), by Country 2024 & 2032
- Figure 13: South America APAC Automotive Lubricant Industry Revenue Share (%), by Country 2024 & 2032
- Figure 14: Europe APAC Automotive Lubricant Industry Revenue (Million), by Vehicle Type 2024 & 2032
- Figure 15: Europe APAC Automotive Lubricant Industry Revenue Share (%), by Vehicle Type 2024 & 2032
- Figure 16: Europe APAC Automotive Lubricant Industry Revenue (Million), by Product Type 2024 & 2032
- Figure 17: Europe APAC Automotive Lubricant Industry Revenue Share (%), by Product Type 2024 & 2032
- Figure 18: Europe APAC Automotive Lubricant Industry Revenue (Million), by Country 2024 & 2032
- Figure 19: Europe APAC Automotive Lubricant Industry Revenue Share (%), by Country 2024 & 2032
- Figure 20: Middle East & Africa APAC Automotive Lubricant Industry Revenue (Million), by Vehicle Type 2024 & 2032
- Figure 21: Middle East & Africa APAC Automotive Lubricant Industry Revenue Share (%), by Vehicle Type 2024 & 2032
- Figure 22: Middle East & Africa APAC Automotive Lubricant Industry Revenue (Million), by Product Type 2024 & 2032
- Figure 23: Middle East & Africa APAC Automotive Lubricant Industry Revenue Share (%), by Product Type 2024 & 2032
- Figure 24: Middle East & Africa APAC Automotive Lubricant Industry Revenue (Million), by Country 2024 & 2032
- Figure 25: Middle East & Africa APAC Automotive Lubricant Industry Revenue Share (%), by Country 2024 & 2032
- Figure 26: Asia Pacific APAC Automotive Lubricant Industry Revenue (Million), by Vehicle Type 2024 & 2032
- Figure 27: Asia Pacific APAC Automotive Lubricant Industry Revenue Share (%), by Vehicle Type 2024 & 2032
- Figure 28: Asia Pacific APAC Automotive Lubricant Industry Revenue (Million), by Product Type 2024 & 2032
- Figure 29: Asia Pacific APAC Automotive Lubricant Industry Revenue Share (%), by Product Type 2024 & 2032
- Figure 30: Asia Pacific APAC Automotive Lubricant Industry Revenue (Million), by Country 2024 & 2032
- Figure 31: Asia Pacific APAC Automotive Lubricant Industry Revenue Share (%), by Country 2024 & 2032
List of Tables
- Table 1: Global APAC Automotive Lubricant Industry Revenue Million Forecast, by Region 2019 & 2032
- Table 2: Global APAC Automotive Lubricant Industry Revenue Million Forecast, by Vehicle Type 2019 & 2032
- Table 3: Global APAC Automotive Lubricant Industry Revenue Million Forecast, by Product Type 2019 & 2032
- Table 4: Global APAC Automotive Lubricant Industry Revenue Million Forecast, by Region 2019 & 2032
- Table 5: Global APAC Automotive Lubricant Industry Revenue Million Forecast, by Vehicle Type 2019 & 2032
- Table 6: Global APAC Automotive Lubricant Industry Revenue Million Forecast, by Product Type 2019 & 2032
- Table 7: Global APAC Automotive Lubricant Industry Revenue Million Forecast, by Country 2019 & 2032
- Table 8: United States APAC Automotive Lubricant Industry Revenue (Million) Forecast, by Application 2019 & 2032
- Table 9: Canada APAC Automotive Lubricant Industry Revenue (Million) Forecast, by Application 2019 & 2032
- Table 10: Mexico APAC Automotive Lubricant Industry Revenue (Million) Forecast, by Application 2019 & 2032
- Table 11: Global APAC Automotive Lubricant Industry Revenue Million Forecast, by Vehicle Type 2019 & 2032
- Table 12: Global APAC Automotive Lubricant Industry Revenue Million Forecast, by Product Type 2019 & 2032
- Table 13: Global APAC Automotive Lubricant Industry Revenue Million Forecast, by Country 2019 & 2032
- Table 14: Brazil APAC Automotive Lubricant Industry Revenue (Million) Forecast, by Application 2019 & 2032
- Table 15: Argentina APAC Automotive Lubricant Industry Revenue (Million) Forecast, by Application 2019 & 2032
- Table 16: Rest of South America APAC Automotive Lubricant Industry Revenue (Million) Forecast, by Application 2019 & 2032
- Table 17: Global APAC Automotive Lubricant Industry Revenue Million Forecast, by Vehicle Type 2019 & 2032
- Table 18: Global APAC Automotive Lubricant Industry Revenue Million Forecast, by Product Type 2019 & 2032
- Table 19: Global APAC Automotive Lubricant Industry Revenue Million Forecast, by Country 2019 & 2032
- Table 20: United Kingdom APAC Automotive Lubricant Industry Revenue (Million) Forecast, by Application 2019 & 2032
- Table 21: Germany APAC Automotive Lubricant Industry Revenue (Million) Forecast, by Application 2019 & 2032
- Table 22: France APAC Automotive Lubricant Industry Revenue (Million) Forecast, by Application 2019 & 2032
- Table 23: Italy APAC Automotive Lubricant Industry Revenue (Million) Forecast, by Application 2019 & 2032
- Table 24: Spain APAC Automotive Lubricant Industry Revenue (Million) Forecast, by Application 2019 & 2032
- Table 25: Russia APAC Automotive Lubricant Industry Revenue (Million) Forecast, by Application 2019 & 2032
- Table 26: Benelux APAC Automotive Lubricant Industry Revenue (Million) Forecast, by Application 2019 & 2032
- Table 27: Nordics APAC Automotive Lubricant Industry Revenue (Million) Forecast, by Application 2019 & 2032
- Table 28: Rest of Europe APAC Automotive Lubricant Industry Revenue (Million) Forecast, by Application 2019 & 2032
- Table 29: Global APAC Automotive Lubricant Industry Revenue Million Forecast, by Vehicle Type 2019 & 2032
- Table 30: Global APAC Automotive Lubricant Industry Revenue Million Forecast, by Product Type 2019 & 2032
- Table 31: Global APAC Automotive Lubricant Industry Revenue Million Forecast, by Country 2019 & 2032
- Table 32: Turkey APAC Automotive Lubricant Industry Revenue (Million) Forecast, by Application 2019 & 2032
- Table 33: Israel APAC Automotive Lubricant Industry Revenue (Million) Forecast, by Application 2019 & 2032
- Table 34: GCC APAC Automotive Lubricant Industry Revenue (Million) Forecast, by Application 2019 & 2032
- Table 35: North Africa APAC Automotive Lubricant Industry Revenue (Million) Forecast, by Application 2019 & 2032
- Table 36: South Africa APAC Automotive Lubricant Industry Revenue (Million) Forecast, by Application 2019 & 2032
- Table 37: Rest of Middle East & Africa APAC Automotive Lubricant Industry Revenue (Million) Forecast, by Application 2019 & 2032
- Table 38: Global APAC Automotive Lubricant Industry Revenue Million Forecast, by Vehicle Type 2019 & 2032
- Table 39: Global APAC Automotive Lubricant Industry Revenue Million Forecast, by Product Type 2019 & 2032
- Table 40: Global APAC Automotive Lubricant Industry Revenue Million Forecast, by Country 2019 & 2032
- Table 41: China APAC Automotive Lubricant Industry Revenue (Million) Forecast, by Application 2019 & 2032
- Table 42: India APAC Automotive Lubricant Industry Revenue (Million) Forecast, by Application 2019 & 2032
- Table 43: Japan APAC Automotive Lubricant Industry Revenue (Million) Forecast, by Application 2019 & 2032
- Table 44: South Korea APAC Automotive Lubricant Industry Revenue (Million) Forecast, by Application 2019 & 2032
- Table 45: ASEAN APAC Automotive Lubricant Industry Revenue (Million) Forecast, by Application 2019 & 2032
- Table 46: Oceania APAC Automotive Lubricant Industry Revenue (Million) Forecast, by Application 2019 & 2032
- Table 47: Rest of Asia Pacific APAC Automotive Lubricant Industry Revenue (Million) Forecast, by Application 2019 & 2032
Frequently Asked Questions
1. What is the projected Compound Annual Growth Rate (CAGR) of the APAC Automotive Lubricant Industry?
The projected CAGR is approximately 4.44%.
2. Which companies are prominent players in the APAC Automotive Lubricant Industry?
Key companies in the market include BP PLC (Castrol), CHEVRON CORPORATION, China National Petroleum Corporation, China Petroleum & Chemical Corporation, ENEOS Corporation, ExxonMobil Corporation, GS Caltex, Idemitsu Kosan Co Ltd, Indian Oil Corporation Limited, Motul, PT Pertamina, Royal Dutch Shell Plc, TotalEnergie.
3. What are the main segments of the APAC Automotive Lubricant Industry?
The market segments include Vehicle Type, Product Type.
4. Can you provide details about the market size?
The market size is estimated to be USD XX Million as of 2022.
5. What are some drivers contributing to market growth?
N/A
6. What are the notable trends driving market growth?
Largest Segment By Vehicle Type : Passenger Vehicles.
7. Are there any restraints impacting market growth?
N/A
8. Can you provide examples of recent developments in the market?
January 2022: Effective April 1, ExxonMobil Corporation was organized along three business lines - ExxonMobil Upstream Company, ExxonMobil Product Solutions and ExxonMobil Low Carbon Solutions.December 2021: ExxonMobil introduced a line of synthetic engine oils, i.e., Mobil Super Pro, for SUVs in India.October 2021: Castrol, one of Malaysia's major automotive lubricant manufacturers, introduced Castrol Power1 Ultimate, a brand-new type of 100% synthetic engine oil that promises exceptional performance and endurance.
9. What pricing options are available for accessing the report?
Pricing options include single-user, multi-user, and enterprise licenses priced at USD 4750, USD 4950, and USD 6800 respectively.
10. Is the market size provided in terms of value or volume?
The market size is provided in terms of value, measured in Million.
11. Are there any specific market keywords associated with the report?
Yes, the market keyword associated with the report is "APAC Automotive Lubricant Industry," which aids in identifying and referencing the specific market segment covered.
12. How do I determine which pricing option suits my needs best?
The pricing options vary based on user requirements and access needs. Individual users may opt for single-user licenses, while businesses requiring broader access may choose multi-user or enterprise licenses for cost-effective access to the report.
13. Are there any additional resources or data provided in the APAC Automotive Lubricant Industry report?
While the report offers comprehensive insights, it's advisable to review the specific contents or supplementary materials provided to ascertain if additional resources or data are available.
14. How can I stay updated on further developments or reports in the APAC Automotive Lubricant Industry?
To stay informed about further developments, trends, and reports in the APAC Automotive Lubricant Industry, consider subscribing to industry newsletters, following relevant companies and organizations, or regularly checking reputable industry news sources and publications.
Methodology
Step 1 - Identification of Relevant Samples Size from Population Database


Step 2 - Approaches for Defining Global Market Size (Value, Volume* & Price*)

Note*: In applicable scenarios
Step 3 - Data Sources
Primary Research
- Web Analytics
- Survey Reports
- Research Institute
- Latest Research Reports
- Opinion Leaders
Secondary Research
- Annual Reports
- White Paper
- Latest Press Release
- Industry Association
- Paid Database
- Investor Presentations

Step 4 - Data Triangulation
Involves using different sources of information in order to increase the validity of a study
These sources are likely to be stakeholders in a program - participants, other researchers, program staff, other community members, and so on.
Then we put all data in single framework & apply various statistical tools to find out the dynamic on the market.
During the analysis stage, feedback from the stakeholder groups would be compared to determine areas of agreement as well as areas of divergence
