

Key Insights
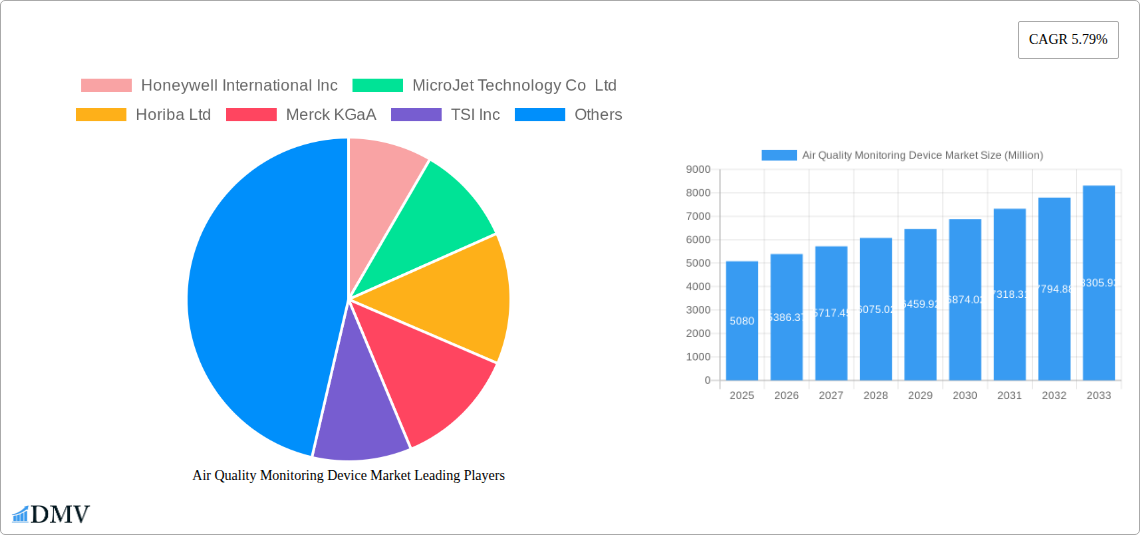
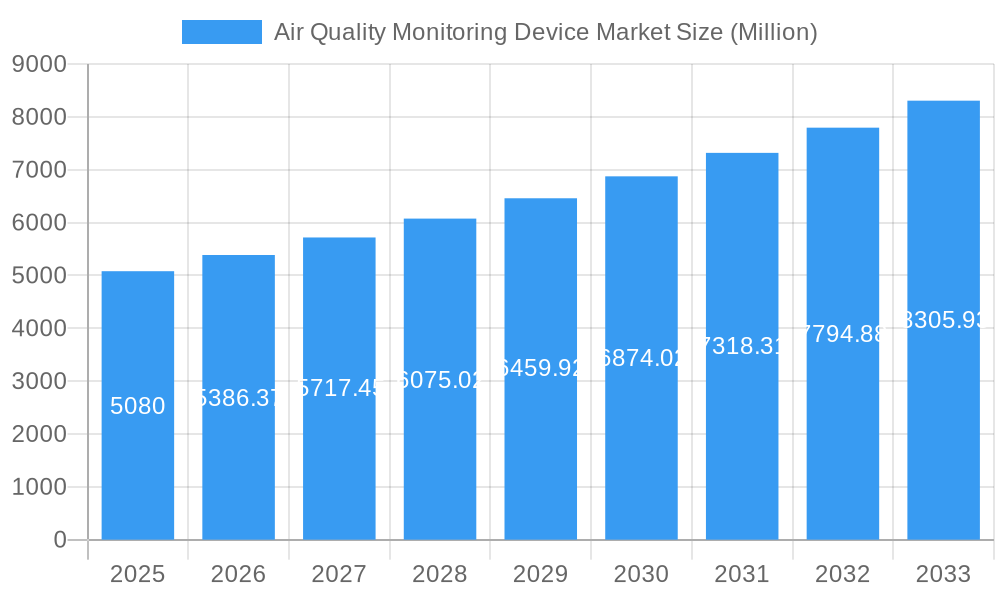
The Air Quality Monitoring Device market is experiencing robust growth, projected to reach \$5.08 billion in 2025 and maintain a Compound Annual Growth Rate (CAGR) of 5.79% from 2025 to 2033. This expansion is driven by increasing environmental concerns, stringent government regulations on air quality, and rising awareness among both residential and commercial sectors about the health impacts of poor air quality. The market is segmented by product type (indoor and outdoor monitors), sampling method (continuous, manual, and intermittent), and end-user (residential, commercial, power generation, petrochemicals, and others). The continuous monitoring segment is expected to dominate due to its ability to provide real-time data crucial for effective pollution control. Growth in the residential sector is fueled by increasing disposable incomes and a growing preference for smart home technologies. The commercial and industrial sectors, particularly power generation and petrochemicals, are key drivers due to regulatory compliance needs and the importance of process optimization and environmental responsibility. North America and Asia-Pacific regions are anticipated to lead the market, driven by high adoption rates and technological advancements in these areas. However, the high initial investment cost associated with advanced monitoring systems might act as a restraint in some developing regions. Key players like Honeywell, Horiba, Thermo Fisher Scientific, and others are actively contributing to market growth through product innovation and strategic partnerships.
Air Quality Monitoring Device Market Market Size (In Billion)
The competitive landscape is characterized by both established players and emerging companies focused on developing advanced, user-friendly, and cost-effective air quality monitoring solutions. Technological advancements, such as the integration of IoT and AI capabilities into monitoring devices, are further accelerating market growth. Future growth will be influenced by the development of more sophisticated sensors, advancements in data analytics and reporting, and increased investment in air quality infrastructure. Government initiatives promoting clean air and the development of sustainable technologies will also play a critical role in shaping the market trajectory. The increasing use of air quality monitoring in smart cities and the growing emphasis on public health are contributing positively to the market outlook. Furthermore, the development of portable and easy-to-use monitoring devices is expected to expand the market reach.
Air Quality Monitoring Device Market Company Market Share
Air Quality Monitoring Device Market: A Comprehensive Report (2019-2033)
This insightful report provides a detailed analysis of the Air Quality Monitoring Device market, encompassing market size, trends, leading players, and future forecasts. With a study period spanning 2019-2033, a base year of 2025, and an estimated year of 2025, this report offers invaluable insights for stakeholders seeking to understand and capitalize on this dynamic market. The market is projected to reach xx Million by 2033, exhibiting substantial growth throughout the forecast period (2025-2033).
Air Quality Monitoring Device Market Composition & Trends
This section delves into the competitive landscape of the air quality monitoring device market, evaluating market concentration, innovation drivers, regulatory influences, substitute products, end-user profiles, and mergers & acquisitions (M&A) activities. The market exhibits a moderately concentrated structure, with key players such as Honeywell International Inc., Thermo Fisher Scientific Inc., and Siemens AG holding significant market share. However, the emergence of innovative smaller companies and increased M&A activity signifies a dynamic competitive landscape. The total value of M&A deals in the sector from 2019 to 2024 is estimated to be xx Million.
Key Aspects Analyzed:
- Market Share Distribution: A detailed breakdown of market share held by leading companies.
- Innovation Catalysts: Analysis of technological advancements driving market growth, including improvements in sensor technology, data analytics capabilities, and connectivity.
- Regulatory Landscape: Assessment of government regulations and policies influencing market growth across different regions.
- Substitute Products: Evaluation of alternative technologies and their potential impact on market demand.
- End-User Profiles: Detailed analysis of market segmentation across residential & commercial, power generation, petrochemicals, and other end users, identifying key needs and purchasing patterns.
- M&A Activity: Review of significant mergers, acquisitions, and partnerships, including their impact on market dynamics and competitive positioning. The average deal value from 2019-2024 is estimated at xx Million.
Air Quality Monitoring Device Market Industry Evolution
The Air Quality Monitoring Device market is experiencing dynamic growth, shaped by a confluence of escalating environmental awareness, increasingly stringent global air quality regulations, and a surge in demand for precise, real-time environmental data. This evolution is characterized by robust expansion, fueled by the critical need to understand and mitigate the health and environmental impacts of airborne pollutants. Projections indicate a Compound Annual Growth Rate (CAGR) of approximately XX% for the period spanning 2019-2024, with an even more accelerated growth anticipated at XX% CAGR from 2025-2033. Technological advancements are at the forefront of this transformation, with the seamless integration of the Internet of Things (IoT) and Artificial Intelligence (AI) revolutionizing device capabilities, enabling sophisticated data analysis and predictive insights. Consequently, the adoption of advanced, continuous monitoring systems has seen a significant upward trend, reflecting the market's maturity and its commitment to proactive environmental stewardship.
Leading Regions, Countries, or Segments in Air Quality Monitoring Device Market
This section identifies the dominant regions, countries, and segments within the Air Quality Monitoring Device market. The analysis considers product type (indoor vs. outdoor monitors), sampling method (continuous, manual, intermittent), and end-user segments (residential & commercial, power generation, petrochemicals, others).
Key Drivers:
- North America: Strong regulatory support, high awareness of air pollution, and robust infrastructure.
- Europe: Stringent environmental regulations, increasing government investments in air quality monitoring, and growing adoption of smart cities initiatives.
- Asia-Pacific: Rapid urbanization, industrialization, and rising air pollution levels, coupled with increasing investments in environmental monitoring.
- Continuous Monitoring Systems: High accuracy, real-time data, and comprehensive monitoring capabilities.
- Industrial End-Users: Stricter emission standards, need for compliance monitoring, and proactive environmental management.
Dominance Factors: The dominance of certain regions and segments is primarily attributed to factors such as stringent environmental regulations, high levels of air pollution, significant government investments in air quality monitoring infrastructure, and the increasing adoption of smart city initiatives.
Air Quality Monitoring Device Market Product Innovations
Innovation in the Air Quality Monitoring Device sector is primarily driven by the pursuit of enhanced accuracy, greater portability, ubiquitous connectivity, and sophisticated data analytics. The miniaturization of sensor technology, coupled with the deep integration of IoT platforms, allows for the deployment of more discreet and widespread monitoring networks. Advanced algorithms are crucial for interpreting the vast amounts of data generated, providing actionable insights for users. Key differentiators emerging in the market include intuitive real-time data visualization dashboards, predictive maintenance features that ensure device reliability, and robust remote monitoring capabilities. Furthermore, the development of cost-effective, user-friendly devices is democratizing access to air quality data, significantly expanding the market's reach into residential and community settings.
Propelling Factors for Air Quality Monitoring Device Market Growth
The Air Quality Monitoring Device market is propelled by a confluence of factors: rising environmental concerns and stricter government regulations demanding improved air quality, technological advancements leading to more accurate, efficient, and affordable devices, growing awareness among consumers about the health risks associated with poor air quality, and increased investments in smart cities and industrial environmental management systems.
Obstacles in the Air Quality Monitoring Device Market
Despite significant growth potential, the Air Quality Monitoring Device market faces several challenges: high initial investment costs for sophisticated monitoring systems, interoperability issues among various devices and platforms, data security and privacy concerns associated with connected devices, and potential supply chain disruptions impacting the availability of components. Furthermore, the need for skilled personnel to operate and maintain these systems presents a barrier to adoption, particularly in developing regions. The total impact of these challenges is estimated to reduce the market size by xx Million annually.
Future Opportunities in Air Quality Monitoring Device Market
Emerging opportunities include the expansion into developing economies with increasing air pollution problems, integration with smart city infrastructure and IoT networks, development of specialized devices for monitoring specific pollutants, and the use of artificial intelligence and machine learning for predictive analytics. Furthermore, the increasing demand for portable and personal air quality monitors presents a promising area of growth.
Major Players in the Air Quality Monitoring Device Market Ecosystem
- Honeywell International Inc. (Honeywell)
- MicroJet Technology Co Ltd
- Horiba Ltd (Horiba)
- Merck KGaA (Merck)
- TSI Inc. (TSI)
- Thermo Fisher Scientific Inc. (Thermo Fisher Scientific)
- Hawa Dawa GmbH
- Emerson Electric Co (Emerson)
- Siemens AG (Siemens)
- Agilent Technologies Inc. (Agilent Technologies)
- 3M Co (3M)
- Teledyne Technologies Inc. (Teledyne Technologies)
Key Developments in Air Quality Monitoring Device Market Industry
- March 2023: Tyndall National Institute's significant contribution to a pioneering European project aimed at advancing air quality monitoring capabilities, bolstered by substantial European Commission funding for their research endeavors.
- February 2022: Hawa Dawa's strategic alliance with Thies Clima, creating a powerful synergy to deliver comprehensive integrated solutions that combine detailed air quality data with precise meteorological information, offering a holistic environmental monitoring perspective.
Strategic Air Quality Monitoring Device Market Forecast
The Air Quality Monitoring Device market is poised for continued growth, driven by increasing environmental awareness, stringent regulations, and technological advancements. The market's future potential is substantial, particularly in developing economies and emerging applications such as personal air quality monitoring and integration with smart city infrastructure. The increasing demand for accurate, real-time, and accessible air quality data will fuel market expansion throughout the forecast period.
Air Quality Monitoring Device Market Segmentation
-
1. Product Type
- 1.1. Indoor Monitor
- 1.2. Outdoor Monitor
-
2. Sampling Method
- 2.1. Continuous
- 2.2. Manual
- 2.3. Intermittent
-
3. End User
- 3.1. Residential and Commercial
- 3.2. Power Generation
- 3.3. Petrochemicals
- 3.4. Other End Users
Air Quality Monitoring Device Market Segmentation By Geography
-
1. North America
- 1.1. United States
- 1.2. Canada
- 1.3. Rest of the North America
-
2. Europe
- 2.1. United Kingdom
- 2.2. Spain
- 2.3. Germany
- 2.4. Italy
-
3. Asia
- 3.1. China
- 3.2. Japan
- 3.3. Vietnam
- 3.4. India
- 3.5. Australia and New Zealand
-
4. South America
- 4.1. Brazil
- 4.2. Argentina
-
5. Middle East and Africa
- 5.1. United Arab Emirates
- 5.2. South Africa
- 5.3. Saudi Arabia
- 5.4. Iraq
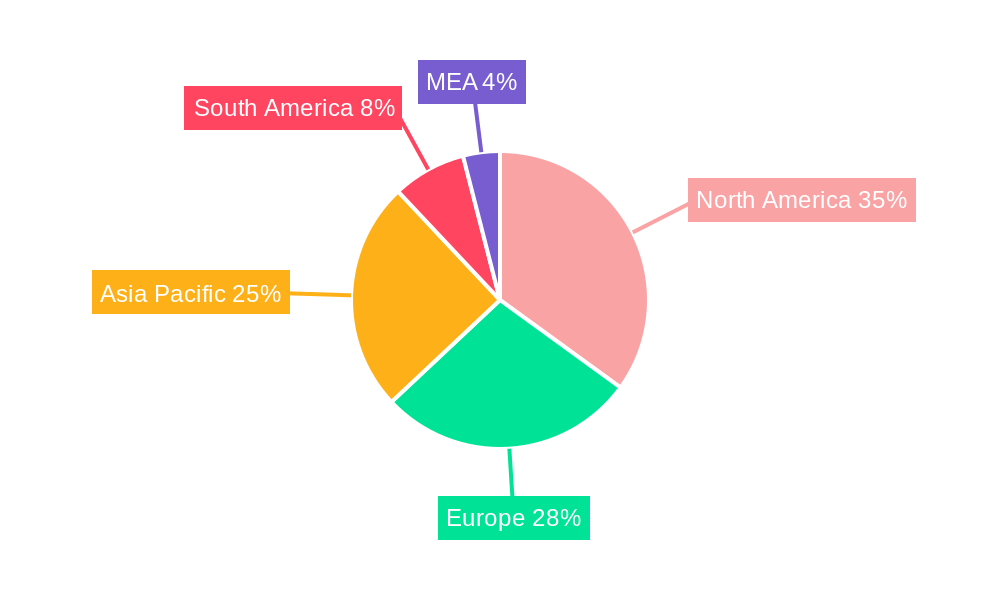
Air Quality Monitoring Device Market Regional Market Share
Geographic Coverage of Air Quality Monitoring Device Market
Air Quality Monitoring Device Market REPORT HIGHLIGHTS
| Aspects | Details |
|---|---|
| Study Period | 2020-2034 |
| Base Year | 2025 |
| Estimated Year | 2026 |
| Forecast Period | 2026-2034 |
| Historical Period | 2020-2025 |
| Growth Rate | CAGR of 5.79% from 2020-2034 |
| Segmentation |
|
Table of Contents
- 1. Introduction
- 1.1. Research Scope
- 1.2. Market Segmentation
- 1.3. Research Objective
- 1.4. Definitions and Assumptions
- 2. Executive Summary
- 2.1. Market Snapshot
- 3. Market Dynamics
- 3.1. Market Drivers
- 3.2. Market Restrains
- 3.3. Market Trends
- 3.4. Market Opportunities
- 4. Market Factor Analysis
- 4.1. Porters Five Forces
- 4.1.1. Bargaining Power of Suppliers
- 4.1.2. Bargaining Power of Buyers
- 4.1.3. Threat of New Entrants
- 4.1.4. Threat of Substitutes
- 4.1.5. Competitive Rivalry
- 4.2. PESTEL analysis
- 4.3. BCG Analysis
- 4.3.1. Stars (High Growth, High Market Share)
- 4.3.2. Cash Cows (Low Growth, High Market Share)
- 4.3.3. Question Mark (High Growth, Low Market Share)
- 4.3.4. Dogs (Low Growth, Low Market Share)
- 4.4. Ansoff Matrix Analysis
- 4.5. Supply Chain Analysis
- 4.6. Regulatory Landscape
- 4.7. Current Market Potential and Opportunity Assessment (TAM–SAM–SOM Framework)
- 4.8. DMV Analyst Note
- 4.1. Porters Five Forces
- 5. Market Analysis, Insights and Forecast 2021-2033
- 5.1. Market Analysis, Insights and Forecast - by Product Type
- 5.1.1. Indoor Monitor
- 5.1.2. Outdoor Monitor
- 5.2. Market Analysis, Insights and Forecast - by Sampling Method
- 5.2.1. Continuous
- 5.2.2. Manual
- 5.2.3. Intermittent
- 5.3. Market Analysis, Insights and Forecast - by End User
- 5.3.1. Residential and Commercial
- 5.3.2. Power Generation
- 5.3.3. Petrochemicals
- 5.3.4. Other End Users
- 5.4. Market Analysis, Insights and Forecast - by Region
- 5.4.1. North America
- 5.4.2. Europe
- 5.4.3. Asia
- 5.4.4. South America
- 5.4.5. Middle East and Africa
- 5.1. Market Analysis, Insights and Forecast - by Product Type
- 6. Global Air Quality Monitoring Device Market Analysis, Insights and Forecast, 2021-2033
- 6.1. Market Analysis, Insights and Forecast - by Product Type
- 6.1.1. Indoor Monitor
- 6.1.2. Outdoor Monitor
- 6.2. Market Analysis, Insights and Forecast - by Sampling Method
- 6.2.1. Continuous
- 6.2.2. Manual
- 6.2.3. Intermittent
- 6.3. Market Analysis, Insights and Forecast - by End User
- 6.3.1. Residential and Commercial
- 6.3.2. Power Generation
- 6.3.3. Petrochemicals
- 6.3.4. Other End Users
- 6.1. Market Analysis, Insights and Forecast - by Product Type
- 7. North America Air Quality Monitoring Device Market Analysis, Insights and Forecast, 2020-2032
- 7.1. Market Analysis, Insights and Forecast - by Product Type
- 7.1.1. Indoor Monitor
- 7.1.2. Outdoor Monitor
- 7.2. Market Analysis, Insights and Forecast - by Sampling Method
- 7.2.1. Continuous
- 7.2.2. Manual
- 7.2.3. Intermittent
- 7.3. Market Analysis, Insights and Forecast - by End User
- 7.3.1. Residential and Commercial
- 7.3.2. Power Generation
- 7.3.3. Petrochemicals
- 7.3.4. Other End Users
- 7.1. Market Analysis, Insights and Forecast - by Product Type
- 8. Europe Air Quality Monitoring Device Market Analysis, Insights and Forecast, 2020-2032
- 8.1. Market Analysis, Insights and Forecast - by Product Type
- 8.1.1. Indoor Monitor
- 8.1.2. Outdoor Monitor
- 8.2. Market Analysis, Insights and Forecast - by Sampling Method
- 8.2.1. Continuous
- 8.2.2. Manual
- 8.2.3. Intermittent
- 8.3. Market Analysis, Insights and Forecast - by End User
- 8.3.1. Residential and Commercial
- 8.3.2. Power Generation
- 8.3.3. Petrochemicals
- 8.3.4. Other End Users
- 8.1. Market Analysis, Insights and Forecast - by Product Type
- 9. Asia Air Quality Monitoring Device Market Analysis, Insights and Forecast, 2020-2032
- 9.1. Market Analysis, Insights and Forecast - by Product Type
- 9.1.1. Indoor Monitor
- 9.1.2. Outdoor Monitor
- 9.2. Market Analysis, Insights and Forecast - by Sampling Method
- 9.2.1. Continuous
- 9.2.2. Manual
- 9.2.3. Intermittent
- 9.3. Market Analysis, Insights and Forecast - by End User
- 9.3.1. Residential and Commercial
- 9.3.2. Power Generation
- 9.3.3. Petrochemicals
- 9.3.4. Other End Users
- 9.1. Market Analysis, Insights and Forecast - by Product Type
- 10. South America Air Quality Monitoring Device Market Analysis, Insights and Forecast, 2020-2032
- 10.1. Market Analysis, Insights and Forecast - by Product Type
- 10.1.1. Indoor Monitor
- 10.1.2. Outdoor Monitor
- 10.2. Market Analysis, Insights and Forecast - by Sampling Method
- 10.2.1. Continuous
- 10.2.2. Manual
- 10.2.3. Intermittent
- 10.3. Market Analysis, Insights and Forecast - by End User
- 10.3.1. Residential and Commercial
- 10.3.2. Power Generation
- 10.3.3. Petrochemicals
- 10.3.4. Other End Users
- 10.1. Market Analysis, Insights and Forecast - by Product Type
- 11. Middle East and Africa Air Quality Monitoring Device Market Analysis, Insights and Forecast, 2020-2032
- 11.1. Market Analysis, Insights and Forecast - by Product Type
- 11.1.1. Indoor Monitor
- 11.1.2. Outdoor Monitor
- 11.2. Market Analysis, Insights and Forecast - by Sampling Method
- 11.2.1. Continuous
- 11.2.2. Manual
- 11.2.3. Intermittent
- 11.3. Market Analysis, Insights and Forecast - by End User
- 11.3.1. Residential and Commercial
- 11.3.2. Power Generation
- 11.3.3. Petrochemicals
- 11.3.4. Other End Users
- 11.1. Market Analysis, Insights and Forecast - by Product Type
- 12. Competitive Analysis
- 12.1. Company Profiles
- 12.1.1 Honeywell International Inc
- 12.1.1.1. Company Overview
- 12.1.1.2. Products
- 12.1.1.3. Company Financials
- 12.1.1.4. SWOT Analysis
- 12.1.2 MicroJet Technology Co Ltd
- 12.1.2.1. Company Overview
- 12.1.2.2. Products
- 12.1.2.3. Company Financials
- 12.1.2.4. SWOT Analysis
- 12.1.3 Horiba Ltd
- 12.1.3.1. Company Overview
- 12.1.3.2. Products
- 12.1.3.3. Company Financials
- 12.1.3.4. SWOT Analysis
- 12.1.4 Merck KGaA
- 12.1.4.1. Company Overview
- 12.1.4.2. Products
- 12.1.4.3. Company Financials
- 12.1.4.4. SWOT Analysis
- 12.1.5 TSI Inc
- 12.1.5.1. Company Overview
- 12.1.5.2. Products
- 12.1.5.3. Company Financials
- 12.1.5.4. SWOT Analysis
- 12.1.6 Thermo Fisher Scientific Inc
- 12.1.6.1. Company Overview
- 12.1.6.2. Products
- 12.1.6.3. Company Financials
- 12.1.6.4. SWOT Analysis
- 12.1.7 Hawa Dawa GmbH
- 12.1.7.1. Company Overview
- 12.1.7.2. Products
- 12.1.7.3. Company Financials
- 12.1.7.4. SWOT Analysis
- 12.1.8 Emerson Electric Co
- 12.1.8.1. Company Overview
- 12.1.8.2. Products
- 12.1.8.3. Company Financials
- 12.1.8.4. SWOT Analysis
- 12.1.9 Siemens AG
- 12.1.9.1. Company Overview
- 12.1.9.2. Products
- 12.1.9.3. Company Financials
- 12.1.9.4. SWOT Analysis
- 12.1.10 Agilent Technologies Inc
- 12.1.10.1. Company Overview
- 12.1.10.2. Products
- 12.1.10.3. Company Financials
- 12.1.10.4. SWOT Analysis
- 12.1.11 3M Co
- 12.1.11.1. Company Overview
- 12.1.11.2. Products
- 12.1.11.3. Company Financials
- 12.1.11.4. SWOT Analysis
- 12.1.12 Teledyne Technologies Inc
- 12.1.12.1. Company Overview
- 12.1.12.2. Products
- 12.1.12.3. Company Financials
- 12.1.12.4. SWOT Analysis
- 12.1.1 Honeywell International Inc
- 12.2. Market Entropy
- 12.2.1 Company's Key Areas Served
- 12.2.2 Recent Developments
- 12.3. Company Market Share Analysis 2025
- 12.3.1 Top 5 Companies Market Share Analysis
- 12.3.2 Top 3 Companies Market Share Analysis
- 12.4. List of Potential Customers
- 13. Research Methodology
List of Figures
- Figure 1: Global Air Quality Monitoring Device Market Revenue Breakdown (Million, %) by Region 2025 & 2033
- Figure 2: Global Air Quality Monitoring Device Market Volume Breakdown (K Units, %) by Region 2025 & 2033
- Figure 3: North America Air Quality Monitoring Device Market Revenue (Million), by Product Type 2025 & 2033
- Figure 4: North America Air Quality Monitoring Device Market Volume (K Units), by Product Type 2025 & 2033
- Figure 5: North America Air Quality Monitoring Device Market Revenue Share (%), by Product Type 2025 & 2033
- Figure 6: North America Air Quality Monitoring Device Market Volume Share (%), by Product Type 2025 & 2033
- Figure 7: North America Air Quality Monitoring Device Market Revenue (Million), by Sampling Method 2025 & 2033
- Figure 8: North America Air Quality Monitoring Device Market Volume (K Units), by Sampling Method 2025 & 2033
- Figure 9: North America Air Quality Monitoring Device Market Revenue Share (%), by Sampling Method 2025 & 2033
- Figure 10: North America Air Quality Monitoring Device Market Volume Share (%), by Sampling Method 2025 & 2033
- Figure 11: North America Air Quality Monitoring Device Market Revenue (Million), by End User 2025 & 2033
- Figure 12: North America Air Quality Monitoring Device Market Volume (K Units), by End User 2025 & 2033
- Figure 13: North America Air Quality Monitoring Device Market Revenue Share (%), by End User 2025 & 2033
- Figure 14: North America Air Quality Monitoring Device Market Volume Share (%), by End User 2025 & 2033
- Figure 15: North America Air Quality Monitoring Device Market Revenue (Million), by Country 2025 & 2033
- Figure 16: North America Air Quality Monitoring Device Market Volume (K Units), by Country 2025 & 2033
- Figure 17: North America Air Quality Monitoring Device Market Revenue Share (%), by Country 2025 & 2033
- Figure 18: North America Air Quality Monitoring Device Market Volume Share (%), by Country 2025 & 2033
- Figure 19: Europe Air Quality Monitoring Device Market Revenue (Million), by Product Type 2025 & 2033
- Figure 20: Europe Air Quality Monitoring Device Market Volume (K Units), by Product Type 2025 & 2033
- Figure 21: Europe Air Quality Monitoring Device Market Revenue Share (%), by Product Type 2025 & 2033
- Figure 22: Europe Air Quality Monitoring Device Market Volume Share (%), by Product Type 2025 & 2033
- Figure 23: Europe Air Quality Monitoring Device Market Revenue (Million), by Sampling Method 2025 & 2033
- Figure 24: Europe Air Quality Monitoring Device Market Volume (K Units), by Sampling Method 2025 & 2033
- Figure 25: Europe Air Quality Monitoring Device Market Revenue Share (%), by Sampling Method 2025 & 2033
- Figure 26: Europe Air Quality Monitoring Device Market Volume Share (%), by Sampling Method 2025 & 2033
- Figure 27: Europe Air Quality Monitoring Device Market Revenue (Million), by End User 2025 & 2033
- Figure 28: Europe Air Quality Monitoring Device Market Volume (K Units), by End User 2025 & 2033
- Figure 29: Europe Air Quality Monitoring Device Market Revenue Share (%), by End User 2025 & 2033
- Figure 30: Europe Air Quality Monitoring Device Market Volume Share (%), by End User 2025 & 2033
- Figure 31: Europe Air Quality Monitoring Device Market Revenue (Million), by Country 2025 & 2033
- Figure 32: Europe Air Quality Monitoring Device Market Volume (K Units), by Country 2025 & 2033
- Figure 33: Europe Air Quality Monitoring Device Market Revenue Share (%), by Country 2025 & 2033
- Figure 34: Europe Air Quality Monitoring Device Market Volume Share (%), by Country 2025 & 2033
- Figure 35: Asia Air Quality Monitoring Device Market Revenue (Million), by Product Type 2025 & 2033
- Figure 36: Asia Air Quality Monitoring Device Market Volume (K Units), by Product Type 2025 & 2033
- Figure 37: Asia Air Quality Monitoring Device Market Revenue Share (%), by Product Type 2025 & 2033
- Figure 38: Asia Air Quality Monitoring Device Market Volume Share (%), by Product Type 2025 & 2033
- Figure 39: Asia Air Quality Monitoring Device Market Revenue (Million), by Sampling Method 2025 & 2033
- Figure 40: Asia Air Quality Monitoring Device Market Volume (K Units), by Sampling Method 2025 & 2033
- Figure 41: Asia Air Quality Monitoring Device Market Revenue Share (%), by Sampling Method 2025 & 2033
- Figure 42: Asia Air Quality Monitoring Device Market Volume Share (%), by Sampling Method 2025 & 2033
- Figure 43: Asia Air Quality Monitoring Device Market Revenue (Million), by End User 2025 & 2033
- Figure 44: Asia Air Quality Monitoring Device Market Volume (K Units), by End User 2025 & 2033
- Figure 45: Asia Air Quality Monitoring Device Market Revenue Share (%), by End User 2025 & 2033
- Figure 46: Asia Air Quality Monitoring Device Market Volume Share (%), by End User 2025 & 2033
- Figure 47: Asia Air Quality Monitoring Device Market Revenue (Million), by Country 2025 & 2033
- Figure 48: Asia Air Quality Monitoring Device Market Volume (K Units), by Country 2025 & 2033
- Figure 49: Asia Air Quality Monitoring Device Market Revenue Share (%), by Country 2025 & 2033
- Figure 50: Asia Air Quality Monitoring Device Market Volume Share (%), by Country 2025 & 2033
- Figure 51: South America Air Quality Monitoring Device Market Revenue (Million), by Product Type 2025 & 2033
- Figure 52: South America Air Quality Monitoring Device Market Volume (K Units), by Product Type 2025 & 2033
- Figure 53: South America Air Quality Monitoring Device Market Revenue Share (%), by Product Type 2025 & 2033
- Figure 54: South America Air Quality Monitoring Device Market Volume Share (%), by Product Type 2025 & 2033
- Figure 55: South America Air Quality Monitoring Device Market Revenue (Million), by Sampling Method 2025 & 2033
- Figure 56: South America Air Quality Monitoring Device Market Volume (K Units), by Sampling Method 2025 & 2033
- Figure 57: South America Air Quality Monitoring Device Market Revenue Share (%), by Sampling Method 2025 & 2033
- Figure 58: South America Air Quality Monitoring Device Market Volume Share (%), by Sampling Method 2025 & 2033
- Figure 59: South America Air Quality Monitoring Device Market Revenue (Million), by End User 2025 & 2033
- Figure 60: South America Air Quality Monitoring Device Market Volume (K Units), by End User 2025 & 2033
- Figure 61: South America Air Quality Monitoring Device Market Revenue Share (%), by End User 2025 & 2033
- Figure 62: South America Air Quality Monitoring Device Market Volume Share (%), by End User 2025 & 2033
- Figure 63: South America Air Quality Monitoring Device Market Revenue (Million), by Country 2025 & 2033
- Figure 64: South America Air Quality Monitoring Device Market Volume (K Units), by Country 2025 & 2033
- Figure 65: South America Air Quality Monitoring Device Market Revenue Share (%), by Country 2025 & 2033
- Figure 66: South America Air Quality Monitoring Device Market Volume Share (%), by Country 2025 & 2033
- Figure 67: Middle East and Africa Air Quality Monitoring Device Market Revenue (Million), by Product Type 2025 & 2033
- Figure 68: Middle East and Africa Air Quality Monitoring Device Market Volume (K Units), by Product Type 2025 & 2033
- Figure 69: Middle East and Africa Air Quality Monitoring Device Market Revenue Share (%), by Product Type 2025 & 2033
- Figure 70: Middle East and Africa Air Quality Monitoring Device Market Volume Share (%), by Product Type 2025 & 2033
- Figure 71: Middle East and Africa Air Quality Monitoring Device Market Revenue (Million), by Sampling Method 2025 & 2033
- Figure 72: Middle East and Africa Air Quality Monitoring Device Market Volume (K Units), by Sampling Method 2025 & 2033
- Figure 73: Middle East and Africa Air Quality Monitoring Device Market Revenue Share (%), by Sampling Method 2025 & 2033
- Figure 74: Middle East and Africa Air Quality Monitoring Device Market Volume Share (%), by Sampling Method 2025 & 2033
- Figure 75: Middle East and Africa Air Quality Monitoring Device Market Revenue (Million), by End User 2025 & 2033
- Figure 76: Middle East and Africa Air Quality Monitoring Device Market Volume (K Units), by End User 2025 & 2033
- Figure 77: Middle East and Africa Air Quality Monitoring Device Market Revenue Share (%), by End User 2025 & 2033
- Figure 78: Middle East and Africa Air Quality Monitoring Device Market Volume Share (%), by End User 2025 & 2033
- Figure 79: Middle East and Africa Air Quality Monitoring Device Market Revenue (Million), by Country 2025 & 2033
- Figure 80: Middle East and Africa Air Quality Monitoring Device Market Volume (K Units), by Country 2025 & 2033
- Figure 81: Middle East and Africa Air Quality Monitoring Device Market Revenue Share (%), by Country 2025 & 2033
- Figure 82: Middle East and Africa Air Quality Monitoring Device Market Volume Share (%), by Country 2025 & 2033
List of Tables
- Table 1: Global Air Quality Monitoring Device Market Revenue Million Forecast, by Product Type 2020 & 2033
- Table 2: Global Air Quality Monitoring Device Market Volume K Units Forecast, by Product Type 2020 & 2033
- Table 3: Global Air Quality Monitoring Device Market Revenue Million Forecast, by Sampling Method 2020 & 2033
- Table 4: Global Air Quality Monitoring Device Market Volume K Units Forecast, by Sampling Method 2020 & 2033
- Table 5: Global Air Quality Monitoring Device Market Revenue Million Forecast, by End User 2020 & 2033
- Table 6: Global Air Quality Monitoring Device Market Volume K Units Forecast, by End User 2020 & 2033
- Table 7: Global Air Quality Monitoring Device Market Revenue Million Forecast, by Region 2020 & 2033
- Table 8: Global Air Quality Monitoring Device Market Volume K Units Forecast, by Region 2020 & 2033
- Table 9: Global Air Quality Monitoring Device Market Revenue Million Forecast, by Product Type 2020 & 2033
- Table 10: Global Air Quality Monitoring Device Market Volume K Units Forecast, by Product Type 2020 & 2033
- Table 11: Global Air Quality Monitoring Device Market Revenue Million Forecast, by Sampling Method 2020 & 2033
- Table 12: Global Air Quality Monitoring Device Market Volume K Units Forecast, by Sampling Method 2020 & 2033
- Table 13: Global Air Quality Monitoring Device Market Revenue Million Forecast, by End User 2020 & 2033
- Table 14: Global Air Quality Monitoring Device Market Volume K Units Forecast, by End User 2020 & 2033
- Table 15: Global Air Quality Monitoring Device Market Revenue Million Forecast, by Country 2020 & 2033
- Table 16: Global Air Quality Monitoring Device Market Volume K Units Forecast, by Country 2020 & 2033
- Table 17: United States Air Quality Monitoring Device Market Revenue (Million) Forecast, by Application 2020 & 2033
- Table 18: United States Air Quality Monitoring Device Market Volume (K Units) Forecast, by Application 2020 & 2033
- Table 19: Canada Air Quality Monitoring Device Market Revenue (Million) Forecast, by Application 2020 & 2033
- Table 20: Canada Air Quality Monitoring Device Market Volume (K Units) Forecast, by Application 2020 & 2033
- Table 21: Rest of the North America Air Quality Monitoring Device Market Revenue (Million) Forecast, by Application 2020 & 2033
- Table 22: Rest of the North America Air Quality Monitoring Device Market Volume (K Units) Forecast, by Application 2020 & 2033
- Table 23: Global Air Quality Monitoring Device Market Revenue Million Forecast, by Product Type 2020 & 2033
- Table 24: Global Air Quality Monitoring Device Market Volume K Units Forecast, by Product Type 2020 & 2033
- Table 25: Global Air Quality Monitoring Device Market Revenue Million Forecast, by Sampling Method 2020 & 2033
- Table 26: Global Air Quality Monitoring Device Market Volume K Units Forecast, by Sampling Method 2020 & 2033
- Table 27: Global Air Quality Monitoring Device Market Revenue Million Forecast, by End User 2020 & 2033
- Table 28: Global Air Quality Monitoring Device Market Volume K Units Forecast, by End User 2020 & 2033
- Table 29: Global Air Quality Monitoring Device Market Revenue Million Forecast, by Country 2020 & 2033
- Table 30: Global Air Quality Monitoring Device Market Volume K Units Forecast, by Country 2020 & 2033
- Table 31: United Kingdom Air Quality Monitoring Device Market Revenue (Million) Forecast, by Application 2020 & 2033
- Table 32: United Kingdom Air Quality Monitoring Device Market Volume (K Units) Forecast, by Application 2020 & 2033
- Table 33: Spain Air Quality Monitoring Device Market Revenue (Million) Forecast, by Application 2020 & 2033
- Table 34: Spain Air Quality Monitoring Device Market Volume (K Units) Forecast, by Application 2020 & 2033
- Table 35: Germany Air Quality Monitoring Device Market Revenue (Million) Forecast, by Application 2020 & 2033
- Table 36: Germany Air Quality Monitoring Device Market Volume (K Units) Forecast, by Application 2020 & 2033
- Table 37: Italy Air Quality Monitoring Device Market Revenue (Million) Forecast, by Application 2020 & 2033
- Table 38: Italy Air Quality Monitoring Device Market Volume (K Units) Forecast, by Application 2020 & 2033
- Table 39: Global Air Quality Monitoring Device Market Revenue Million Forecast, by Product Type 2020 & 2033
- Table 40: Global Air Quality Monitoring Device Market Volume K Units Forecast, by Product Type 2020 & 2033
- Table 41: Global Air Quality Monitoring Device Market Revenue Million Forecast, by Sampling Method 2020 & 2033
- Table 42: Global Air Quality Monitoring Device Market Volume K Units Forecast, by Sampling Method 2020 & 2033
- Table 43: Global Air Quality Monitoring Device Market Revenue Million Forecast, by End User 2020 & 2033
- Table 44: Global Air Quality Monitoring Device Market Volume K Units Forecast, by End User 2020 & 2033
- Table 45: Global Air Quality Monitoring Device Market Revenue Million Forecast, by Country 2020 & 2033
- Table 46: Global Air Quality Monitoring Device Market Volume K Units Forecast, by Country 2020 & 2033
- Table 47: China Air Quality Monitoring Device Market Revenue (Million) Forecast, by Application 2020 & 2033
- Table 48: China Air Quality Monitoring Device Market Volume (K Units) Forecast, by Application 2020 & 2033
- Table 49: Japan Air Quality Monitoring Device Market Revenue (Million) Forecast, by Application 2020 & 2033
- Table 50: Japan Air Quality Monitoring Device Market Volume (K Units) Forecast, by Application 2020 & 2033
- Table 51: Vietnam Air Quality Monitoring Device Market Revenue (Million) Forecast, by Application 2020 & 2033
- Table 52: Vietnam Air Quality Monitoring Device Market Volume (K Units) Forecast, by Application 2020 & 2033
- Table 53: India Air Quality Monitoring Device Market Revenue (Million) Forecast, by Application 2020 & 2033
- Table 54: India Air Quality Monitoring Device Market Volume (K Units) Forecast, by Application 2020 & 2033
- Table 55: Australia and New Zealand Air Quality Monitoring Device Market Revenue (Million) Forecast, by Application 2020 & 2033
- Table 56: Australia and New Zealand Air Quality Monitoring Device Market Volume (K Units) Forecast, by Application 2020 & 2033
- Table 57: Global Air Quality Monitoring Device Market Revenue Million Forecast, by Product Type 2020 & 2033
- Table 58: Global Air Quality Monitoring Device Market Volume K Units Forecast, by Product Type 2020 & 2033
- Table 59: Global Air Quality Monitoring Device Market Revenue Million Forecast, by Sampling Method 2020 & 2033
- Table 60: Global Air Quality Monitoring Device Market Volume K Units Forecast, by Sampling Method 2020 & 2033
- Table 61: Global Air Quality Monitoring Device Market Revenue Million Forecast, by End User 2020 & 2033
- Table 62: Global Air Quality Monitoring Device Market Volume K Units Forecast, by End User 2020 & 2033
- Table 63: Global Air Quality Monitoring Device Market Revenue Million Forecast, by Country 2020 & 2033
- Table 64: Global Air Quality Monitoring Device Market Volume K Units Forecast, by Country 2020 & 2033
- Table 65: Brazil Air Quality Monitoring Device Market Revenue (Million) Forecast, by Application 2020 & 2033
- Table 66: Brazil Air Quality Monitoring Device Market Volume (K Units) Forecast, by Application 2020 & 2033
- Table 67: Argentina Air Quality Monitoring Device Market Revenue (Million) Forecast, by Application 2020 & 2033
- Table 68: Argentina Air Quality Monitoring Device Market Volume (K Units) Forecast, by Application 2020 & 2033
- Table 69: Global Air Quality Monitoring Device Market Revenue Million Forecast, by Product Type 2020 & 2033
- Table 70: Global Air Quality Monitoring Device Market Volume K Units Forecast, by Product Type 2020 & 2033
- Table 71: Global Air Quality Monitoring Device Market Revenue Million Forecast, by Sampling Method 2020 & 2033
- Table 72: Global Air Quality Monitoring Device Market Volume K Units Forecast, by Sampling Method 2020 & 2033
- Table 73: Global Air Quality Monitoring Device Market Revenue Million Forecast, by End User 2020 & 2033
- Table 74: Global Air Quality Monitoring Device Market Volume K Units Forecast, by End User 2020 & 2033
- Table 75: Global Air Quality Monitoring Device Market Revenue Million Forecast, by Country 2020 & 2033
- Table 76: Global Air Quality Monitoring Device Market Volume K Units Forecast, by Country 2020 & 2033
- Table 77: United Arab Emirates Air Quality Monitoring Device Market Revenue (Million) Forecast, by Application 2020 & 2033
- Table 78: United Arab Emirates Air Quality Monitoring Device Market Volume (K Units) Forecast, by Application 2020 & 2033
- Table 79: South Africa Air Quality Monitoring Device Market Revenue (Million) Forecast, by Application 2020 & 2033
- Table 80: South Africa Air Quality Monitoring Device Market Volume (K Units) Forecast, by Application 2020 & 2033
- Table 81: Saudi Arabia Air Quality Monitoring Device Market Revenue (Million) Forecast, by Application 2020 & 2033
- Table 82: Saudi Arabia Air Quality Monitoring Device Market Volume (K Units) Forecast, by Application 2020 & 2033
- Table 83: Iraq Air Quality Monitoring Device Market Revenue (Million) Forecast, by Application 2020 & 2033
- Table 84: Iraq Air Quality Monitoring Device Market Volume (K Units) Forecast, by Application 2020 & 2033
Frequently Asked Questions
1. What is the projected Compound Annual Growth Rate (CAGR) of the Air Quality Monitoring Device Market?
The projected CAGR is approximately 5.79%.
2. Which companies are prominent players in the Air Quality Monitoring Device Market?
Key companies in the market include Honeywell International Inc, MicroJet Technology Co Ltd, Horiba Ltd, Merck KGaA, TSI Inc, Thermo Fisher Scientific Inc, Hawa Dawa GmbH, Emerson Electric Co, Siemens AG, Agilent Technologies Inc, 3M Co, Teledyne Technologies Inc.
3. What are the main segments of the Air Quality Monitoring Device Market?
The market segments include Product Type, Sampling Method, End User.
4. Can you provide details about the market size?
The market size is estimated to be USD 5.08 Million as of 2022.
5. What are some drivers contributing to market growth?
4.; Supportive Government Policies to Regulate Air Pollution4.; Expansion of Industrialization Across the World.
6. What are the notable trends driving market growth?
The Outdoor Monitor Segment is Expected to be the Fastest-growing Segment.
7. Are there any restraints impacting market growth?
4.; The Penetration of Cleaner Energy Sources Like Renewables and Nuclear Power.
8. Can you provide examples of recent developments in the market?
In March 2023, Tyndall participated in a new European project aiming to improve air quality monitoring. It is a group member that has received EC (European Commission) funds to research air quality monitoring. The Tyndall National Institute for Research and Development in Microtechnologies (IMT) in Bucharest will lead the initiative, which will benefit from the experience of research institutions in Ireland and Italy.
9. What pricing options are available for accessing the report?
Pricing options include single-user, multi-user, and enterprise licenses priced at USD 4750, USD 5250, and USD 8750 respectively.
10. Is the market size provided in terms of value or volume?
The market size is provided in terms of value, measured in Million and volume, measured in K Units.
11. Are there any specific market keywords associated with the report?
Yes, the market keyword associated with the report is "Air Quality Monitoring Device Market," which aids in identifying and referencing the specific market segment covered.
12. How do I determine which pricing option suits my needs best?
The pricing options vary based on user requirements and access needs. Individual users may opt for single-user licenses, while businesses requiring broader access may choose multi-user or enterprise licenses for cost-effective access to the report.
13. Are there any additional resources or data provided in the Air Quality Monitoring Device Market report?
While the report offers comprehensive insights, it's advisable to review the specific contents or supplementary materials provided to ascertain if additional resources or data are available.
14. How can I stay updated on further developments or reports in the Air Quality Monitoring Device Market?
To stay informed about further developments, trends, and reports in the Air Quality Monitoring Device Market, consider subscribing to industry newsletters, following relevant companies and organizations, or regularly checking reputable industry news sources and publications.
Methodology
Step 1 - Identification of Relevant Samples Size from Population Database


Step 2 - Approaches for Defining Global Market Size (Value, Volume* & Price*)

Note*: In applicable scenarios
Step 3 - Data Sources
Primary Research
- Web Analytics
- Survey Reports
- Research Institute
- Latest Research Reports
- Opinion Leaders
Secondary Research
- Annual Reports
- White Paper
- Latest Press Release
- Industry Association
- Paid Database
- Investor Presentations

Step 4 - Data Triangulation
Involves using different sources of information in order to increase the validity of a study
These sources are likely to be stakeholders in a program - participants, other researchers, program staff, other community members, and so on.
Then we put all data in single framework & apply various statistical tools to find out the dynamic on the market.
During the analysis stage, feedback from the stakeholder groups would be compared to determine areas of agreement as well as areas of divergence