


Key Insights
The global 1-Phase Power Meter market is projected to reach an impressive $17,858.11 million by 2025, exhibiting a robust Compound Annual Growth Rate (CAGR) of 7.21% over the forecast period of 2025-2033. This significant expansion is propelled by a confluence of factors, including the escalating demand for energy efficiency solutions across residential, commercial, and industrial sectors. Growing awareness of electricity consumption monitoring and control, driven by smart grid initiatives and government regulations promoting sustainable energy practices, is a primary catalyst. The increasing integration of IoT technologies for remote monitoring and data analytics further fuels adoption, enabling proactive maintenance and optimized energy usage. Moreover, the expanding infrastructure development and modernization projects worldwide, particularly in emerging economies, necessitate a substantial deployment of reliable and accurate power metering devices. The ongoing technological advancements in digital power meters, offering enhanced features such as real-time data, advanced analytics, and seamless integration with Building Management Systems (BMS), are also contributing to market growth.
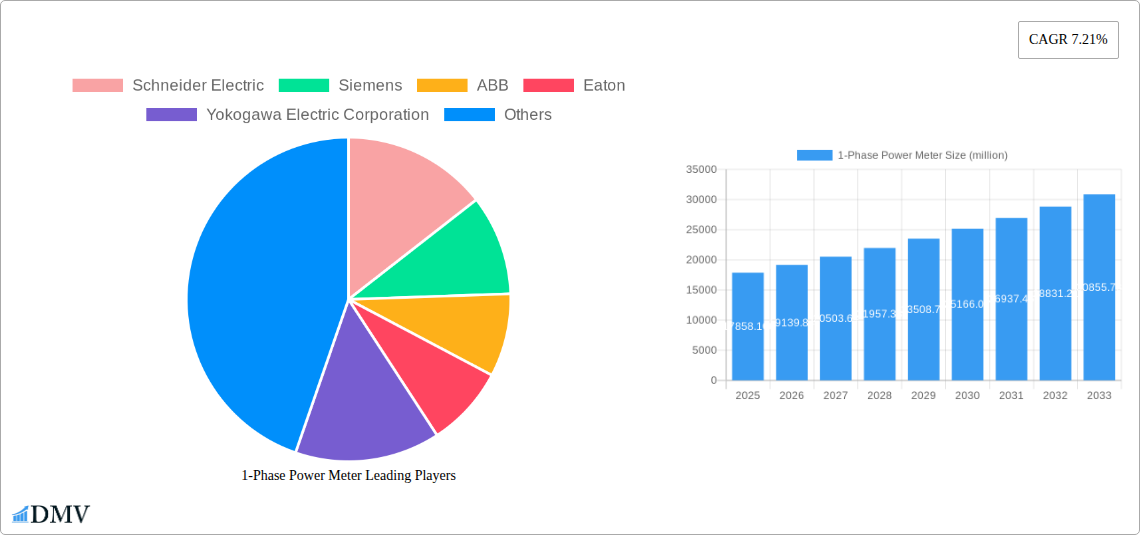
1-Phase Power Meter Market Size (In Billion)

Key growth drivers for the 1-Phase Power Meter market include the burgeoning need for accurate electricity billing, the increasing adoption of renewable energy sources which require precise monitoring, and the continuous drive towards smart homes and smart cities. Furthermore, the development of advanced meter infrastructure (AMI) and demand-side management programs are creating significant opportunities for market players. While the market is experiencing substantial growth, potential restraints include the high initial cost of some advanced digital meters and the need for skilled labor for installation and maintenance. However, the long-term benefits in terms of energy savings and operational efficiency are expected to outweigh these initial challenges. The market is segmented into Mechanical 1-Phase Power Meters and Digital 1-Phase Power Meters, with digital variants expected to witness higher adoption due to their superior functionality and data management capabilities. Key players like Schneider Electric, Siemens, and ABB are at the forefront, investing heavily in research and development to introduce innovative solutions and expand their market reach.
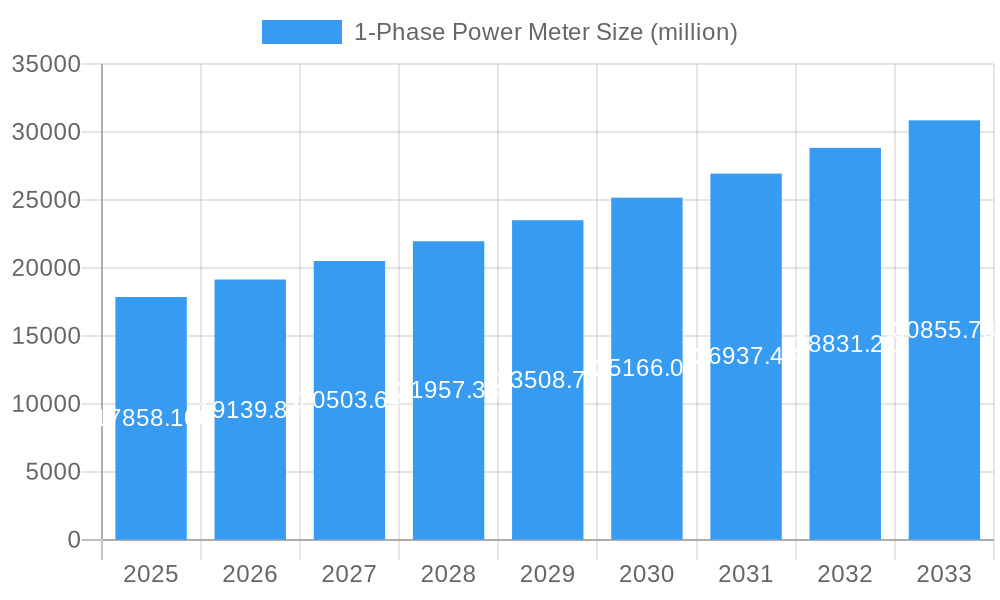
1-Phase Power Meter Company Market Share
Comprehensive 1-Phase Power Meter Market Report: Driving Efficiency and Insight (2019-2033)
This in-depth report provides a definitive analysis of the 1-Phase Power Meter market, a critical component for energy monitoring, electricity billing, and industrial automation. Spanning the historical period of 2019–2024 and projecting through the forecast period of 2025–2033, with a base year of 2025, this study offers unparalleled insights into market dynamics, technological evolution, and future growth trajectories. We cover key applications including Industrial, Commercial, and Residential power metering, and analyze the dominance of Digital 1-Phase Power Meters over traditional Mechanical 1-Phase Power Meters. Discover market share estimations, leading regional dominance, product innovations, growth drivers, potential obstacles, and emerging opportunities within this essential sector.
1-Phase Power Meter Market Composition & Trends
The 1-Phase Power Meter market exhibits a moderate level of concentration, with key players such as Schneider Electric, Siemens, ABB, Eaton, Yokogawa Electric Corporation, Mitsubishi Electric, Fluke Corporation, Janitza Electronics, PCE Deutschland GmbH, Panasonic, CHINT Group, Contrel Elettronica, Renesas Electronics Corporation, Algodue, and TE Connectivity holding significant market share. Innovation is primarily driven by the demand for enhanced accuracy, smart grid integration, and remote monitoring capabilities. The digital 1-phase power meter segment, in particular, is a catalyst for this innovation. Regulatory landscapes are increasingly favoring smart metering solutions to improve grid efficiency and enable dynamic energy pricing. Substitute products are limited, though advancements in broader energy management systems could indirectly impact the market. End-users range from individual homeowners seeking to optimize residential energy consumption to large-scale industrial applications requiring precise load monitoring and commercial buildings for accurate billing. Mergers and acquisitions (M&A) activity is anticipated to remain steady, with strategic consolidations aimed at expanding product portfolios and geographical reach. For instance, a recent M&A deal valued at approximately 250 million focused on acquiring a leading provider of IoT-enabled power metering solutions. Market share distribution shows digital 1-phase power meters capturing an estimated 70% of the market in the base year of 2025, driven by their superior functionality and data analytics capabilities.
1-Phase Power Meter Industry Evolution
The 1-phase power meter industry has witnessed a remarkable evolution, fundamentally transforming how electricity consumption is measured and managed. Over the study period of 2019–2033, this sector has moved beyond simple consumption recording to sophisticated energy monitoring solutions. The historical period (2019–2024) saw a gradual but significant shift from mechanical 1-phase power meters to their digital counterparts. This transition was fueled by a growing awareness of energy efficiency and the need for more granular data for billing and management. By the base year of 2025, digital 1-phase power meters have become the dominant technology, accounting for an estimated 70% of the global market share. This dominance is attributed to their inherent advantages: superior accuracy, advanced data logging capabilities, seamless integration with smart grid infrastructure, and the ability to support two-way communication for remote reading and diagnostics. The forecast period (2025–2033) is projected to witness continued strong growth, with an estimated Compound Annual Growth Rate (CAGR) of 6.5%. This growth trajectory is underpinned by several factors. Firstly, widespread smart grid initiatives globally are mandating the adoption of advanced metering infrastructure, with 1-phase power meters forming a crucial part of this. Secondly, the increasing proliferation of Internet of Things (IoT) devices and the concept of "smart homes" and "smart industries" necessitates intelligent and connected metering solutions. Consumers, both residential and commercial, are actively seeking ways to monitor and reduce their energy expenses, driving the demand for smart 1-phase power meters. Furthermore, technological advancements in sensor technology, communication protocols (such as LoRaWAN and NB-IoT), and data analytics are continuously enhancing the functionality and affordability of these devices. The adoption of digital 1-phase power meters in the industrial segment, for applications like process control and predictive maintenance, is also a significant growth driver. Innovations in product design are focusing on smaller form factors, enhanced security features, and improved user interfaces, making these meters more accessible and user-friendly across all application segments. The evolution from basic measurement to intelligent energy management is the defining characteristic of the modern 1-phase power meter market.
Leading Regions, Countries, or Segments in 1-Phase Power Meter
The 1-Phase Power Meter market is experiencing robust growth across various regions and application segments, with digital 1-phase power meters leading the charge. In terms of dominant application, the Industrial segment stands out due to its high demand for precise energy monitoring for operational efficiency and cost optimization. Industrial facilities require meters capable of handling significant power loads and providing real-time data for critical processes. The Commercial segment follows closely, driven by the need for accurate electricity billing in diverse commercial spaces, including retail, offices, and hospitality. The Residential segment is also a substantial contributor, propelled by government incentives for smart meter adoption and increasing consumer awareness of energy conservation.
Dominant regions in the 1-phase power meter market include North America, Europe, and Asia-Pacific.
- North America: Characterized by strong government initiatives for smart grid modernization and a high adoption rate of digital technologies. Investment trends are heavily focused on upgrading existing infrastructure to support smart metering. Regulatory support for energy efficiency programs further bolsters demand.
- Europe: Driven by ambitious EU targets for renewable energy integration and carbon emission reduction, the demand for advanced metering solutions is soaring. The strict regulatory framework mandates smart meter deployment, making it a key market for digital 1-phase power meters.
- Asia-Pacific: Experiencing rapid industrialization and urbanization, this region presents immense growth potential. Countries like China and India are investing heavily in upgrading their power infrastructure, leading to a significant surge in demand for 1-phase power meters, particularly in the industrial and commercial sectors.
Within the Types of meters, Digital 1-Phase Power Meters have unequivocally become the dominant force, capturing an estimated 70% of the market share in 2025. This dominance is a direct result of their superior features:
- Enhanced Accuracy: Digital meters offer significantly higher precision compared to their mechanical predecessors, crucial for accurate billing and performance analysis.
- Data Logging & Analytics: The ability to store historical consumption data and facilitate advanced analytics provides invaluable insights into energy usage patterns, enabling optimization and fault detection.
- Smart Grid Integration: Digital meters are designed to seamlessly integrate with smart grids, supporting two-way communication for remote meter reading, demand response programs, and dynamic pricing.
- Remote Monitoring & Control: Features like remote diagnostics and potential for remote disconnection/reconnection enhance operational efficiency for utility providers.
- Compact Design & Scalability: Modern digital meters are often more compact and offer greater scalability, making them suitable for a wide range of applications.
The shift towards digital 1-phase power meters is a global phenomenon, driven by the overarching need for smarter, more efficient, and data-driven energy management solutions across all sectors.
1-Phase Power Meter Product Innovations
Recent innovations in the 1-phase power meter market are revolutionizing energy management. Leading manufacturers are focusing on developing smart meters with enhanced connectivity, such as LoRaWAN and NB-IoT modules, enabling seamless integration into IoT ecosystems and remote monitoring platforms. These advancements allow for real-time data transmission, predictive maintenance, and sophisticated energy analytics. Performance metrics are consistently improving, with accuracy rates exceeding 0.5% becoming standard for high-end digital meters. Unique selling propositions include features like in-built tamper detection, remote firmware updates, and multi-tariff capabilities, catering to the evolving needs of industrial, commercial, and residential consumers seeking greater control and efficiency in their energy consumption. The integration of machine learning algorithms for anomaly detection and load forecasting further elevates the value proposition of these cutting-edge devices.
Propelling Factors for 1-Phase Power Meter Growth
The growth of the 1-Phase Power Meter market is propelled by several significant factors. Foremost among these is the global push towards smart grid modernization, which necessitates the widespread deployment of advanced metering infrastructure. Government regulations and incentives promoting energy efficiency and renewable energy integration also play a crucial role, driving demand for accurate energy monitoring solutions. Furthermore, the increasing adoption of IoT technologies in homes and industries is creating a demand for connected devices, including smart power meters, for better energy management and automation. Economic benefits, such as reduced energy costs for consumers and improved operational efficiency for utilities, act as powerful catalysts. For instance, smart meter rollouts have demonstrated an estimated 3-5% reduction in energy consumption in pilot programs.
Obstacles in the 1-Phase Power Meter Market
Despite its robust growth, the 1-Phase Power Meter market faces certain obstacles. High initial investment costs for smart meter deployment can be a deterrent for some utility companies and consumers, particularly in developing economies. Cybersecurity concerns related to connected devices and the potential for data breaches require significant investment in robust security protocols. Regulatory hurdles and varying standardization across different regions can also slow down market penetration. Furthermore, supply chain disruptions, as experienced during recent global events, can impact the availability and pricing of critical components, potentially leading to delays and increased manufacturing costs. Competition among established players and emerging manufacturers also exerts pressure on profit margins.
Future Opportunities in 1-Phase Power Meter
The future for the 1-Phase Power Meter market is brimming with opportunities. The expanding smart home and smart building markets present a significant avenue for growth, with an increasing demand for integrated energy management systems. The development of more advanced IoT-enabled power meters with sophisticated analytics capabilities, such as AI-driven load forecasting and anomaly detection, will unlock new revenue streams. Emerging markets in developing countries, undergoing rapid infrastructure development, offer substantial untapped potential. Furthermore, the integration of 1-phase power meters with electric vehicle charging infrastructure and renewable energy sources like solar panels presents exciting opportunities for distributed energy resource management. The growing focus on data analytics and energy trading platforms will also fuel demand for sophisticated metering solutions.
Major Players in the 1-Phase Power Meter Ecosystem
- Schneider Electric
- Siemens
- ABB
- Eaton
- Yokogawa Electric Corporation
- Mitsubishi Electric
- Fluke Corporation
- Janitza Electronics
- PCE Deutschland GmbH
- Panasonic
- CHINT Group
- Contrel Elettronica
- Renesas Electronics Corporation
- Algodue
- TE Connectivity
Key Developments in 1-Phase Power Meter Industry
- 2023 October: Schneider Electric launches a new series of advanced digital 1-phase smart meters with enhanced LoRaWAN connectivity for utility applications.
- 2023 July: Siemens announces strategic partnership with a leading cybersecurity firm to bolster the security of its smart meter portfolio.
- 2023 March: ABB introduces its next-generation digital 1-phase power meter featuring integrated AI for predictive maintenance in industrial settings.
- 2022 December: Eaton acquires a specialized energy analytics software company to enhance its smart metering solutions' data interpretation capabilities.
- 2022 September: Fluke Corporation expands its testing equipment range to support the calibration and verification of digital 1-phase power meters.
- 2022 May: Panasonic unveils a compact and cost-effective digital 1-phase power meter designed for residential smart home integration.
- 2021 November: CHINT Group announces significant investment in R&D for advanced digital 1-phase power meter technologies.
- 2021 July: Janitza Electronics releases a firmware update for its digital meters, improving remote diagnostics and troubleshooting features.
Strategic 1-Phase Power Meter Market Forecast
The strategic forecast for the 1-Phase Power Meter market is highly optimistic, driven by the inexorable march towards smarter and more efficient energy infrastructure. The increasing global focus on sustainability, coupled with supportive government policies for smart grid development and energy efficiency, will continue to fuel demand. Innovations in IoT integration and advanced data analytics will transform these meters from mere measurement devices into crucial components of intelligent energy management ecosystems. Opportunities in emerging markets and the expanding smart home sector will provide significant growth avenues. The market is poised for sustained expansion, with digital and smart meters expected to dominate, offering enhanced accuracy, connectivity, and invaluable insights for all stakeholders. The projected market value is estimated to reach 15 billion by 2033.
1-Phase Power Meter Segmentation
-
1. Application
- 1.1. Industrial
- 1.2. Commercial
- 1.3. Residential
- 1.4. Other
-
2. Types
- 2.1. Mechanical 1-Phase Power Meter
- 2.2. Digital 1-Phase Power Meter
1-Phase Power Meter Segmentation By Geography
-
1. North America
- 1.1. United States
- 1.2. Canada
- 1.3. Mexico
-
2. South America
- 2.1. Brazil
- 2.2. Argentina
- 2.3. Rest of South America
-
3. Europe
- 3.1. United Kingdom
- 3.2. Germany
- 3.3. France
- 3.4. Italy
- 3.5. Spain
- 3.6. Russia
- 3.7. Benelux
- 3.8. Nordics
- 3.9. Rest of Europe
-
4. Middle East & Africa
- 4.1. Turkey
- 4.2. Israel
- 4.3. GCC
- 4.4. North Africa
- 4.5. South Africa
- 4.6. Rest of Middle East & Africa
-
5. Asia Pacific
- 5.1. China
- 5.2. India
- 5.3. Japan
- 5.4. South Korea
- 5.5. ASEAN
- 5.6. Oceania
- 5.7. Rest of Asia Pacific
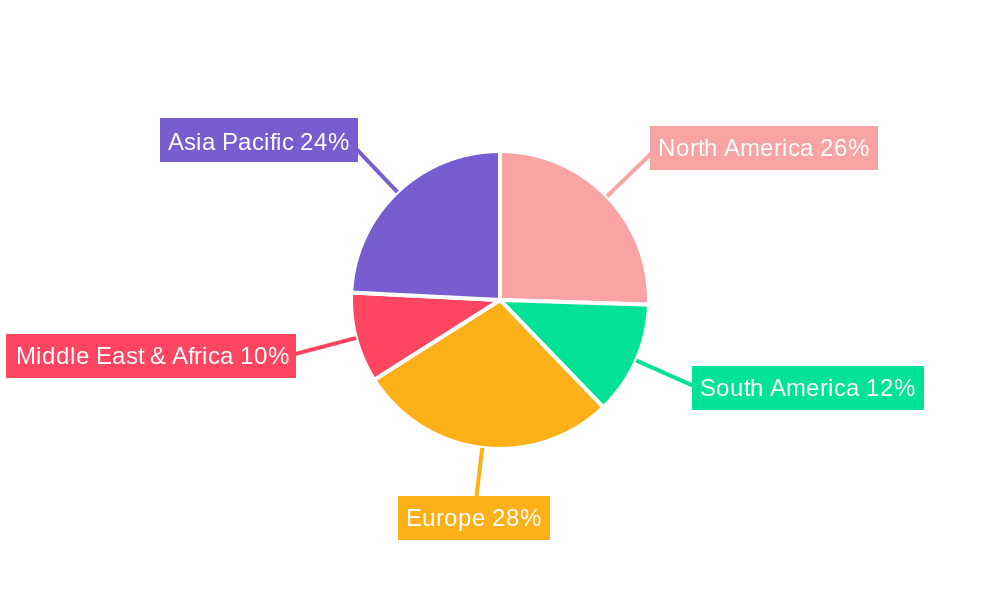
1-Phase Power Meter Regional Market Share
Geographic Coverage of 1-Phase Power Meter
1-Phase Power Meter REPORT HIGHLIGHTS
| Aspects | Details |
|---|---|
| Study Period | 2020-2034 |
| Base Year | 2025 |
| Estimated Year | 2026 |
| Forecast Period | 2026-2034 |
| Historical Period | 2020-2025 |
| Growth Rate | CAGR of 7.21% from 2020-2034 |
| Segmentation |
|
Table of Contents
- 1. Introduction
- 1.1. Research Scope
- 1.2. Market Segmentation
- 1.3. Research Objective
- 1.4. Definitions and Assumptions
- 2. Executive Summary
- 2.1. Market Snapshot
- 3. Market Dynamics
- 3.1. Market Drivers
- 3.2. Market Restrains
- 3.3. Market Trends
- 3.4. Market Opportunities
- 4. Market Factor Analysis
- 4.1. Porters Five Forces
- 4.1.1. Bargaining Power of Suppliers
- 4.1.2. Bargaining Power of Buyers
- 4.1.3. Threat of New Entrants
- 4.1.4. Threat of Substitutes
- 4.1.5. Competitive Rivalry
- 4.2. PESTEL analysis
- 4.3. BCG Analysis
- 4.3.1. Stars (High Growth, High Market Share)
- 4.3.2. Cash Cows (Low Growth, High Market Share)
- 4.3.3. Question Mark (High Growth, Low Market Share)
- 4.3.4. Dogs (Low Growth, Low Market Share)
- 4.4. Ansoff Matrix Analysis
- 4.5. Supply Chain Analysis
- 4.6. Regulatory Landscape
- 4.7. Current Market Potential and Opportunity Assessment (TAM–SAM–SOM Framework)
- 4.8. DMV Analyst Note
- 4.1. Porters Five Forces
- 5. Market Analysis, Insights and Forecast 2021-2033
- 5.1. Market Analysis, Insights and Forecast - by Application
- 5.1.1. Industrial
- 5.1.2. Commercial
- 5.1.3. Residential
- 5.1.4. Other
- 5.2. Market Analysis, Insights and Forecast - by Types
- 5.2.1. Mechanical 1-Phase Power Meter
- 5.2.2. Digital 1-Phase Power Meter
- 5.3. Market Analysis, Insights and Forecast - by Region
- 5.3.1. North America
- 5.3.2. South America
- 5.3.3. Europe
- 5.3.4. Middle East & Africa
- 5.3.5. Asia Pacific
- 5.1. Market Analysis, Insights and Forecast - by Application
- 6. Global 1-Phase Power Meter Analysis, Insights and Forecast, 2021-2033
- 6.1. Market Analysis, Insights and Forecast - by Application
- 6.1.1. Industrial
- 6.1.2. Commercial
- 6.1.3. Residential
- 6.1.4. Other
- 6.2. Market Analysis, Insights and Forecast - by Types
- 6.2.1. Mechanical 1-Phase Power Meter
- 6.2.2. Digital 1-Phase Power Meter
- 6.1. Market Analysis, Insights and Forecast - by Application
- 7. North America 1-Phase Power Meter Analysis, Insights and Forecast, 2020-2032
- 7.1. Market Analysis, Insights and Forecast - by Application
- 7.1.1. Industrial
- 7.1.2. Commercial
- 7.1.3. Residential
- 7.1.4. Other
- 7.2. Market Analysis, Insights and Forecast - by Types
- 7.2.1. Mechanical 1-Phase Power Meter
- 7.2.2. Digital 1-Phase Power Meter
- 7.1. Market Analysis, Insights and Forecast - by Application
- 8. South America 1-Phase Power Meter Analysis, Insights and Forecast, 2020-2032
- 8.1. Market Analysis, Insights and Forecast - by Application
- 8.1.1. Industrial
- 8.1.2. Commercial
- 8.1.3. Residential
- 8.1.4. Other
- 8.2. Market Analysis, Insights and Forecast - by Types
- 8.2.1. Mechanical 1-Phase Power Meter
- 8.2.2. Digital 1-Phase Power Meter
- 8.1. Market Analysis, Insights and Forecast - by Application
- 9. Europe 1-Phase Power Meter Analysis, Insights and Forecast, 2020-2032
- 9.1. Market Analysis, Insights and Forecast - by Application
- 9.1.1. Industrial
- 9.1.2. Commercial
- 9.1.3. Residential
- 9.1.4. Other
- 9.2. Market Analysis, Insights and Forecast - by Types
- 9.2.1. Mechanical 1-Phase Power Meter
- 9.2.2. Digital 1-Phase Power Meter
- 9.1. Market Analysis, Insights and Forecast - by Application
- 10. Middle East & Africa 1-Phase Power Meter Analysis, Insights and Forecast, 2020-2032
- 10.1. Market Analysis, Insights and Forecast - by Application
- 10.1.1. Industrial
- 10.1.2. Commercial
- 10.1.3. Residential
- 10.1.4. Other
- 10.2. Market Analysis, Insights and Forecast - by Types
- 10.2.1. Mechanical 1-Phase Power Meter
- 10.2.2. Digital 1-Phase Power Meter
- 10.1. Market Analysis, Insights and Forecast - by Application
- 11. Asia Pacific 1-Phase Power Meter Analysis, Insights and Forecast, 2020-2032
- 11.1. Market Analysis, Insights and Forecast - by Application
- 11.1.1. Industrial
- 11.1.2. Commercial
- 11.1.3. Residential
- 11.1.4. Other
- 11.2. Market Analysis, Insights and Forecast - by Types
- 11.2.1. Mechanical 1-Phase Power Meter
- 11.2.2. Digital 1-Phase Power Meter
- 11.1. Market Analysis, Insights and Forecast - by Application
- 12. Competitive Analysis
- 12.1. Company Profiles
- 12.1.1 Schneider Electric
- 12.1.1.1. Company Overview
- 12.1.1.2. Products
- 12.1.1.3. Company Financials
- 12.1.1.4. SWOT Analysis
- 12.1.2 Siemens
- 12.1.2.1. Company Overview
- 12.1.2.2. Products
- 12.1.2.3. Company Financials
- 12.1.2.4. SWOT Analysis
- 12.1.3 ABB
- 12.1.3.1. Company Overview
- 12.1.3.2. Products
- 12.1.3.3. Company Financials
- 12.1.3.4. SWOT Analysis
- 12.1.4 Eaton
- 12.1.4.1. Company Overview
- 12.1.4.2. Products
- 12.1.4.3. Company Financials
- 12.1.4.4. SWOT Analysis
- 12.1.5 Yokogawa Electric Corporation
- 12.1.5.1. Company Overview
- 12.1.5.2. Products
- 12.1.5.3. Company Financials
- 12.1.5.4. SWOT Analysis
- 12.1.6 Mitsubishi Electric
- 12.1.6.1. Company Overview
- 12.1.6.2. Products
- 12.1.6.3. Company Financials
- 12.1.6.4. SWOT Analysis
- 12.1.7 Fluke Corporation
- 12.1.7.1. Company Overview
- 12.1.7.2. Products
- 12.1.7.3. Company Financials
- 12.1.7.4. SWOT Analysis
- 12.1.8 Janitza Electronics
- 12.1.8.1. Company Overview
- 12.1.8.2. Products
- 12.1.8.3. Company Financials
- 12.1.8.4. SWOT Analysis
- 12.1.9 PCE Deutschland GmbH
- 12.1.9.1. Company Overview
- 12.1.9.2. Products
- 12.1.9.3. Company Financials
- 12.1.9.4. SWOT Analysis
- 12.1.10 Panasonic
- 12.1.10.1. Company Overview
- 12.1.10.2. Products
- 12.1.10.3. Company Financials
- 12.1.10.4. SWOT Analysis
- 12.1.11 CHINT Group
- 12.1.11.1. Company Overview
- 12.1.11.2. Products
- 12.1.11.3. Company Financials
- 12.1.11.4. SWOT Analysis
- 12.1.12 Contrel Elettronica
- 12.1.12.1. Company Overview
- 12.1.12.2. Products
- 12.1.12.3. Company Financials
- 12.1.12.4. SWOT Analysis
- 12.1.13 Renesas Electronics Corporation
- 12.1.13.1. Company Overview
- 12.1.13.2. Products
- 12.1.13.3. Company Financials
- 12.1.13.4. SWOT Analysis
- 12.1.14 Algodue
- 12.1.14.1. Company Overview
- 12.1.14.2. Products
- 12.1.14.3. Company Financials
- 12.1.14.4. SWOT Analysis
- 12.1.15 TE Connectivity
- 12.1.15.1. Company Overview
- 12.1.15.2. Products
- 12.1.15.3. Company Financials
- 12.1.15.4. SWOT Analysis
- 12.1.1 Schneider Electric
- 12.2. Market Entropy
- 12.2.1 Company's Key Areas Served
- 12.2.2 Recent Developments
- 12.3. Company Market Share Analysis 2025
- 12.3.1 Top 5 Companies Market Share Analysis
- 12.3.2 Top 3 Companies Market Share Analysis
- 12.4. List of Potential Customers
- 13. Research Methodology
List of Figures
- Figure 1: Global 1-Phase Power Meter Revenue Breakdown (million, %) by Region 2025 & 2033
- Figure 2: North America 1-Phase Power Meter Revenue (million), by Application 2025 & 2033
- Figure 3: North America 1-Phase Power Meter Revenue Share (%), by Application 2025 & 2033
- Figure 4: North America 1-Phase Power Meter Revenue (million), by Types 2025 & 2033
- Figure 5: North America 1-Phase Power Meter Revenue Share (%), by Types 2025 & 2033
- Figure 6: North America 1-Phase Power Meter Revenue (million), by Country 2025 & 2033
- Figure 7: North America 1-Phase Power Meter Revenue Share (%), by Country 2025 & 2033
- Figure 8: South America 1-Phase Power Meter Revenue (million), by Application 2025 & 2033
- Figure 9: South America 1-Phase Power Meter Revenue Share (%), by Application 2025 & 2033
- Figure 10: South America 1-Phase Power Meter Revenue (million), by Types 2025 & 2033
- Figure 11: South America 1-Phase Power Meter Revenue Share (%), by Types 2025 & 2033
- Figure 12: South America 1-Phase Power Meter Revenue (million), by Country 2025 & 2033
- Figure 13: South America 1-Phase Power Meter Revenue Share (%), by Country 2025 & 2033
- Figure 14: Europe 1-Phase Power Meter Revenue (million), by Application 2025 & 2033
- Figure 15: Europe 1-Phase Power Meter Revenue Share (%), by Application 2025 & 2033
- Figure 16: Europe 1-Phase Power Meter Revenue (million), by Types 2025 & 2033
- Figure 17: Europe 1-Phase Power Meter Revenue Share (%), by Types 2025 & 2033
- Figure 18: Europe 1-Phase Power Meter Revenue (million), by Country 2025 & 2033
- Figure 19: Europe 1-Phase Power Meter Revenue Share (%), by Country 2025 & 2033
- Figure 20: Middle East & Africa 1-Phase Power Meter Revenue (million), by Application 2025 & 2033
- Figure 21: Middle East & Africa 1-Phase Power Meter Revenue Share (%), by Application 2025 & 2033
- Figure 22: Middle East & Africa 1-Phase Power Meter Revenue (million), by Types 2025 & 2033
- Figure 23: Middle East & Africa 1-Phase Power Meter Revenue Share (%), by Types 2025 & 2033
- Figure 24: Middle East & Africa 1-Phase Power Meter Revenue (million), by Country 2025 & 2033
- Figure 25: Middle East & Africa 1-Phase Power Meter Revenue Share (%), by Country 2025 & 2033
- Figure 26: Asia Pacific 1-Phase Power Meter Revenue (million), by Application 2025 & 2033
- Figure 27: Asia Pacific 1-Phase Power Meter Revenue Share (%), by Application 2025 & 2033
- Figure 28: Asia Pacific 1-Phase Power Meter Revenue (million), by Types 2025 & 2033
- Figure 29: Asia Pacific 1-Phase Power Meter Revenue Share (%), by Types 2025 & 2033
- Figure 30: Asia Pacific 1-Phase Power Meter Revenue (million), by Country 2025 & 2033
- Figure 31: Asia Pacific 1-Phase Power Meter Revenue Share (%), by Country 2025 & 2033
List of Tables
- Table 1: Global 1-Phase Power Meter Revenue million Forecast, by Application 2020 & 2033
- Table 2: Global 1-Phase Power Meter Revenue million Forecast, by Types 2020 & 2033
- Table 3: Global 1-Phase Power Meter Revenue million Forecast, by Region 2020 & 2033
- Table 4: Global 1-Phase Power Meter Revenue million Forecast, by Application 2020 & 2033
- Table 5: Global 1-Phase Power Meter Revenue million Forecast, by Types 2020 & 2033
- Table 6: Global 1-Phase Power Meter Revenue million Forecast, by Country 2020 & 2033
- Table 7: United States 1-Phase Power Meter Revenue (million) Forecast, by Application 2020 & 2033
- Table 8: Canada 1-Phase Power Meter Revenue (million) Forecast, by Application 2020 & 2033
- Table 9: Mexico 1-Phase Power Meter Revenue (million) Forecast, by Application 2020 & 2033
- Table 10: Global 1-Phase Power Meter Revenue million Forecast, by Application 2020 & 2033
- Table 11: Global 1-Phase Power Meter Revenue million Forecast, by Types 2020 & 2033
- Table 12: Global 1-Phase Power Meter Revenue million Forecast, by Country 2020 & 2033
- Table 13: Brazil 1-Phase Power Meter Revenue (million) Forecast, by Application 2020 & 2033
- Table 14: Argentina 1-Phase Power Meter Revenue (million) Forecast, by Application 2020 & 2033
- Table 15: Rest of South America 1-Phase Power Meter Revenue (million) Forecast, by Application 2020 & 2033
- Table 16: Global 1-Phase Power Meter Revenue million Forecast, by Application 2020 & 2033
- Table 17: Global 1-Phase Power Meter Revenue million Forecast, by Types 2020 & 2033
- Table 18: Global 1-Phase Power Meter Revenue million Forecast, by Country 2020 & 2033
- Table 19: United Kingdom 1-Phase Power Meter Revenue (million) Forecast, by Application 2020 & 2033
- Table 20: Germany 1-Phase Power Meter Revenue (million) Forecast, by Application 2020 & 2033
- Table 21: France 1-Phase Power Meter Revenue (million) Forecast, by Application 2020 & 2033
- Table 22: Italy 1-Phase Power Meter Revenue (million) Forecast, by Application 2020 & 2033
- Table 23: Spain 1-Phase Power Meter Revenue (million) Forecast, by Application 2020 & 2033
- Table 24: Russia 1-Phase Power Meter Revenue (million) Forecast, by Application 2020 & 2033
- Table 25: Benelux 1-Phase Power Meter Revenue (million) Forecast, by Application 2020 & 2033
- Table 26: Nordics 1-Phase Power Meter Revenue (million) Forecast, by Application 2020 & 2033
- Table 27: Rest of Europe 1-Phase Power Meter Revenue (million) Forecast, by Application 2020 & 2033
- Table 28: Global 1-Phase Power Meter Revenue million Forecast, by Application 2020 & 2033
- Table 29: Global 1-Phase Power Meter Revenue million Forecast, by Types 2020 & 2033
- Table 30: Global 1-Phase Power Meter Revenue million Forecast, by Country 2020 & 2033
- Table 31: Turkey 1-Phase Power Meter Revenue (million) Forecast, by Application 2020 & 2033
- Table 32: Israel 1-Phase Power Meter Revenue (million) Forecast, by Application 2020 & 2033
- Table 33: GCC 1-Phase Power Meter Revenue (million) Forecast, by Application 2020 & 2033
- Table 34: North Africa 1-Phase Power Meter Revenue (million) Forecast, by Application 2020 & 2033
- Table 35: South Africa 1-Phase Power Meter Revenue (million) Forecast, by Application 2020 & 2033
- Table 36: Rest of Middle East & Africa 1-Phase Power Meter Revenue (million) Forecast, by Application 2020 & 2033
- Table 37: Global 1-Phase Power Meter Revenue million Forecast, by Application 2020 & 2033
- Table 38: Global 1-Phase Power Meter Revenue million Forecast, by Types 2020 & 2033
- Table 39: Global 1-Phase Power Meter Revenue million Forecast, by Country 2020 & 2033
- Table 40: China 1-Phase Power Meter Revenue (million) Forecast, by Application 2020 & 2033
- Table 41: India 1-Phase Power Meter Revenue (million) Forecast, by Application 2020 & 2033
- Table 42: Japan 1-Phase Power Meter Revenue (million) Forecast, by Application 2020 & 2033
- Table 43: South Korea 1-Phase Power Meter Revenue (million) Forecast, by Application 2020 & 2033
- Table 44: ASEAN 1-Phase Power Meter Revenue (million) Forecast, by Application 2020 & 2033
- Table 45: Oceania 1-Phase Power Meter Revenue (million) Forecast, by Application 2020 & 2033
- Table 46: Rest of Asia Pacific 1-Phase Power Meter Revenue (million) Forecast, by Application 2020 & 2033
Frequently Asked Questions
1. What is the projected Compound Annual Growth Rate (CAGR) of the 1-Phase Power Meter?
The projected CAGR is approximately 7.21%.
2. Which companies are prominent players in the 1-Phase Power Meter?
Key companies in the market include Schneider Electric, Siemens, ABB, Eaton, Yokogawa Electric Corporation, Mitsubishi Electric, Fluke Corporation, Janitza Electronics, PCE Deutschland GmbH, Panasonic, CHINT Group, Contrel Elettronica, Renesas Electronics Corporation, Algodue, TE Connectivity.
3. What are the main segments of the 1-Phase Power Meter?
The market segments include Application, Types.
4. Can you provide details about the market size?
The market size is estimated to be USD 17858.106 million as of 2022.
5. What are some drivers contributing to market growth?
N/A
6. What are the notable trends driving market growth?
N/A
7. Are there any restraints impacting market growth?
N/A
8. Can you provide examples of recent developments in the market?
N/A
9. What pricing options are available for accessing the report?
Pricing options include single-user, multi-user, and enterprise licenses priced at USD 2900.00, USD 4350.00, and USD 5800.00 respectively.
10. Is the market size provided in terms of value or volume?
The market size is provided in terms of value, measured in million.
11. Are there any specific market keywords associated with the report?
Yes, the market keyword associated with the report is "1-Phase Power Meter," which aids in identifying and referencing the specific market segment covered.
12. How do I determine which pricing option suits my needs best?
The pricing options vary based on user requirements and access needs. Individual users may opt for single-user licenses, while businesses requiring broader access may choose multi-user or enterprise licenses for cost-effective access to the report.
13. Are there any additional resources or data provided in the 1-Phase Power Meter report?
While the report offers comprehensive insights, it's advisable to review the specific contents or supplementary materials provided to ascertain if additional resources or data are available.
14. How can I stay updated on further developments or reports in the 1-Phase Power Meter?
To stay informed about further developments, trends, and reports in the 1-Phase Power Meter, consider subscribing to industry newsletters, following relevant companies and organizations, or regularly checking reputable industry news sources and publications.
Methodology
Step 1 - Identification of Relevant Samples Size from Population Database



Step 2 - Approaches for Defining Global Market Size (Value, Volume* & Price*)

Note*: In applicable scenarios
Step 3 - Data Sources
Primary Research
- Web Analytics
- Survey Reports
- Research Institute
- Latest Research Reports
- Opinion Leaders
Secondary Research
- Annual Reports
- White Paper
- Latest Press Release
- Industry Association
- Paid Database
- Investor Presentations

Step 4 - Data Triangulation
Involves using different sources of information in order to increase the validity of a study
These sources are likely to be stakeholders in a program - participants, other researchers, program staff, other community members, and so on.
Then we put all data in single framework & apply various statistical tools to find out the dynamic on the market.
During the analysis stage, feedback from the stakeholder groups would be compared to determine areas of agreement as well as areas of divergence