

Key Insights
The global Carbon Management System (CMS) market is poised for substantial expansion, with a current market size estimated at $14.37 million and a projected Compound Annual Growth Rate (CAGR) of 12.09%. This robust growth is fueled by a confluence of critical drivers, including increasing regulatory pressures from governments worldwide mandating emissions reporting and reduction targets, growing corporate sustainability initiatives driven by both ethical considerations and investor demand for Environmental, Social, and Governance (ESG) performance, and the escalating need for accurate greenhouse gas (GHG) accounting and reporting. The market is experiencing a significant trend towards integrated sustainability platforms that encompass not only carbon emissions but also broader ESG metrics, thereby offering a holistic view of an organization's environmental impact. Furthermore, advancements in data analytics and AI are enabling more sophisticated emissions tracking, forecasting, and reduction strategy development, making CMS solutions indispensable for businesses aiming to navigate the complexities of climate change mitigation.
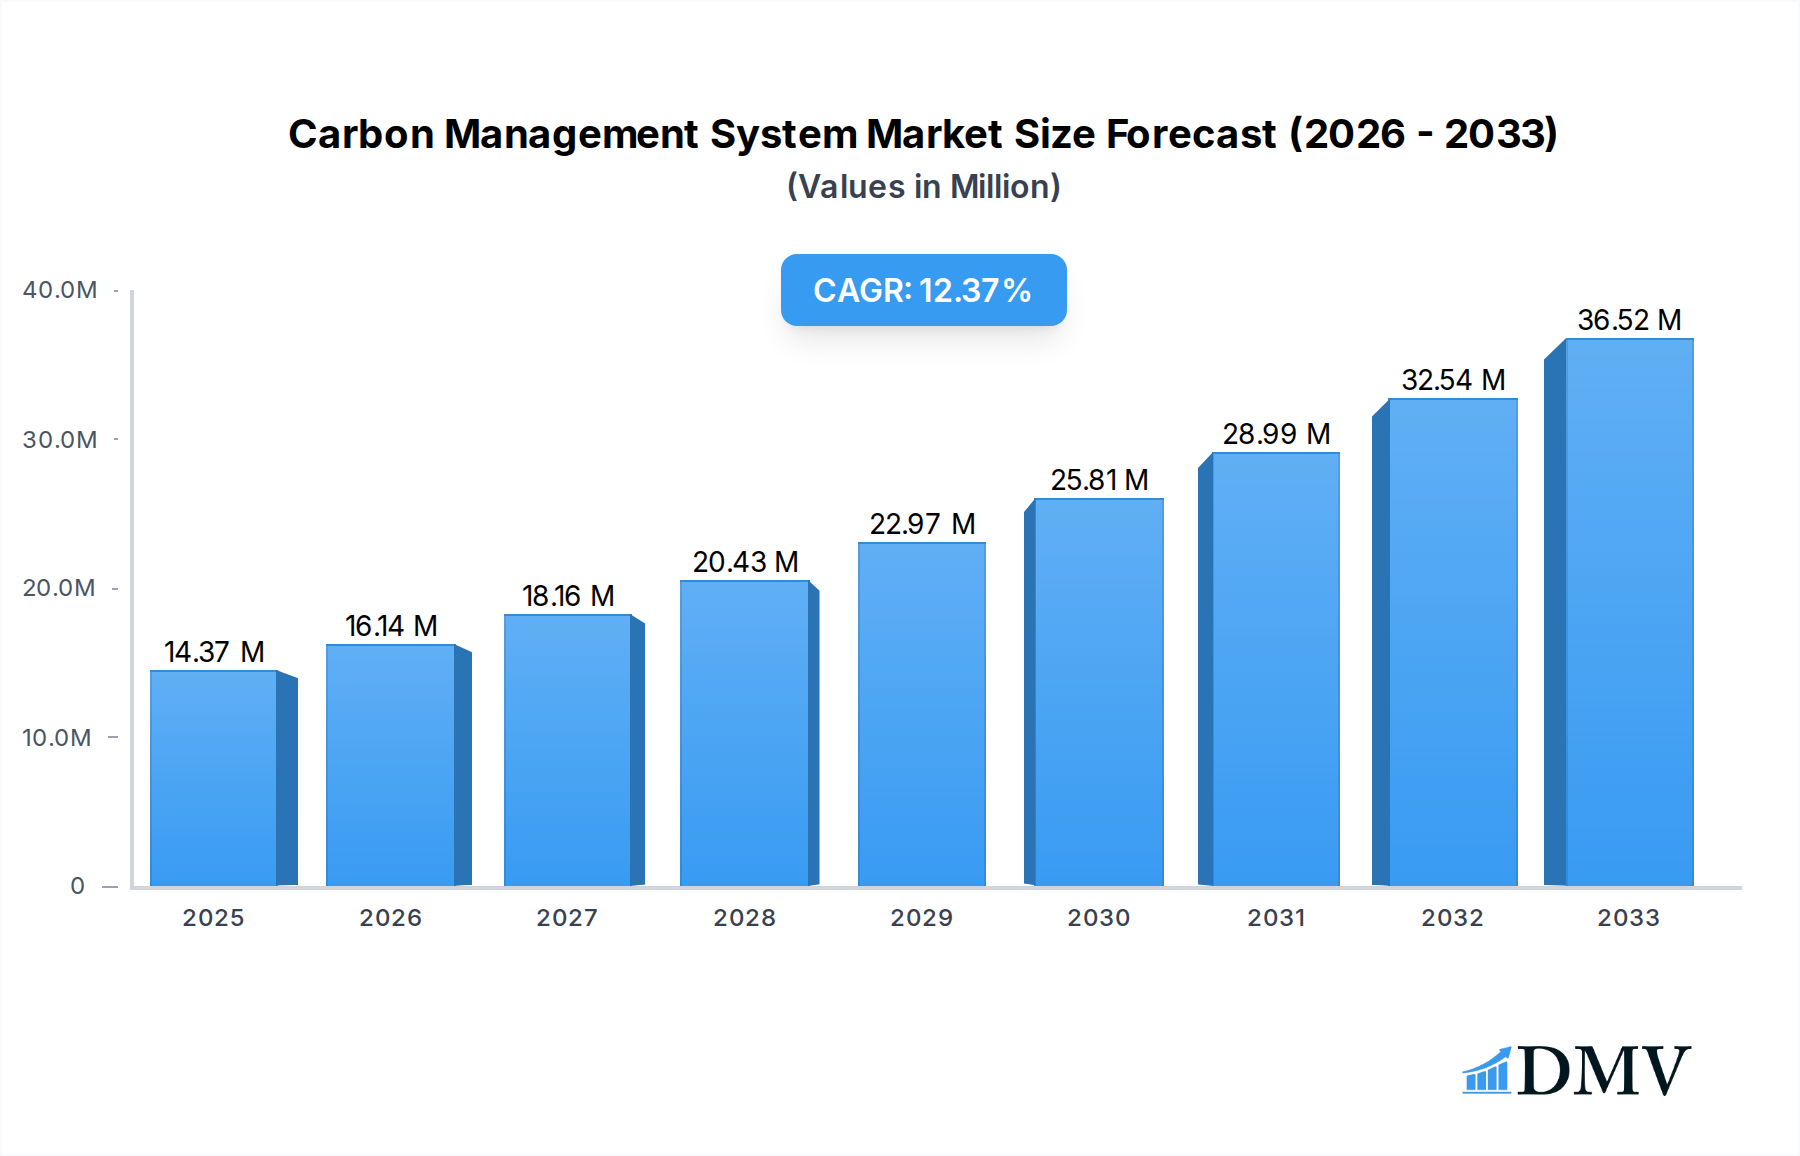
Carbon Management System Market Market Size (In Million)
The market's potential is further amplified by the diverse range of applications and the broad spectrum of end-user verticals adopting these solutions. Within the "Offering" segment, both Software and Services are experiencing high demand, with software providing the core functionality for data collection and analysis, and services offering expertise in implementation, strategy, and compliance. Key applications include Energy Management, Greenhouse Gas Management, and Air Quality Management, all of which are central to corporate sustainability agendas. The "Oil and Gas" and "Manufacturing" sectors are leading the adoption, driven by their direct impact on emissions and stringent regulatory requirements. However, sectors like "Healthcare," "IT and Telecom," and others are rapidly increasing their focus on sustainability, presenting significant opportunities for market players. The ongoing expansion of CMS adoption across these verticals, coupled with continuous innovation in technology and evolving regulatory landscapes, underscores the dynamic and promising future of this market.

Carbon Management System Market Company Market Share
This in-depth report provides a detailed analysis of the global Carbon Management System (CMS) market, offering critical insights for stakeholders navigating this rapidly evolving landscape. Covering the historical period from 2019 to 2024, the base year of 2025, and extending to a robust forecast period of 2025-2033, this research delivers actionable intelligence on market trends, key players, technological advancements, and future growth prospects. We meticulously analyze market composition, industry evolution, regional dominance, product innovations, growth drivers, obstacles, and emerging opportunities, all within the context of a dynamic global sustainability imperative.
Carbon Management System Market Market Composition & Trends
The Carbon Management System market is characterized by a moderate to high concentration, with leading players like IBM Corporation, Schneider Electric SE, and SAP SE holding significant market share. The market's trajectory is heavily influenced by increasing environmental regulations and corporate sustainability goals, acting as significant innovation catalysts. The growing demand for integrated sustainability reporting and greenhouse gas (GHG) management solutions is driving the adoption of advanced CMS platforms. Regulatory landscapes, including carbon pricing mechanisms and emission reduction mandates, are crucial in shaping market dynamics. Substitute products, such as manual tracking methods and standalone reporting tools, are gradually being replaced by comprehensive CMS software and services. End-user profiles are diversifying, with industries like Oil and Gas, Manufacturing, and IT and Telecom actively investing in CMS to meet their environmental commitments. Merger and acquisition (M&A) activities are on the rise as companies seek to expand their capabilities and market reach; for instance, the December 2022 funding round for Svante, with Chevron as a lead investor, highlights significant M&A and investment trends. Estimated M&A deal values are expected to reach USD 5,000 Million by the end of the forecast period. The market share distribution indicates a strong preference for Software offerings, accounting for an estimated 65% of the total market revenue in 2025.
Carbon Management System Market Industry Evolution
The Carbon Management System market has witnessed remarkable evolution, driven by a confluence of regulatory pressures, technological advancements, and a growing global awareness of climate change. From its nascent stages of basic emissions tracking, the market has matured into sophisticated platforms offering comprehensive sustainability management capabilities, including energy management, greenhouse gas (GHG) management, and air quality management. The historical period (2019-2024) saw a steady increase in adoption, spurred by corporate social responsibility initiatives and initial compliance requirements. The base year, 2025, marks a significant inflection point, with widespread integration of CMS into core business operations across various industries. Technological advancements have played a pivotal role, with the advent of cloud-based solutions, artificial intelligence (AI), and the Internet of Things (IoT) enhancing data accuracy, real-time monitoring, and predictive analytics within CMS. Growth rates have been consistently robust, with an estimated Compound Annual Growth Rate (CAGR) of 15.5% projected for the forecast period (2025-2033). Adoption metrics show a dramatic shift, with over 70% of large enterprises expected to have a dedicated CMS in place by 2025, up from approximately 40% in 2019. Shifting consumer demands and investor expectations for environmentally responsible businesses are further accelerating this evolution. Companies are no longer viewing CMS as a mere compliance tool but as a strategic enabler for operational efficiency, risk mitigation, and enhanced brand reputation. The market's growth trajectory is characterized by continuous innovation in features such as lifecycle assessment, supply chain emissions tracking, and advanced reporting frameworks. The total market size is projected to reach USD 25,000 Million by 2033, a testament to its increasing importance.
Leading Regions, Countries, or Segments in Carbon Management System Market
The Carbon Management System market is experiencing dynamic growth across various regions and segments. Globally, North America and Europe are leading the adoption of CMS, driven by stringent environmental regulations, proactive corporate sustainability initiatives, and a mature market for sustainability consulting services.
Dominant Segments by Offering:
- Software: This segment is the largest and fastest-growing, projected to capture 65% of the market revenue in 2025. Its dominance stems from the increasing need for integrated platforms that automate data collection, analysis, and reporting for sustainability, energy, and greenhouse gas (GHG) management.
- Services: Valued at approximately USD 8,750 Million in 2025, this segment includes consulting, implementation, and training, crucial for organizations to effectively leverage CMS.
Dominant Segments by Application:
- Greenhouse Gas Management: This application area commands the largest share, estimated at 40% of the market in 2025, due to the paramount focus on reducing and reporting GHG emissions.
- Sustainability: This overarching application is crucial for holistic environmental management, encompassing a broader scope beyond just GHG emissions.
Dominant Segments by End-user Verticals:
- Oil and Gas: This sector, despite facing significant transition challenges, is a major investor in CMS for emissions monitoring and reduction, contributing 25% of the market revenue in 2025.
- Manufacturing: With its substantial energy consumption and emission footprints, the manufacturing sector is a key driver for CMS adoption.
- IT and Telecom: This sector is increasingly focusing on its digital footprint's environmental impact, driving demand for specialized CMS solutions.
Key drivers for regional dominance include:
- Investment Trends: Significant investments in renewable energy and sustainable technologies are prevalent in North America and Europe.
- Regulatory Support: Robust government policies and incentives promoting carbon reduction and climate action in these regions.
- Corporate Commitments: A high concentration of multinational corporations with ambitious sustainability goals and reporting requirements.
- Technological Adoption: Early and widespread adoption of advanced technologies like cloud computing and AI, which are integral to modern CMS.
The market share distribution highlights the strategic importance of Software as the core component of most CMS solutions, followed by essential Services that facilitate successful implementation and ongoing optimization. The focus on Greenhouse Gas Management reflects the immediate and pressing global concern over climate change, while the broader Sustainability application captures the evolving landscape of ESG (Environmental, Social, and Governance) reporting.
Carbon Management System Market Product Innovations
Product innovations in the Carbon Management System market are rapidly transforming how organizations manage their environmental impact. Leading vendors are integrating advanced analytics, AI-powered insights, and blockchain technology to enhance data accuracy, traceability, and reporting efficiency. Innovations include real-time emissions monitoring dashboards, predictive modeling for emission reduction strategies, and automated compliance reporting against evolving global standards. For example, platforms are now offering granular tracking of Scope 1, 2, and 3 emissions, along with supply chain sustainability assessments. The integration of IoT sensors for real-time data capture and the development of user-friendly interfaces that simplify complex data analysis are key differentiators. These advancements not only improve operational efficiency but also empower businesses to make more informed decisions towards achieving their sustainability goals, driving a USD 7,500 Million market for innovative CMS solutions by 2025.
Propelling Factors for Carbon Management System Market Growth
Several key factors are propelling the growth of the Carbon Management System market. The escalating urgency of climate change and the Paris Agreement's commitments are driving global regulatory bodies to implement stricter emission reduction policies and carbon pricing mechanisms. This regulatory push is compelling businesses across all sectors to invest in robust CMS solutions for compliance and strategic planning. Furthermore, growing investor and stakeholder demand for transparent ESG (Environmental, Social, and Governance) reporting is a significant driver, as companies strive to attract sustainable investments and enhance their brand reputation. Technological advancements, including AI, machine learning, and cloud computing, are enabling more accurate data collection, sophisticated analysis, and real-time monitoring, making CMS more accessible and effective. The increasing focus on supply chain sustainability and the growing awareness of the financial and operational benefits of carbon footprint reduction, such as cost savings through energy efficiency, further fuel market expansion. The market is projected to grow at a CAGR of 15.5%, reaching USD 25,000 Million by 2033.
Obstacles in the Carbon Management System Market Market
Despite its strong growth trajectory, the Carbon Management System market faces several obstacles. The complexity of data collection and integration from disparate sources across an organization and its supply chain can be a significant hurdle, leading to data inaccuracies and reporting challenges. High initial implementation costs for comprehensive CMS software and services can be a deterrent for small and medium-sized enterprises (SMEs). A lack of standardized global reporting frameworks and varying regulatory requirements across different jurisdictions add to the complexity. Furthermore, the need for skilled personnel to manage and interpret CMS data poses a challenge, as a talent gap exists in sustainability and data analytics expertise. Cybersecurity concerns related to sensitive environmental data also require significant investment and attention. Quantifiable impacts of these obstacles could lead to delayed adoption and increased operational inefficiencies, potentially affecting the projected market size by USD 1,000 Million in the short term if not adequately addressed.
Future Opportunities in Carbon Management System Market
The Carbon Management System market is ripe with future opportunities. The accelerating global transition towards a net-zero economy is creating a persistent demand for advanced CMS solutions capable of managing complex emissions scopes and supporting decarbonization strategies. Emerging markets in Asia-Pacific and Latin America, with their rapidly industrializing economies and increasing environmental consciousness, represent significant untapped potential. Innovations in areas like carbon capture, utilization, and storage (CCUS) integration within CMS platforms will open new avenues. The growing focus on circular economy principles and sustainable supply chain management will drive demand for specialized CMS functionalities. Furthermore, the development of predictive analytics and AI-driven insights for proactive environmental risk management and resource optimization presents substantial growth opportunities, expected to contribute an additional USD 4,000 Million to the market by 2033.
Major Players in the Carbon Management System Market Ecosystem
- Greenstone+ Ltd
- Enablon SA
- IBM Corporation
- IsoMetrix
- ENGIE Impact
- Salesforce com Inc
- Microsoft Corporation
- Schneider Electric SE
- Spher
- GreenStep Solutions Inc
- Simble Solutions Ltd
- SAP SE
Key Developments in Carbon Management System Market Industry
- February 2023: ENGIE Impact announced its partnership with Mölnlycke to move from strategy to implementation. ENGIE is expanding its low-carbon energy expertise from Mölnlycke's operations in Malaysia, which is the company's global operations. Mölnlycke and ENGIE have entered a 15-year, low-carbon energy and services partnership to support Mölnlycke's ambitious new mid- and long-term greenhouse gas (GHG) emission reduction targets. This development highlights the growing trend of strategic partnerships focused on tangible emission reduction implementation.
- December 2022: Chevron New Energies (CNE), a division of Chevron U.S.A. Inc., and Svante announced that Chevron is the lead investor in Svante’s Series E fundraising round, which raised USD 318 million that would be used to accelerate the manufacturing of Svante’s carbon capture technology. These companies are advancing a full value chain carbon capture, utilization, and storage (CCUS) business and believe Svante is poised to be a leader in enabling carbon capture solutions. This event underscores significant investment in carbon capture technologies, a critical component of comprehensive carbon management strategies.
Strategic Carbon Management System Market Market Forecast
The Carbon Management System market is poised for significant strategic growth driven by an intensified global focus on climate action and corporate sustainability. The forecast period (2025–2033) anticipates robust expansion, fueled by an increasing number of enterprises prioritizing decarbonization and ESG performance. Key growth catalysts include evolving regulatory frameworks, such as stricter emission standards and carbon pricing, which necessitate advanced CMS solutions for compliance and strategic advantage. The growing investor demand for sustainable businesses and the rising consumer awareness regarding environmental impact are further accelerating adoption. Technological advancements, particularly in AI, IoT, and cloud computing, will continue to enhance the capabilities of CMS platforms, offering more accurate data analytics and predictive insights. The market's strategic potential lies in its ability to not only facilitate environmental reporting but also to drive operational efficiencies and unlock new avenues for sustainable business practices, leading to a projected market size of USD 25,000 Million by 2033.
Carbon Management System Market Segmentation
-
1. Offering
- 1.1. Software
- 1.2. Services
-
2. Application
- 2.1. Energy
- 2.2. Greenhouse Gas Management
- 2.3. Air Quality Management
- 2.4. Sustainability
- 2.5. Other Applications
-
3. End-user Verticals
- 3.1. Oil and Gas
- 3.2. Manufacturing
- 3.3. Healthcare
- 3.4. IT and Telecom
- 3.5. Other End-user Verticals
Carbon Management System Market Segmentation By Geography
- 1. North America
- 2. Europe
- 3. Asia
- 4. Australia and New Zealand
- 5. Latin America
- 6. Middle East and Africa
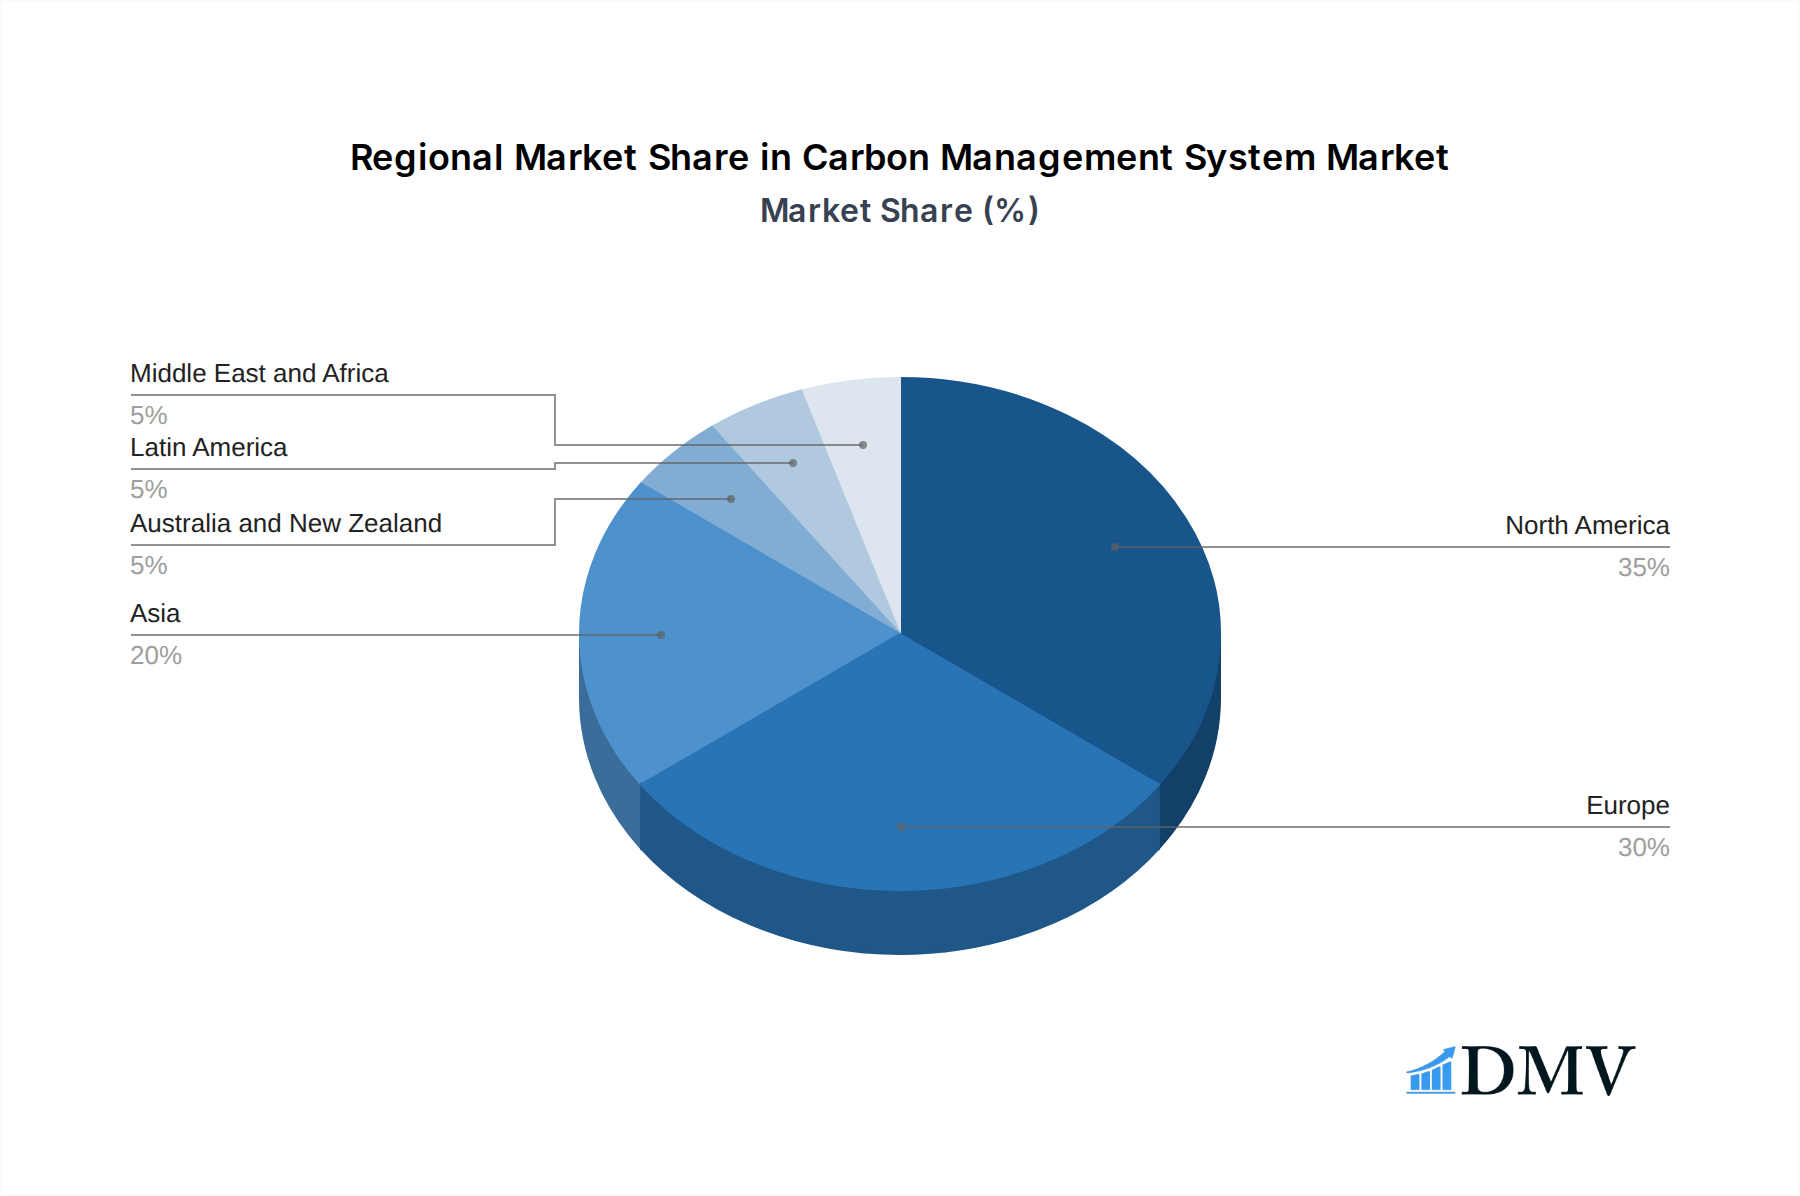
Carbon Management System Market Regional Market Share
Geographic Coverage of Carbon Management System Market
Carbon Management System Market REPORT HIGHLIGHTS
| Aspects | Details |
|---|---|
| Study Period | 2020-2034 |
| Base Year | 2025 |
| Estimated Year | 2026 |
| Forecast Period | 2026-2034 |
| Historical Period | 2020-2025 |
| Growth Rate | CAGR of 12.09% from 2020-2034 |
| Segmentation |
|
Table of Contents
- 1. Introduction
- 1.1. Research Scope
- 1.2. Market Segmentation
- 1.3. Research Objective
- 1.4. Definitions and Assumptions
- 2. Executive Summary
- 2.1. Market Snapshot
- 3. Market Dynamics
- 3.1. Market Drivers
- 3.2. Market Restrains
- 3.3. Market Trends
- 3.4. Market Opportunities
- 4. Market Factor Analysis
- 4.1. Porters Five Forces
- 4.1.1. Bargaining Power of Suppliers
- 4.1.2. Bargaining Power of Buyers
- 4.1.3. Threat of New Entrants
- 4.1.4. Threat of Substitutes
- 4.1.5. Competitive Rivalry
- 4.2. PESTEL analysis
- 4.3. BCG Analysis
- 4.3.1. Stars (High Growth, High Market Share)
- 4.3.2. Cash Cows (Low Growth, High Market Share)
- 4.3.3. Question Mark (High Growth, Low Market Share)
- 4.3.4. Dogs (Low Growth, Low Market Share)
- 4.4. Ansoff Matrix Analysis
- 4.5. Supply Chain Analysis
- 4.6. Regulatory Landscape
- 4.7. Current Market Potential and Opportunity Assessment (TAM–SAM–SOM Framework)
- 4.8. DMV Analyst Note
- 4.1. Porters Five Forces
- 5. Market Analysis, Insights and Forecast 2021-2033
- 5.1. Market Analysis, Insights and Forecast - by Offering
- 5.1.1. Software
- 5.1.2. Services
- 5.2. Market Analysis, Insights and Forecast - by Application
- 5.2.1. Energy
- 5.2.2. Greenhouse Gas Management
- 5.2.3. Air Quality Management
- 5.2.4. Sustainability
- 5.2.5. Other Applications
- 5.3. Market Analysis, Insights and Forecast - by End-user Verticals
- 5.3.1. Oil and Gas
- 5.3.2. Manufacturing
- 5.3.3. Healthcare
- 5.3.4. IT and Telecom
- 5.3.5. Other End-user Verticals
- 5.4. Market Analysis, Insights and Forecast - by Region
- 5.4.1. North America
- 5.4.2. Europe
- 5.4.3. Asia
- 5.4.4. Australia and New Zealand
- 5.4.5. Latin America
- 5.4.6. Middle East and Africa
- 5.1. Market Analysis, Insights and Forecast - by Offering
- 6. Global Carbon Management System Market Analysis, Insights and Forecast, 2021-2033
- 6.1. Market Analysis, Insights and Forecast - by Offering
- 6.1.1. Software
- 6.1.2. Services
- 6.2. Market Analysis, Insights and Forecast - by Application
- 6.2.1. Energy
- 6.2.2. Greenhouse Gas Management
- 6.2.3. Air Quality Management
- 6.2.4. Sustainability
- 6.2.5. Other Applications
- 6.3. Market Analysis, Insights and Forecast - by End-user Verticals
- 6.3.1. Oil and Gas
- 6.3.2. Manufacturing
- 6.3.3. Healthcare
- 6.3.4. IT and Telecom
- 6.3.5. Other End-user Verticals
- 6.1. Market Analysis, Insights and Forecast - by Offering
- 7. North America Carbon Management System Market Analysis, Insights and Forecast, 2020-2032
- 7.1. Market Analysis, Insights and Forecast - by Offering
- 7.1.1. Software
- 7.1.2. Services
- 7.2. Market Analysis, Insights and Forecast - by Application
- 7.2.1. Energy
- 7.2.2. Greenhouse Gas Management
- 7.2.3. Air Quality Management
- 7.2.4. Sustainability
- 7.2.5. Other Applications
- 7.3. Market Analysis, Insights and Forecast - by End-user Verticals
- 7.3.1. Oil and Gas
- 7.3.2. Manufacturing
- 7.3.3. Healthcare
- 7.3.4. IT and Telecom
- 7.3.5. Other End-user Verticals
- 7.1. Market Analysis, Insights and Forecast - by Offering
- 8. Europe Carbon Management System Market Analysis, Insights and Forecast, 2020-2032
- 8.1. Market Analysis, Insights and Forecast - by Offering
- 8.1.1. Software
- 8.1.2. Services
- 8.2. Market Analysis, Insights and Forecast - by Application
- 8.2.1. Energy
- 8.2.2. Greenhouse Gas Management
- 8.2.3. Air Quality Management
- 8.2.4. Sustainability
- 8.2.5. Other Applications
- 8.3. Market Analysis, Insights and Forecast - by End-user Verticals
- 8.3.1. Oil and Gas
- 8.3.2. Manufacturing
- 8.3.3. Healthcare
- 8.3.4. IT and Telecom
- 8.3.5. Other End-user Verticals
- 8.1. Market Analysis, Insights and Forecast - by Offering
- 9. Asia Carbon Management System Market Analysis, Insights and Forecast, 2020-2032
- 9.1. Market Analysis, Insights and Forecast - by Offering
- 9.1.1. Software
- 9.1.2. Services
- 9.2. Market Analysis, Insights and Forecast - by Application
- 9.2.1. Energy
- 9.2.2. Greenhouse Gas Management
- 9.2.3. Air Quality Management
- 9.2.4. Sustainability
- 9.2.5. Other Applications
- 9.3. Market Analysis, Insights and Forecast - by End-user Verticals
- 9.3.1. Oil and Gas
- 9.3.2. Manufacturing
- 9.3.3. Healthcare
- 9.3.4. IT and Telecom
- 9.3.5. Other End-user Verticals
- 9.1. Market Analysis, Insights and Forecast - by Offering
- 10. Australia and New Zealand Carbon Management System Market Analysis, Insights and Forecast, 2020-2032
- 10.1. Market Analysis, Insights and Forecast - by Offering
- 10.1.1. Software
- 10.1.2. Services
- 10.2. Market Analysis, Insights and Forecast - by Application
- 10.2.1. Energy
- 10.2.2. Greenhouse Gas Management
- 10.2.3. Air Quality Management
- 10.2.4. Sustainability
- 10.2.5. Other Applications
- 10.3. Market Analysis, Insights and Forecast - by End-user Verticals
- 10.3.1. Oil and Gas
- 10.3.2. Manufacturing
- 10.3.3. Healthcare
- 10.3.4. IT and Telecom
- 10.3.5. Other End-user Verticals
- 10.1. Market Analysis, Insights and Forecast - by Offering
- 11. Latin America Carbon Management System Market Analysis, Insights and Forecast, 2020-2032
- 11.1. Market Analysis, Insights and Forecast - by Offering
- 11.1.1. Software
- 11.1.2. Services
- 11.2. Market Analysis, Insights and Forecast - by Application
- 11.2.1. Energy
- 11.2.2. Greenhouse Gas Management
- 11.2.3. Air Quality Management
- 11.2.4. Sustainability
- 11.2.5. Other Applications
- 11.3. Market Analysis, Insights and Forecast - by End-user Verticals
- 11.3.1. Oil and Gas
- 11.3.2. Manufacturing
- 11.3.3. Healthcare
- 11.3.4. IT and Telecom
- 11.3.5. Other End-user Verticals
- 11.1. Market Analysis, Insights and Forecast - by Offering
- 12. Middle East and Africa Carbon Management System Market Analysis, Insights and Forecast, 2020-2032
- 12.1. Market Analysis, Insights and Forecast - by Offering
- 12.1.1. Software
- 12.1.2. Services
- 12.2. Market Analysis, Insights and Forecast - by Application
- 12.2.1. Energy
- 12.2.2. Greenhouse Gas Management
- 12.2.3. Air Quality Management
- 12.2.4. Sustainability
- 12.2.5. Other Applications
- 12.3. Market Analysis, Insights and Forecast - by End-user Verticals
- 12.3.1. Oil and Gas
- 12.3.2. Manufacturing
- 12.3.3. Healthcare
- 12.3.4. IT and Telecom
- 12.3.5. Other End-user Verticals
- 12.1. Market Analysis, Insights and Forecast - by Offering
- 13. Competitive Analysis
- 13.1. Company Profiles
- 13.1.1 Greenstone+ Ltd
- 13.1.1.1. Company Overview
- 13.1.1.2. Products
- 13.1.1.3. Company Financials
- 13.1.1.4. SWOT Analysis
- 13.1.2 Enablon SA
- 13.1.2.1. Company Overview
- 13.1.2.2. Products
- 13.1.2.3. Company Financials
- 13.1.2.4. SWOT Analysis
- 13.1.3 IBM Corporation
- 13.1.3.1. Company Overview
- 13.1.3.2. Products
- 13.1.3.3. Company Financials
- 13.1.3.4. SWOT Analysis
- 13.1.4 IsoMetrix
- 13.1.4.1. Company Overview
- 13.1.4.2. Products
- 13.1.4.3. Company Financials
- 13.1.4.4. SWOT Analysis
- 13.1.5 ENGIE Impact
- 13.1.5.1. Company Overview
- 13.1.5.2. Products
- 13.1.5.3. Company Financials
- 13.1.5.4. SWOT Analysis
- 13.1.6 Salesforce com Inc
- 13.1.6.1. Company Overview
- 13.1.6.2. Products
- 13.1.6.3. Company Financials
- 13.1.6.4. SWOT Analysis
- 13.1.7 Microsoft Corporation
- 13.1.7.1. Company Overview
- 13.1.7.2. Products
- 13.1.7.3. Company Financials
- 13.1.7.4. SWOT Analysis
- 13.1.8 Schneider Electric SE
- 13.1.8.1. Company Overview
- 13.1.8.2. Products
- 13.1.8.3. Company Financials
- 13.1.8.4. SWOT Analysis
- 13.1.9 Spher
- 13.1.9.1. Company Overview
- 13.1.9.2. Products
- 13.1.9.3. Company Financials
- 13.1.9.4. SWOT Analysis
- 13.1.10 GreenStep Solutions Inc
- 13.1.10.1. Company Overview
- 13.1.10.2. Products
- 13.1.10.3. Company Financials
- 13.1.10.4. SWOT Analysis
- 13.1.11 Simble Solutions Ltd
- 13.1.11.1. Company Overview
- 13.1.11.2. Products
- 13.1.11.3. Company Financials
- 13.1.11.4. SWOT Analysis
- 13.1.12 SAP SE
- 13.1.12.1. Company Overview
- 13.1.12.2. Products
- 13.1.12.3. Company Financials
- 13.1.12.4. SWOT Analysis
- 13.1.1 Greenstone+ Ltd
- 13.2. Market Entropy
- 13.2.1 Company's Key Areas Served
- 13.2.2 Recent Developments
- 13.3. Company Market Share Analysis 2025
- 13.3.1 Top 5 Companies Market Share Analysis
- 13.3.2 Top 3 Companies Market Share Analysis
- 13.4. List of Potential Customers
- 14. Research Methodology
List of Figures
- Figure 1: Global Carbon Management System Market Revenue Breakdown (Million, %) by Region 2025 & 2033
- Figure 2: North America Carbon Management System Market Revenue (Million), by Offering 2025 & 2033
- Figure 3: North America Carbon Management System Market Revenue Share (%), by Offering 2025 & 2033
- Figure 4: North America Carbon Management System Market Revenue (Million), by Application 2025 & 2033
- Figure 5: North America Carbon Management System Market Revenue Share (%), by Application 2025 & 2033
- Figure 6: North America Carbon Management System Market Revenue (Million), by End-user Verticals 2025 & 2033
- Figure 7: North America Carbon Management System Market Revenue Share (%), by End-user Verticals 2025 & 2033
- Figure 8: North America Carbon Management System Market Revenue (Million), by Country 2025 & 2033
- Figure 9: North America Carbon Management System Market Revenue Share (%), by Country 2025 & 2033
- Figure 10: Europe Carbon Management System Market Revenue (Million), by Offering 2025 & 2033
- Figure 11: Europe Carbon Management System Market Revenue Share (%), by Offering 2025 & 2033
- Figure 12: Europe Carbon Management System Market Revenue (Million), by Application 2025 & 2033
- Figure 13: Europe Carbon Management System Market Revenue Share (%), by Application 2025 & 2033
- Figure 14: Europe Carbon Management System Market Revenue (Million), by End-user Verticals 2025 & 2033
- Figure 15: Europe Carbon Management System Market Revenue Share (%), by End-user Verticals 2025 & 2033
- Figure 16: Europe Carbon Management System Market Revenue (Million), by Country 2025 & 2033
- Figure 17: Europe Carbon Management System Market Revenue Share (%), by Country 2025 & 2033
- Figure 18: Asia Carbon Management System Market Revenue (Million), by Offering 2025 & 2033
- Figure 19: Asia Carbon Management System Market Revenue Share (%), by Offering 2025 & 2033
- Figure 20: Asia Carbon Management System Market Revenue (Million), by Application 2025 & 2033
- Figure 21: Asia Carbon Management System Market Revenue Share (%), by Application 2025 & 2033
- Figure 22: Asia Carbon Management System Market Revenue (Million), by End-user Verticals 2025 & 2033
- Figure 23: Asia Carbon Management System Market Revenue Share (%), by End-user Verticals 2025 & 2033
- Figure 24: Asia Carbon Management System Market Revenue (Million), by Country 2025 & 2033
- Figure 25: Asia Carbon Management System Market Revenue Share (%), by Country 2025 & 2033
- Figure 26: Australia and New Zealand Carbon Management System Market Revenue (Million), by Offering 2025 & 2033
- Figure 27: Australia and New Zealand Carbon Management System Market Revenue Share (%), by Offering 2025 & 2033
- Figure 28: Australia and New Zealand Carbon Management System Market Revenue (Million), by Application 2025 & 2033
- Figure 29: Australia and New Zealand Carbon Management System Market Revenue Share (%), by Application 2025 & 2033
- Figure 30: Australia and New Zealand Carbon Management System Market Revenue (Million), by End-user Verticals 2025 & 2033
- Figure 31: Australia and New Zealand Carbon Management System Market Revenue Share (%), by End-user Verticals 2025 & 2033
- Figure 32: Australia and New Zealand Carbon Management System Market Revenue (Million), by Country 2025 & 2033
- Figure 33: Australia and New Zealand Carbon Management System Market Revenue Share (%), by Country 2025 & 2033
- Figure 34: Latin America Carbon Management System Market Revenue (Million), by Offering 2025 & 2033
- Figure 35: Latin America Carbon Management System Market Revenue Share (%), by Offering 2025 & 2033
- Figure 36: Latin America Carbon Management System Market Revenue (Million), by Application 2025 & 2033
- Figure 37: Latin America Carbon Management System Market Revenue Share (%), by Application 2025 & 2033
- Figure 38: Latin America Carbon Management System Market Revenue (Million), by End-user Verticals 2025 & 2033
- Figure 39: Latin America Carbon Management System Market Revenue Share (%), by End-user Verticals 2025 & 2033
- Figure 40: Latin America Carbon Management System Market Revenue (Million), by Country 2025 & 2033
- Figure 41: Latin America Carbon Management System Market Revenue Share (%), by Country 2025 & 2033
- Figure 42: Middle East and Africa Carbon Management System Market Revenue (Million), by Offering 2025 & 2033
- Figure 43: Middle East and Africa Carbon Management System Market Revenue Share (%), by Offering 2025 & 2033
- Figure 44: Middle East and Africa Carbon Management System Market Revenue (Million), by Application 2025 & 2033
- Figure 45: Middle East and Africa Carbon Management System Market Revenue Share (%), by Application 2025 & 2033
- Figure 46: Middle East and Africa Carbon Management System Market Revenue (Million), by End-user Verticals 2025 & 2033
- Figure 47: Middle East and Africa Carbon Management System Market Revenue Share (%), by End-user Verticals 2025 & 2033
- Figure 48: Middle East and Africa Carbon Management System Market Revenue (Million), by Country 2025 & 2033
- Figure 49: Middle East and Africa Carbon Management System Market Revenue Share (%), by Country 2025 & 2033
List of Tables
- Table 1: Global Carbon Management System Market Revenue Million Forecast, by Offering 2020 & 2033
- Table 2: Global Carbon Management System Market Revenue Million Forecast, by Application 2020 & 2033
- Table 3: Global Carbon Management System Market Revenue Million Forecast, by End-user Verticals 2020 & 2033
- Table 4: Global Carbon Management System Market Revenue Million Forecast, by Region 2020 & 2033
- Table 5: Global Carbon Management System Market Revenue Million Forecast, by Offering 2020 & 2033
- Table 6: Global Carbon Management System Market Revenue Million Forecast, by Application 2020 & 2033
- Table 7: Global Carbon Management System Market Revenue Million Forecast, by End-user Verticals 2020 & 2033
- Table 8: Global Carbon Management System Market Revenue Million Forecast, by Country 2020 & 2033
- Table 9: Global Carbon Management System Market Revenue Million Forecast, by Offering 2020 & 2033
- Table 10: Global Carbon Management System Market Revenue Million Forecast, by Application 2020 & 2033
- Table 11: Global Carbon Management System Market Revenue Million Forecast, by End-user Verticals 2020 & 2033
- Table 12: Global Carbon Management System Market Revenue Million Forecast, by Country 2020 & 2033
- Table 13: Global Carbon Management System Market Revenue Million Forecast, by Offering 2020 & 2033
- Table 14: Global Carbon Management System Market Revenue Million Forecast, by Application 2020 & 2033
- Table 15: Global Carbon Management System Market Revenue Million Forecast, by End-user Verticals 2020 & 2033
- Table 16: Global Carbon Management System Market Revenue Million Forecast, by Country 2020 & 2033
- Table 17: Global Carbon Management System Market Revenue Million Forecast, by Offering 2020 & 2033
- Table 18: Global Carbon Management System Market Revenue Million Forecast, by Application 2020 & 2033
- Table 19: Global Carbon Management System Market Revenue Million Forecast, by End-user Verticals 2020 & 2033
- Table 20: Global Carbon Management System Market Revenue Million Forecast, by Country 2020 & 2033
- Table 21: Global Carbon Management System Market Revenue Million Forecast, by Offering 2020 & 2033
- Table 22: Global Carbon Management System Market Revenue Million Forecast, by Application 2020 & 2033
- Table 23: Global Carbon Management System Market Revenue Million Forecast, by End-user Verticals 2020 & 2033
- Table 24: Global Carbon Management System Market Revenue Million Forecast, by Country 2020 & 2033
- Table 25: Global Carbon Management System Market Revenue Million Forecast, by Offering 2020 & 2033
- Table 26: Global Carbon Management System Market Revenue Million Forecast, by Application 2020 & 2033
- Table 27: Global Carbon Management System Market Revenue Million Forecast, by End-user Verticals 2020 & 2033
- Table 28: Global Carbon Management System Market Revenue Million Forecast, by Country 2020 & 2033
Frequently Asked Questions
1. What is the projected Compound Annual Growth Rate (CAGR) of the Carbon Management System Market?
The projected CAGR is approximately 12.09%.
2. Which companies are prominent players in the Carbon Management System Market?
Key companies in the market include Greenstone+ Ltd, Enablon SA, IBM Corporation, IsoMetrix, ENGIE Impact, Salesforce com Inc, Microsoft Corporation, Schneider Electric SE, Spher, GreenStep Solutions Inc, Simble Solutions Ltd, SAP SE.
3. What are the main segments of the Carbon Management System Market?
The market segments include Offering, Application, End-user Verticals.
4. Can you provide details about the market size?
The market size is estimated to be USD 14.37 Million as of 2022.
5. What are some drivers contributing to market growth?
Increasing Environmental Concerns and Focus on Reducing Carbon Footprints.
6. What are the notable trends driving market growth?
Oil and Gas Sector to Witness the Growth.
7. Are there any restraints impacting market growth?
Fragmented Nature of the Market and Growing Incidence of Data Breaches and Lack of Supporting Infrastructure; Lack of Cybersecurity Professionals.
8. Can you provide examples of recent developments in the market?
February 2023 - ENGIE Impact announced its partnership with Mölnlycke to move from strategy to implementation. ENGIE is expanding its low-carbon energy expertise from Mölnlycke's operations in Malaysia, which is the company's global operations. Mölnlycke and ENGIE have entered a 15-year, low-carbon energy and services partnership to support Mölnlycke's ambitious new mid- and long-term greenhouse gas (GHG) emission reduction targets.
9. What pricing options are available for accessing the report?
Pricing options include single-user, multi-user, and enterprise licenses priced at USD 4750, USD 5250, and USD 8750 respectively.
10. Is the market size provided in terms of value or volume?
The market size is provided in terms of value, measured in Million.
11. Are there any specific market keywords associated with the report?
Yes, the market keyword associated with the report is "Carbon Management System Market," which aids in identifying and referencing the specific market segment covered.
12. How do I determine which pricing option suits my needs best?
The pricing options vary based on user requirements and access needs. Individual users may opt for single-user licenses, while businesses requiring broader access may choose multi-user or enterprise licenses for cost-effective access to the report.
13. Are there any additional resources or data provided in the Carbon Management System Market report?
While the report offers comprehensive insights, it's advisable to review the specific contents or supplementary materials provided to ascertain if additional resources or data are available.
14. How can I stay updated on further developments or reports in the Carbon Management System Market?
To stay informed about further developments, trends, and reports in the Carbon Management System Market, consider subscribing to industry newsletters, following relevant companies and organizations, or regularly checking reputable industry news sources and publications.
Methodology
Step 1 - Identification of Relevant Samples Size from Population Database


Step 2 - Approaches for Defining Global Market Size (Value, Volume* & Price*)

Note*: In applicable scenarios
Step 3 - Data Sources
Primary Research
- Web Analytics
- Survey Reports
- Research Institute
- Latest Research Reports
- Opinion Leaders
Secondary Research
- Annual Reports
- White Paper
- Latest Press Release
- Industry Association
- Paid Database
- Investor Presentations

Step 4 - Data Triangulation
Involves using different sources of information in order to increase the validity of a study
These sources are likely to be stakeholders in a program - participants, other researchers, program staff, other community members, and so on.
Then we put all data in single framework & apply various statistical tools to find out the dynamic on the market.
During the analysis stage, feedback from the stakeholder groups would be compared to determine areas of agreement as well as areas of divergence