

Key Insights
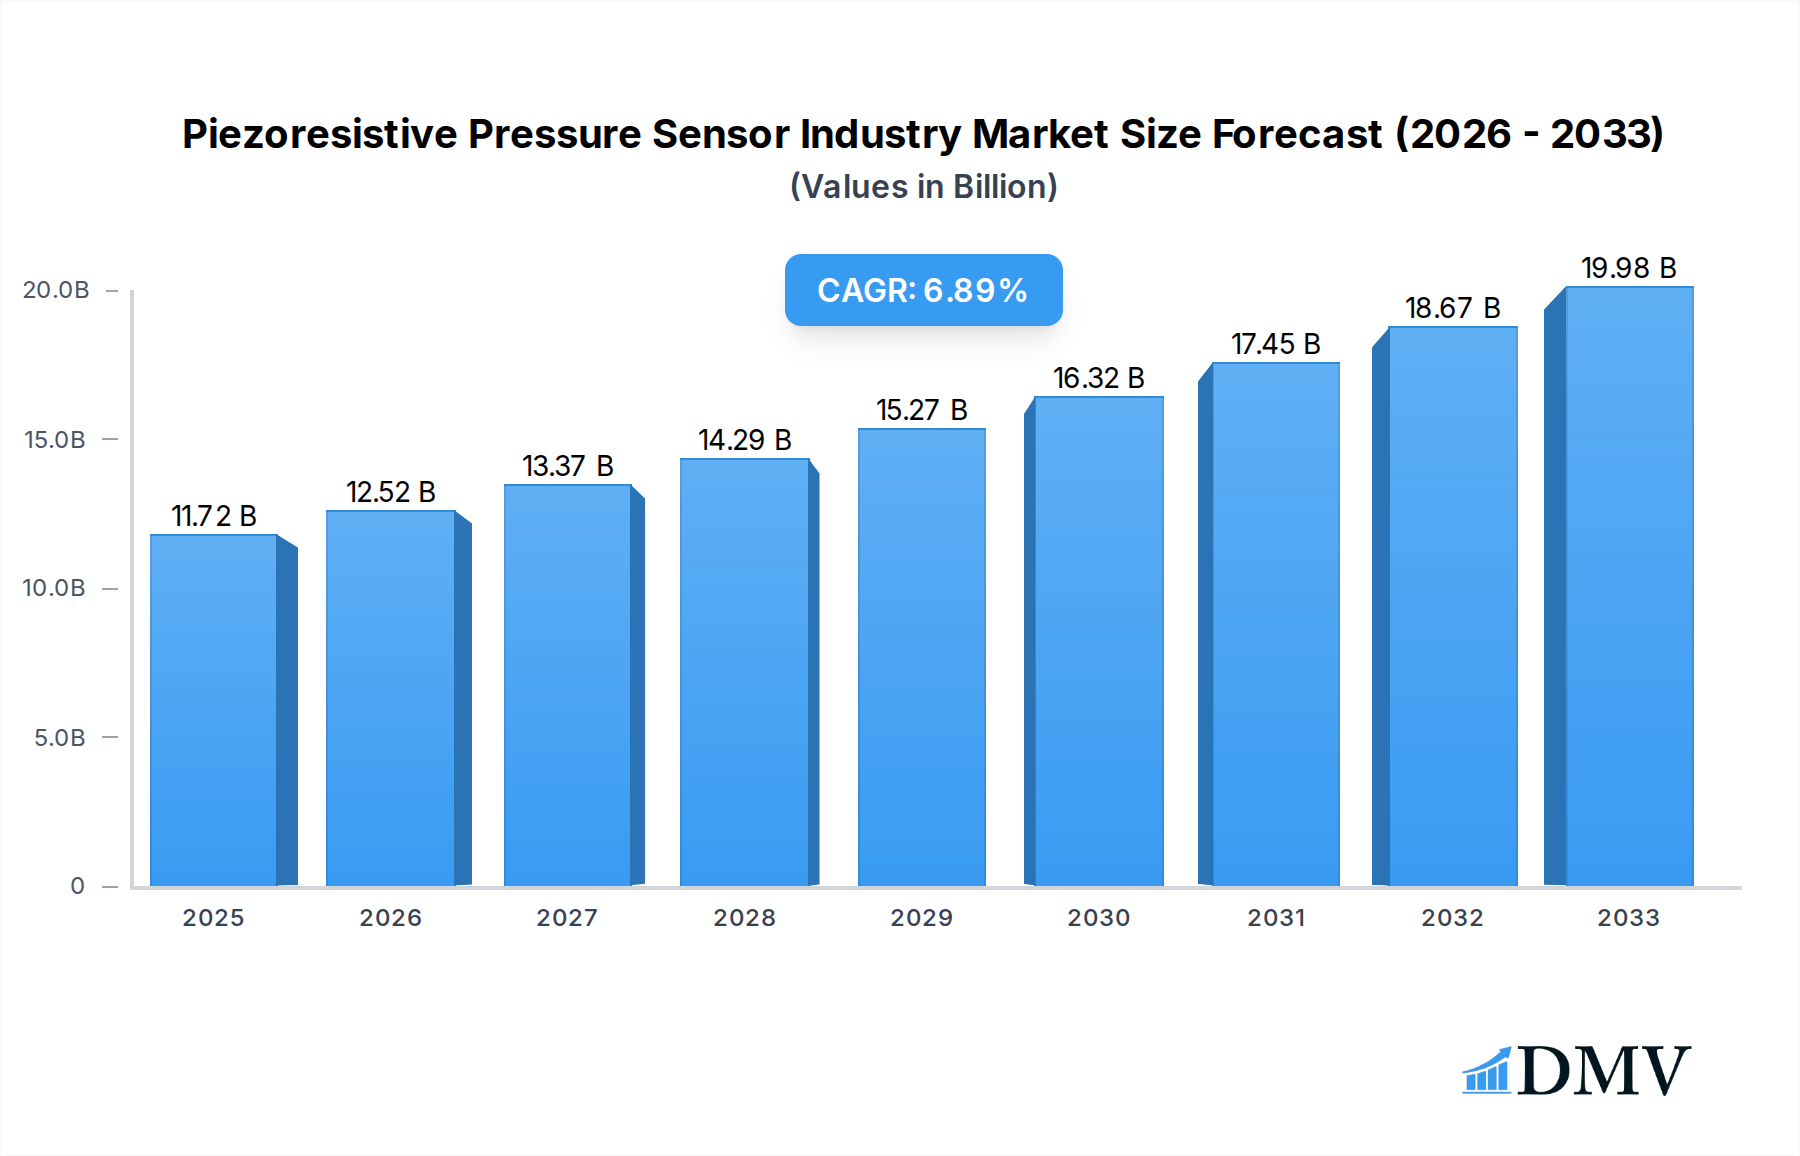
The global piezoresistive pressure sensor market is poised for robust expansion, projected to reach USD 11,720 million by 2025. This growth is fueled by an estimated Compound Annual Growth Rate (CAGR) of 6.8% through 2033, indicating a sustained upward trajectory. The market's dynamism is driven by increasing adoption of advanced technologies across various sectors, including automotive, healthcare, and industrial automation. In the automotive sector, piezoresistive pressure sensors are integral for engine management, tire pressure monitoring, and advanced driver-assistance systems (ADAS), all of which are experiencing significant demand. The healthcare industry relies on these sensors for critical medical devices such as ventilators, infusion pumps, and blood pressure monitors, where accuracy and reliability are paramount. Furthermore, the ongoing industrial revolution, marked by the proliferation of the Internet of Things (IoT) and smart manufacturing, necessitates precise pressure measurement for process control, safety, and efficiency.

Piezoresistive Pressure Sensor Industry Market Size (In Billion)
The market segmentation reveals a strong reliance on Silicon as the primary material, attributed to its excellent piezoresistive properties, cost-effectiveness, and miniaturization capabilities. Ceramic and other advanced materials are also gaining traction, catering to specialized applications requiring enhanced durability and performance under extreme conditions. While the automotive and industrial sectors are anticipated to be the largest end-user segments, the healthcare industry presents a rapidly growing area of opportunity, driven by an aging global population and advancements in medical technology. The proliferation of smart devices and the demand for higher accuracy in measurement are key trends. However, challenges such as the high initial investment for advanced manufacturing facilities and the potential for price erosion due to intense competition could temper growth to some extent. Despite these restraints, the overarching demand for intelligent sensing solutions across a spectrum of critical applications ensures a favorable market outlook for piezoresistive pressure sensors.
Piezoresistive Pressure Sensor Industry Company Market Share
Piezoresistive Pressure Sensor Industry Market Composition & Trends
The global Piezoresistive Pressure Sensor market, a critical component in diverse industrial applications, exhibits a dynamic competitive landscape. Analysis of market concentration reveals a moderate level, with several key players vying for dominance. Leading companies like Honeywell International Inc., First Sensor AG, and Ninghai Sendo Sensor Co Ltd. hold significant market share, estimated at over $5,500 million collectively. Innovation remains a key catalyst, driven by relentless demand for enhanced accuracy, miniaturization, and ruggedness across end-user industries. The regulatory landscape, while not overly restrictive, emphasizes adherence to safety and performance standards, particularly in automotive and healthcare sectors. Substitute products, such as capacitive and optical pressure sensors, present a moderate threat, but piezoresistive sensors maintain their edge in cost-effectiveness and established reliability for many applications. End-user profiles are increasingly sophisticated, demanding custom solutions tailored to specific operational environments. Mergers and acquisitions are a notable trend, with recent deal values estimated to exceed $1,200 million, aimed at consolidating market share, acquiring innovative technologies, and expanding geographical reach.
- Market Share Distribution: While exact figures are proprietary, the top 5 companies are estimated to control over 45% of the global piezoresistive pressure sensor market.
- M&A Deal Values: Significant acquisitions in the last three years have collectively amounted to over $1,200 million, indicating strategic consolidation.
- Innovation Focus: Miniaturization for IoT devices, improved temperature compensation, and enhanced durability in harsh environments are key R&D areas.
- Regulatory Impact: Compliance with ISO standards for automotive and medical devices is a significant factor influencing product development.
Piezoresistive Pressure Sensor Industry Industry Evolution
The Piezoresistive Pressure Sensor industry has witnessed a consistent and robust growth trajectory over the historical period of 2019-2024, driven by the pervasive integration of these sensors across a multitude of sectors. The market size, estimated at approximately $7,800 million in 2024, is projected to ascend steadily, fueled by technological advancements and expanding applications. Throughout the historical period, market growth rates averaged a healthy 6.5% annually, a testament to the increasing reliance on precise pressure measurement for critical functions. This evolution is intrinsically linked to key technological advancements. The transition from bulk silicon micromachining to more advanced fabrication techniques has enabled the development of smaller, more energy-efficient, and highly accurate piezoresistive pressure sensors. Furthermore, improvements in material science, particularly in the development of novel piezoresistive materials and packaging, have enhanced sensor performance in extreme temperatures and corrosive environments.
Shifting consumer demands have also played a pivotal role in shaping the industry's evolution. The rise of the Industrial Internet of Things (IIoT) has created an insatiable appetite for connected sensors that can provide real-time data for predictive maintenance, process optimization, and automation. In the automotive sector, stringent safety regulations and the drive towards autonomous driving have necessitated the widespread adoption of advanced pressure sensing solutions for tire pressure monitoring systems (TPMS), brake systems, and engine management. Similarly, the healthcare industry's demand for reliable and sterile medical devices, from ventilators to infusion pumps, has further propelled the growth of piezoresistive pressure sensors. The forecast period (2025-2033) anticipates continued strong growth, with an estimated Compound Annual Growth Rate (CAGR) of approximately 7.2%, driven by the ongoing digital transformation across industries and emerging applications in smart cities and advanced environmental monitoring. The base year of 2025 is expected to see a market valuation of around $8,300 million, with further expansion anticipated as new use cases emerge and existing ones deepen their integration.
Leading Regions, Countries, or Segments in Piezoresistive Pressure Sensor Industry
The Industrial segment, followed closely by the Automotive sector, stands as the dominant force in the Piezoresistive Pressure Sensor industry. This dominance is intricately linked to the sheer volume of applications and the critical nature of precise pressure monitoring in these domains. Within the Material segment, Silicon based piezoresistive pressure sensors lead the pack, accounting for an estimated 60% of the market share. This is attributed to silicon's inherent properties: excellent piezoresistive coefficients, mature manufacturing processes, and the ability to be microfabricated into highly integrated and cost-effective devices.
Industrial Segment Dominance:
- Key Drivers: Massive adoption in manufacturing automation, process control systems, HVAC, and environmental monitoring drives significant demand. The IIoT revolution is a major catalyst, necessitating a vast network of interconnected sensors for real-time data acquisition and analysis.
- Investment Trends: High levels of investment in smart factories and Industry 4.0 initiatives across North America and Europe directly translate to increased demand for industrial-grade pressure sensors.
- Regulatory Support: While not always explicit, stringent safety and efficiency regulations in industrial processes indirectly encourage the adoption of reliable pressure sensing technologies.
Automotive Sector Growth:
- Key Drivers: The increasing prevalence of Advanced Driver-Assistance Systems (ADAS), electric vehicles (EVs), and stringent emission standards are key growth catalysts. Tire Pressure Monitoring Systems (TPMS) are mandated in many regions, creating a substantial baseline demand.
- Country-Specific Dominance: Countries with strong automotive manufacturing bases, such as Germany, the United States, and China, exhibit particularly high demand for automotive-grade piezoresistive pressure sensors.
Silicon Material Leadership:
- Technological Advancements: Ongoing innovation in silicon MEMS (Micro-Electro-Mechanical Systems) technology allows for smaller footprints, higher sensitivity, and reduced power consumption, making them ideal for a wide range of applications.
- Cost-Effectiveness: The mature and scalable manufacturing processes for silicon sensors contribute to their competitive pricing, making them an attractive choice for high-volume applications.
Emerging End-Users: While Industrial and Automotive lead, Healthcare is a rapidly growing segment, driven by the demand for reliable sensors in medical devices like ventilators, blood pressure monitors, and diagnostic equipment.
Piezoresistive Pressure Sensor Industry Product Innovations
Product innovation in the Piezoresistive Pressure Sensor industry is primarily focused on enhancing performance metrics and expanding application scope. Key advancements include the development of ultra-miniature sensors with improved accuracy and linearity, crucial for the burgeoning IoT and wearable device markets. Enhanced temperature compensation algorithms and integrated digital interfaces are becoming standard, simplifying integration and improving data reliability. Furthermore, innovations in packaging materials are enabling sensors to withstand extreme environmental conditions, such as high pressure, corrosive chemicals, and extreme temperatures, opening up new opportunities in the oil and gas, and aerospace industries. The development of smart sensors with built-in diagnostic capabilities and predictive maintenance features represents a significant leap forward, offering end-users greater control and efficiency.
Propelling Factors for Piezoresistive Pressure Sensor Industry Growth
Several key factors are propelling the growth of the Piezoresistive Pressure Sensor industry. Technological advancements in MEMS fabrication and material science enable smaller, more accurate, and more robust sensors. The exponential growth of the Industrial Internet of Things (IIoT) necessitates widespread deployment of reliable pressure sensors for process monitoring and automation. In the automotive sector, increasing safety regulations and the shift towards electric and autonomous vehicles are driving demand. Economic development in emerging economies also fuels industrialization and infrastructure projects, further increasing the need for pressure sensing solutions.
Obstacles in the Piezoresistive Pressure Sensor Industry Market
Despite strong growth, the Piezoresistive Pressure Sensor industry faces several obstacles. Supply chain disruptions, exacerbated by geopolitical events and raw material shortages, can impact production timelines and costs. Intense competitive pressures from both established players and new entrants lead to price erosion in certain segments. Stringent quality control and certification requirements, particularly in sensitive sectors like healthcare and aerospace, can increase development and manufacturing costs. Furthermore, the increasing complexity of integration with advanced digital systems requires significant R&D investment and skilled workforce, posing a challenge for smaller manufacturers.
Future Opportunities in Piezoresistive Pressure Sensor Industry
The future holds significant opportunities for the Piezoresistive Pressure Sensor industry. The expansion of smart cities will drive demand for sensors in infrastructure monitoring, environmental control, and smart grids. The growing renewable energy sector, particularly wind and solar power, requires robust pressure sensing for operational efficiency and safety. The continued evolution of wearable technology and consumer electronics will create demand for miniaturized and low-power pressure sensors. Emerging applications in agriculture technology (AgTech) for soil moisture and irrigation monitoring also present a promising avenue for growth.
Major Players in the Piezoresistive Pressure Sensor Industry Ecosystem
- Honeywell International Inc.
- First Sensor AG
- Ninghai Sendo Sensor Co Ltd.
- Kistler Group
- BCM Sensor Technologies BVBA
- Metallux SA
- Impress Sensors and Systems Ltd
- BD Sensors GmBH
- Pewatron AG
- All Sensors Corporation
- Rosemount Inc (Emerson Electric Company)
Key Developments in Piezoresistive Pressure Sensor Industry Industry
- 2023: Honeywell introduces a new generation of highly accurate, miniaturized piezoresistive sensors for IIoT applications, enabling predictive maintenance.
- 2023: First Sensor AG announces expanded manufacturing capabilities to meet rising demand for automotive-grade pressure sensors.
- 2024: Kistler Group expands its portfolio with integrated pressure sensors for advanced powertrain applications.
- 2024: Ninghai Sendo Sensor Co Ltd. launches a series of ruggedized piezoresistive sensors designed for harsh industrial environments.
- 2024: BD Sensors GmBH unveils a new line of intrinsically safe pressure transmitters for hazardous area applications.
- 2025: All Sensors Corporation announces a strategic partnership to enhance its distribution network for medical device manufacturers.
- 2025: Rosemount Inc. (Emerson Electric Company) showcases advancements in wireless pressure sensing technology for remote monitoring.
Strategic Piezoresistive Pressure Sensor Industry Market Forecast
The strategic forecast for the Piezoresistive Pressure Sensor industry anticipates continued robust growth, driven by ongoing technological innovation and the relentless integration of sensors across key sectors. The forecast period (2025-2033) is projected to witness significant expansion, with market valuation expected to surpass $15,000 million by 2033, building upon an estimated $8,300 million in 2025. Key growth catalysts include the pervasive adoption of IoT, the increasing sophistication of automotive systems, and the demand for precise measurement in advanced healthcare devices. Emerging opportunities in smart infrastructure and renewable energy sectors further bolster this positive outlook. Strategic investments in R&D for miniaturization, enhanced accuracy, and ruggedness will be crucial for capitalizing on these opportunities and maintaining a competitive edge.
Piezoresistive Pressure Sensor Industry Segmentation
-
1. Material
- 1.1. Silicon
- 1.2. Ceramic
- 1.3. Other Materials
-
2. End User
- 2.1. Automotive
- 2.2. Healthcare
- 2.3. Industrial
- 2.4. Oil and Gas
- 2.5. Other End Users
Piezoresistive Pressure Sensor Industry Segmentation By Geography
- 1. North America
- 2. Europe
- 3. Asia Pacific
- 4. Latin America
- 5. Middle East and Africa
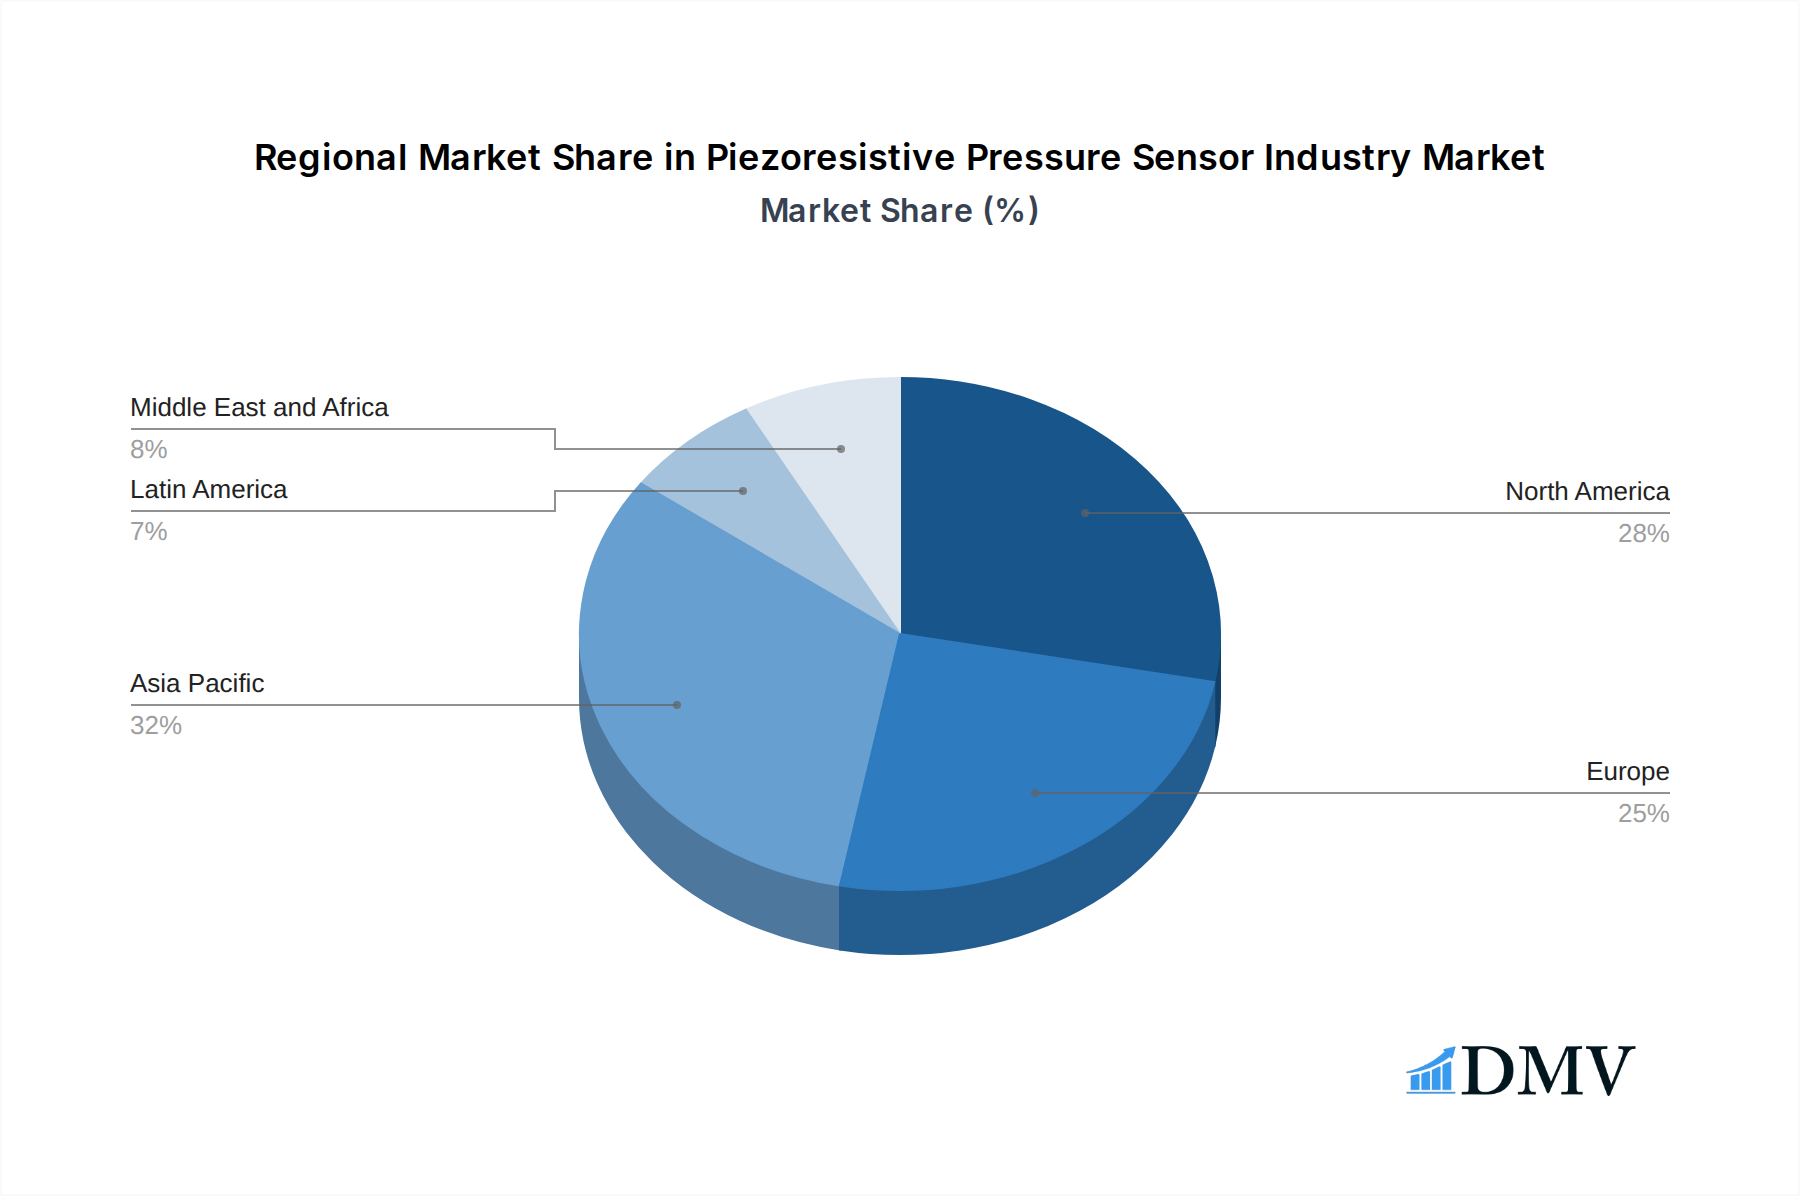
Piezoresistive Pressure Sensor Industry Regional Market Share
Geographic Coverage of Piezoresistive Pressure Sensor Industry
Piezoresistive Pressure Sensor Industry REPORT HIGHLIGHTS
| Aspects | Details |
|---|---|
| Study Period | 2020-2034 |
| Base Year | 2025 |
| Estimated Year | 2026 |
| Forecast Period | 2026-2034 |
| Historical Period | 2020-2025 |
| Growth Rate | CAGR of 6.8% from 2020-2034 |
| Segmentation |
|
Table of Contents
- 1. Introduction
- 1.1. Research Scope
- 1.2. Market Segmentation
- 1.3. Research Objective
- 1.4. Definitions and Assumptions
- 2. Executive Summary
- 2.1. Market Snapshot
- 3. Market Dynamics
- 3.1. Market Drivers
- 3.2. Market Restrains
- 3.3. Market Trends
- 3.4. Market Opportunities
- 4. Market Factor Analysis
- 4.1. Porters Five Forces
- 4.1.1. Bargaining Power of Suppliers
- 4.1.2. Bargaining Power of Buyers
- 4.1.3. Threat of New Entrants
- 4.1.4. Threat of Substitutes
- 4.1.5. Competitive Rivalry
- 4.2. PESTEL analysis
- 4.3. BCG Analysis
- 4.3.1. Stars (High Growth, High Market Share)
- 4.3.2. Cash Cows (Low Growth, High Market Share)
- 4.3.3. Question Mark (High Growth, Low Market Share)
- 4.3.4. Dogs (Low Growth, Low Market Share)
- 4.4. Ansoff Matrix Analysis
- 4.5. Supply Chain Analysis
- 4.6. Regulatory Landscape
- 4.7. Current Market Potential and Opportunity Assessment (TAM–SAM–SOM Framework)
- 4.8. DMV Analyst Note
- 4.1. Porters Five Forces
- 5. Market Analysis, Insights and Forecast 2021-2033
- 5.1. Market Analysis, Insights and Forecast - by Material
- 5.1.1. Silicon
- 5.1.2. Ceramic
- 5.1.3. Other Materials
- 5.2. Market Analysis, Insights and Forecast - by End User
- 5.2.1. Automotive
- 5.2.2. Healthcare
- 5.2.3. Industrial
- 5.2.4. Oil and Gas
- 5.2.5. Other End Users
- 5.3. Market Analysis, Insights and Forecast - by Region
- 5.3.1. North America
- 5.3.2. Europe
- 5.3.3. Asia Pacific
- 5.3.4. Latin America
- 5.3.5. Middle East and Africa
- 5.1. Market Analysis, Insights and Forecast - by Material
- 6. Global Piezoresistive Pressure Sensor Industry Analysis, Insights and Forecast, 2021-2033
- 6.1. Market Analysis, Insights and Forecast - by Material
- 6.1.1. Silicon
- 6.1.2. Ceramic
- 6.1.3. Other Materials
- 6.2. Market Analysis, Insights and Forecast - by End User
- 6.2.1. Automotive
- 6.2.2. Healthcare
- 6.2.3. Industrial
- 6.2.4. Oil and Gas
- 6.2.5. Other End Users
- 6.1. Market Analysis, Insights and Forecast - by Material
- 7. North America Piezoresistive Pressure Sensor Industry Analysis, Insights and Forecast, 2020-2032
- 7.1. Market Analysis, Insights and Forecast - by Material
- 7.1.1. Silicon
- 7.1.2. Ceramic
- 7.1.3. Other Materials
- 7.2. Market Analysis, Insights and Forecast - by End User
- 7.2.1. Automotive
- 7.2.2. Healthcare
- 7.2.3. Industrial
- 7.2.4. Oil and Gas
- 7.2.5. Other End Users
- 7.1. Market Analysis, Insights and Forecast - by Material
- 8. Europe Piezoresistive Pressure Sensor Industry Analysis, Insights and Forecast, 2020-2032
- 8.1. Market Analysis, Insights and Forecast - by Material
- 8.1.1. Silicon
- 8.1.2. Ceramic
- 8.1.3. Other Materials
- 8.2. Market Analysis, Insights and Forecast - by End User
- 8.2.1. Automotive
- 8.2.2. Healthcare
- 8.2.3. Industrial
- 8.2.4. Oil and Gas
- 8.2.5. Other End Users
- 8.1. Market Analysis, Insights and Forecast - by Material
- 9. Asia Pacific Piezoresistive Pressure Sensor Industry Analysis, Insights and Forecast, 2020-2032
- 9.1. Market Analysis, Insights and Forecast - by Material
- 9.1.1. Silicon
- 9.1.2. Ceramic
- 9.1.3. Other Materials
- 9.2. Market Analysis, Insights and Forecast - by End User
- 9.2.1. Automotive
- 9.2.2. Healthcare
- 9.2.3. Industrial
- 9.2.4. Oil and Gas
- 9.2.5. Other End Users
- 9.1. Market Analysis, Insights and Forecast - by Material
- 10. Latin America Piezoresistive Pressure Sensor Industry Analysis, Insights and Forecast, 2020-2032
- 10.1. Market Analysis, Insights and Forecast - by Material
- 10.1.1. Silicon
- 10.1.2. Ceramic
- 10.1.3. Other Materials
- 10.2. Market Analysis, Insights and Forecast - by End User
- 10.2.1. Automotive
- 10.2.2. Healthcare
- 10.2.3. Industrial
- 10.2.4. Oil and Gas
- 10.2.5. Other End Users
- 10.1. Market Analysis, Insights and Forecast - by Material
- 11. Middle East and Africa Piezoresistive Pressure Sensor Industry Analysis, Insights and Forecast, 2020-2032
- 11.1. Market Analysis, Insights and Forecast - by Material
- 11.1.1. Silicon
- 11.1.2. Ceramic
- 11.1.3. Other Materials
- 11.2. Market Analysis, Insights and Forecast - by End User
- 11.2.1. Automotive
- 11.2.2. Healthcare
- 11.2.3. Industrial
- 11.2.4. Oil and Gas
- 11.2.5. Other End Users
- 11.1. Market Analysis, Insights and Forecast - by Material
- 12. Competitive Analysis
- 12.1. Company Profiles
- 12.1.1 Honeywell International Inc
- 12.1.1.1. Company Overview
- 12.1.1.2. Products
- 12.1.1.3. Company Financials
- 12.1.1.4. SWOT Analysis
- 12.1.2 First Sensor AG
- 12.1.2.1. Company Overview
- 12.1.2.2. Products
- 12.1.2.3. Company Financials
- 12.1.2.4. SWOT Analysis
- 12.1.3 Ninghai Sendo Sensor Co Ltd
- 12.1.3.1. Company Overview
- 12.1.3.2. Products
- 12.1.3.3. Company Financials
- 12.1.3.4. SWOT Analysis
- 12.1.4 Kistler Group
- 12.1.4.1. Company Overview
- 12.1.4.2. Products
- 12.1.4.3. Company Financials
- 12.1.4.4. SWOT Analysis
- 12.1.5 BCM Sensor Technologies BVBA
- 12.1.5.1. Company Overview
- 12.1.5.2. Products
- 12.1.5.3. Company Financials
- 12.1.5.4. SWOT Analysis
- 12.1.6 Metallux SA
- 12.1.6.1. Company Overview
- 12.1.6.2. Products
- 12.1.6.3. Company Financials
- 12.1.6.4. SWOT Analysis
- 12.1.7 Impress Sensors and Systems Ltd
- 12.1.7.1. Company Overview
- 12.1.7.2. Products
- 12.1.7.3. Company Financials
- 12.1.7.4. SWOT Analysis
- 12.1.8 BD Sensors GmBH
- 12.1.8.1. Company Overview
- 12.1.8.2. Products
- 12.1.8.3. Company Financials
- 12.1.8.4. SWOT Analysis
- 12.1.9 Pewatron AG
- 12.1.9.1. Company Overview
- 12.1.9.2. Products
- 12.1.9.3. Company Financials
- 12.1.9.4. SWOT Analysis
- 12.1.10 All Sensors Corporation
- 12.1.10.1. Company Overview
- 12.1.10.2. Products
- 12.1.10.3. Company Financials
- 12.1.10.4. SWOT Analysis
- 12.1.11 Rosemount Inc (Emerson Electric Company)
- 12.1.11.1. Company Overview
- 12.1.11.2. Products
- 12.1.11.3. Company Financials
- 12.1.11.4. SWOT Analysis
- 12.1.1 Honeywell International Inc
- 12.2. Market Entropy
- 12.2.1 Company's Key Areas Served
- 12.2.2 Recent Developments
- 12.3. Company Market Share Analysis 2025
- 12.3.1 Top 5 Companies Market Share Analysis
- 12.3.2 Top 3 Companies Market Share Analysis
- 12.4. List of Potential Customers
- 13. Research Methodology
List of Figures
- Figure 1: Global Piezoresistive Pressure Sensor Industry Revenue Breakdown (million, %) by Region 2025 & 2033
- Figure 2: Global Piezoresistive Pressure Sensor Industry Volume Breakdown (K Unit, %) by Region 2025 & 2033
- Figure 3: North America Piezoresistive Pressure Sensor Industry Revenue (million), by Material 2025 & 2033
- Figure 4: North America Piezoresistive Pressure Sensor Industry Volume (K Unit), by Material 2025 & 2033
- Figure 5: North America Piezoresistive Pressure Sensor Industry Revenue Share (%), by Material 2025 & 2033
- Figure 6: North America Piezoresistive Pressure Sensor Industry Volume Share (%), by Material 2025 & 2033
- Figure 7: North America Piezoresistive Pressure Sensor Industry Revenue (million), by End User 2025 & 2033
- Figure 8: North America Piezoresistive Pressure Sensor Industry Volume (K Unit), by End User 2025 & 2033
- Figure 9: North America Piezoresistive Pressure Sensor Industry Revenue Share (%), by End User 2025 & 2033
- Figure 10: North America Piezoresistive Pressure Sensor Industry Volume Share (%), by End User 2025 & 2033
- Figure 11: North America Piezoresistive Pressure Sensor Industry Revenue (million), by Country 2025 & 2033
- Figure 12: North America Piezoresistive Pressure Sensor Industry Volume (K Unit), by Country 2025 & 2033
- Figure 13: North America Piezoresistive Pressure Sensor Industry Revenue Share (%), by Country 2025 & 2033
- Figure 14: North America Piezoresistive Pressure Sensor Industry Volume Share (%), by Country 2025 & 2033
- Figure 15: Europe Piezoresistive Pressure Sensor Industry Revenue (million), by Material 2025 & 2033
- Figure 16: Europe Piezoresistive Pressure Sensor Industry Volume (K Unit), by Material 2025 & 2033
- Figure 17: Europe Piezoresistive Pressure Sensor Industry Revenue Share (%), by Material 2025 & 2033
- Figure 18: Europe Piezoresistive Pressure Sensor Industry Volume Share (%), by Material 2025 & 2033
- Figure 19: Europe Piezoresistive Pressure Sensor Industry Revenue (million), by End User 2025 & 2033
- Figure 20: Europe Piezoresistive Pressure Sensor Industry Volume (K Unit), by End User 2025 & 2033
- Figure 21: Europe Piezoresistive Pressure Sensor Industry Revenue Share (%), by End User 2025 & 2033
- Figure 22: Europe Piezoresistive Pressure Sensor Industry Volume Share (%), by End User 2025 & 2033
- Figure 23: Europe Piezoresistive Pressure Sensor Industry Revenue (million), by Country 2025 & 2033
- Figure 24: Europe Piezoresistive Pressure Sensor Industry Volume (K Unit), by Country 2025 & 2033
- Figure 25: Europe Piezoresistive Pressure Sensor Industry Revenue Share (%), by Country 2025 & 2033
- Figure 26: Europe Piezoresistive Pressure Sensor Industry Volume Share (%), by Country 2025 & 2033
- Figure 27: Asia Pacific Piezoresistive Pressure Sensor Industry Revenue (million), by Material 2025 & 2033
- Figure 28: Asia Pacific Piezoresistive Pressure Sensor Industry Volume (K Unit), by Material 2025 & 2033
- Figure 29: Asia Pacific Piezoresistive Pressure Sensor Industry Revenue Share (%), by Material 2025 & 2033
- Figure 30: Asia Pacific Piezoresistive Pressure Sensor Industry Volume Share (%), by Material 2025 & 2033
- Figure 31: Asia Pacific Piezoresistive Pressure Sensor Industry Revenue (million), by End User 2025 & 2033
- Figure 32: Asia Pacific Piezoresistive Pressure Sensor Industry Volume (K Unit), by End User 2025 & 2033
- Figure 33: Asia Pacific Piezoresistive Pressure Sensor Industry Revenue Share (%), by End User 2025 & 2033
- Figure 34: Asia Pacific Piezoresistive Pressure Sensor Industry Volume Share (%), by End User 2025 & 2033
- Figure 35: Asia Pacific Piezoresistive Pressure Sensor Industry Revenue (million), by Country 2025 & 2033
- Figure 36: Asia Pacific Piezoresistive Pressure Sensor Industry Volume (K Unit), by Country 2025 & 2033
- Figure 37: Asia Pacific Piezoresistive Pressure Sensor Industry Revenue Share (%), by Country 2025 & 2033
- Figure 38: Asia Pacific Piezoresistive Pressure Sensor Industry Volume Share (%), by Country 2025 & 2033
- Figure 39: Latin America Piezoresistive Pressure Sensor Industry Revenue (million), by Material 2025 & 2033
- Figure 40: Latin America Piezoresistive Pressure Sensor Industry Volume (K Unit), by Material 2025 & 2033
- Figure 41: Latin America Piezoresistive Pressure Sensor Industry Revenue Share (%), by Material 2025 & 2033
- Figure 42: Latin America Piezoresistive Pressure Sensor Industry Volume Share (%), by Material 2025 & 2033
- Figure 43: Latin America Piezoresistive Pressure Sensor Industry Revenue (million), by End User 2025 & 2033
- Figure 44: Latin America Piezoresistive Pressure Sensor Industry Volume (K Unit), by End User 2025 & 2033
- Figure 45: Latin America Piezoresistive Pressure Sensor Industry Revenue Share (%), by End User 2025 & 2033
- Figure 46: Latin America Piezoresistive Pressure Sensor Industry Volume Share (%), by End User 2025 & 2033
- Figure 47: Latin America Piezoresistive Pressure Sensor Industry Revenue (million), by Country 2025 & 2033
- Figure 48: Latin America Piezoresistive Pressure Sensor Industry Volume (K Unit), by Country 2025 & 2033
- Figure 49: Latin America Piezoresistive Pressure Sensor Industry Revenue Share (%), by Country 2025 & 2033
- Figure 50: Latin America Piezoresistive Pressure Sensor Industry Volume Share (%), by Country 2025 & 2033
- Figure 51: Middle East and Africa Piezoresistive Pressure Sensor Industry Revenue (million), by Material 2025 & 2033
- Figure 52: Middle East and Africa Piezoresistive Pressure Sensor Industry Volume (K Unit), by Material 2025 & 2033
- Figure 53: Middle East and Africa Piezoresistive Pressure Sensor Industry Revenue Share (%), by Material 2025 & 2033
- Figure 54: Middle East and Africa Piezoresistive Pressure Sensor Industry Volume Share (%), by Material 2025 & 2033
- Figure 55: Middle East and Africa Piezoresistive Pressure Sensor Industry Revenue (million), by End User 2025 & 2033
- Figure 56: Middle East and Africa Piezoresistive Pressure Sensor Industry Volume (K Unit), by End User 2025 & 2033
- Figure 57: Middle East and Africa Piezoresistive Pressure Sensor Industry Revenue Share (%), by End User 2025 & 2033
- Figure 58: Middle East and Africa Piezoresistive Pressure Sensor Industry Volume Share (%), by End User 2025 & 2033
- Figure 59: Middle East and Africa Piezoresistive Pressure Sensor Industry Revenue (million), by Country 2025 & 2033
- Figure 60: Middle East and Africa Piezoresistive Pressure Sensor Industry Volume (K Unit), by Country 2025 & 2033
- Figure 61: Middle East and Africa Piezoresistive Pressure Sensor Industry Revenue Share (%), by Country 2025 & 2033
- Figure 62: Middle East and Africa Piezoresistive Pressure Sensor Industry Volume Share (%), by Country 2025 & 2033
List of Tables
- Table 1: Global Piezoresistive Pressure Sensor Industry Revenue million Forecast, by Material 2020 & 2033
- Table 2: Global Piezoresistive Pressure Sensor Industry Volume K Unit Forecast, by Material 2020 & 2033
- Table 3: Global Piezoresistive Pressure Sensor Industry Revenue million Forecast, by End User 2020 & 2033
- Table 4: Global Piezoresistive Pressure Sensor Industry Volume K Unit Forecast, by End User 2020 & 2033
- Table 5: Global Piezoresistive Pressure Sensor Industry Revenue million Forecast, by Region 2020 & 2033
- Table 6: Global Piezoresistive Pressure Sensor Industry Volume K Unit Forecast, by Region 2020 & 2033
- Table 7: Global Piezoresistive Pressure Sensor Industry Revenue million Forecast, by Material 2020 & 2033
- Table 8: Global Piezoresistive Pressure Sensor Industry Volume K Unit Forecast, by Material 2020 & 2033
- Table 9: Global Piezoresistive Pressure Sensor Industry Revenue million Forecast, by End User 2020 & 2033
- Table 10: Global Piezoresistive Pressure Sensor Industry Volume K Unit Forecast, by End User 2020 & 2033
- Table 11: Global Piezoresistive Pressure Sensor Industry Revenue million Forecast, by Country 2020 & 2033
- Table 12: Global Piezoresistive Pressure Sensor Industry Volume K Unit Forecast, by Country 2020 & 2033
- Table 13: Global Piezoresistive Pressure Sensor Industry Revenue million Forecast, by Material 2020 & 2033
- Table 14: Global Piezoresistive Pressure Sensor Industry Volume K Unit Forecast, by Material 2020 & 2033
- Table 15: Global Piezoresistive Pressure Sensor Industry Revenue million Forecast, by End User 2020 & 2033
- Table 16: Global Piezoresistive Pressure Sensor Industry Volume K Unit Forecast, by End User 2020 & 2033
- Table 17: Global Piezoresistive Pressure Sensor Industry Revenue million Forecast, by Country 2020 & 2033
- Table 18: Global Piezoresistive Pressure Sensor Industry Volume K Unit Forecast, by Country 2020 & 2033
- Table 19: Global Piezoresistive Pressure Sensor Industry Revenue million Forecast, by Material 2020 & 2033
- Table 20: Global Piezoresistive Pressure Sensor Industry Volume K Unit Forecast, by Material 2020 & 2033
- Table 21: Global Piezoresistive Pressure Sensor Industry Revenue million Forecast, by End User 2020 & 2033
- Table 22: Global Piezoresistive Pressure Sensor Industry Volume K Unit Forecast, by End User 2020 & 2033
- Table 23: Global Piezoresistive Pressure Sensor Industry Revenue million Forecast, by Country 2020 & 2033
- Table 24: Global Piezoresistive Pressure Sensor Industry Volume K Unit Forecast, by Country 2020 & 2033
- Table 25: Global Piezoresistive Pressure Sensor Industry Revenue million Forecast, by Material 2020 & 2033
- Table 26: Global Piezoresistive Pressure Sensor Industry Volume K Unit Forecast, by Material 2020 & 2033
- Table 27: Global Piezoresistive Pressure Sensor Industry Revenue million Forecast, by End User 2020 & 2033
- Table 28: Global Piezoresistive Pressure Sensor Industry Volume K Unit Forecast, by End User 2020 & 2033
- Table 29: Global Piezoresistive Pressure Sensor Industry Revenue million Forecast, by Country 2020 & 2033
- Table 30: Global Piezoresistive Pressure Sensor Industry Volume K Unit Forecast, by Country 2020 & 2033
- Table 31: Global Piezoresistive Pressure Sensor Industry Revenue million Forecast, by Material 2020 & 2033
- Table 32: Global Piezoresistive Pressure Sensor Industry Volume K Unit Forecast, by Material 2020 & 2033
- Table 33: Global Piezoresistive Pressure Sensor Industry Revenue million Forecast, by End User 2020 & 2033
- Table 34: Global Piezoresistive Pressure Sensor Industry Volume K Unit Forecast, by End User 2020 & 2033
- Table 35: Global Piezoresistive Pressure Sensor Industry Revenue million Forecast, by Country 2020 & 2033
- Table 36: Global Piezoresistive Pressure Sensor Industry Volume K Unit Forecast, by Country 2020 & 2033
Frequently Asked Questions
1. What is the projected Compound Annual Growth Rate (CAGR) of the Piezoresistive Pressure Sensor Industry?
The projected CAGR is approximately 6.8%.
2. Which companies are prominent players in the Piezoresistive Pressure Sensor Industry?
Key companies in the market include Honeywell International Inc, First Sensor AG, Ninghai Sendo Sensor Co Ltd, Kistler Group, BCM Sensor Technologies BVBA, Metallux SA, Impress Sensors and Systems Ltd, BD Sensors GmBH, Pewatron AG, All Sensors Corporation, Rosemount Inc (Emerson Electric Company).
3. What are the main segments of the Piezoresistive Pressure Sensor Industry?
The market segments include Material, End User.
4. Can you provide details about the market size?
The market size is estimated to be USD 11720 million as of 2022.
5. What are some drivers contributing to market growth?
; Rising Emphasis on Miniaturization of Equipment; Need for Robust Design and Enhanced Performance in Rugged Environment.
6. What are the notable trends driving market growth?
Automotive Industry is Expected to Significantly Drive the Market Growth.
7. Are there any restraints impacting market growth?
; Technical Issues associated with the involvement of Smaller Components.
8. Can you provide examples of recent developments in the market?
N/A
9. What pricing options are available for accessing the report?
Pricing options include single-user, multi-user, and enterprise licenses priced at USD 4750, USD 5250, and USD 8750 respectively.
10. Is the market size provided in terms of value or volume?
The market size is provided in terms of value, measured in million and volume, measured in K Unit.
11. Are there any specific market keywords associated with the report?
Yes, the market keyword associated with the report is "Piezoresistive Pressure Sensor Industry," which aids in identifying and referencing the specific market segment covered.
12. How do I determine which pricing option suits my needs best?
The pricing options vary based on user requirements and access needs. Individual users may opt for single-user licenses, while businesses requiring broader access may choose multi-user or enterprise licenses for cost-effective access to the report.
13. Are there any additional resources or data provided in the Piezoresistive Pressure Sensor Industry report?
While the report offers comprehensive insights, it's advisable to review the specific contents or supplementary materials provided to ascertain if additional resources or data are available.
14. How can I stay updated on further developments or reports in the Piezoresistive Pressure Sensor Industry?
To stay informed about further developments, trends, and reports in the Piezoresistive Pressure Sensor Industry, consider subscribing to industry newsletters, following relevant companies and organizations, or regularly checking reputable industry news sources and publications.
Methodology
Step 1 - Identification of Relevant Samples Size from Population Database


Step 2 - Approaches for Defining Global Market Size (Value, Volume* & Price*)

Note*: In applicable scenarios
Step 3 - Data Sources
Primary Research
- Web Analytics
- Survey Reports
- Research Institute
- Latest Research Reports
- Opinion Leaders
Secondary Research
- Annual Reports
- White Paper
- Latest Press Release
- Industry Association
- Paid Database
- Investor Presentations

Step 4 - Data Triangulation
Involves using different sources of information in order to increase the validity of a study
These sources are likely to be stakeholders in a program - participants, other researchers, program staff, other community members, and so on.
Then we put all data in single framework & apply various statistical tools to find out the dynamic on the market.
During the analysis stage, feedback from the stakeholder groups would be compared to determine areas of agreement as well as areas of divergence