


Key Insights for Smartphone Display Market
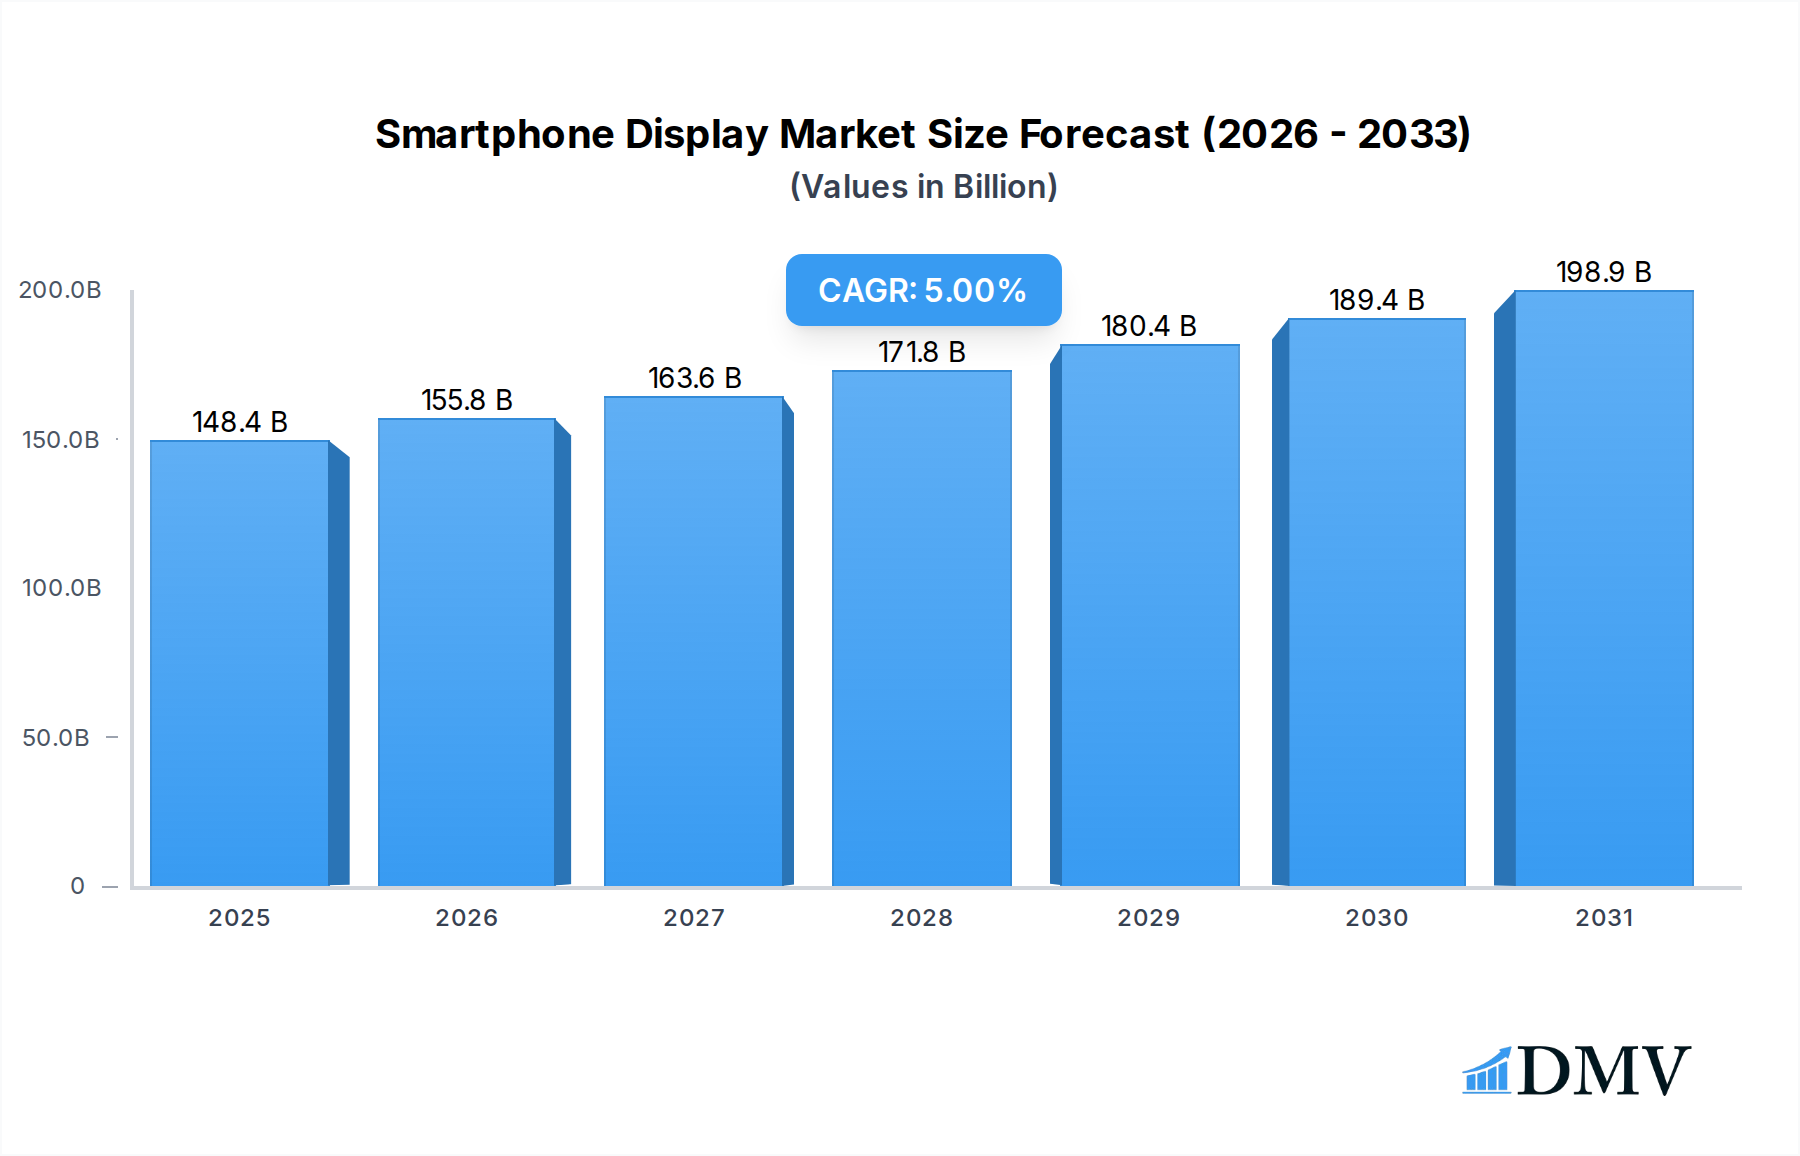
The global Smartphone Display Market was valued at $141.36 billion in 2024, demonstrating robust growth driven by continuous technological advancements and surging consumer demand for sophisticated mobile devices. This market is projected to expand at a compound annual growth rate (CAGR) of 5% from 2024 to 2034, reaching an estimated valuation of $230.07 billion by 2034. The primary catalyst for this expansion is the widespread adoption of premium smartphones, which increasingly integrate advanced display technologies such as Organic Light-Emitting Diode (OLED) and Active-Matrix Organic Light-Emitting Diode (AMOLED) panels. The superior visual fidelity, energy efficiency, and design flexibility offered by these technologies are key drivers in the Organic Light-Emitting Diode Market and the AMOLED Display Market, respectively, pushing average selling prices upwards.
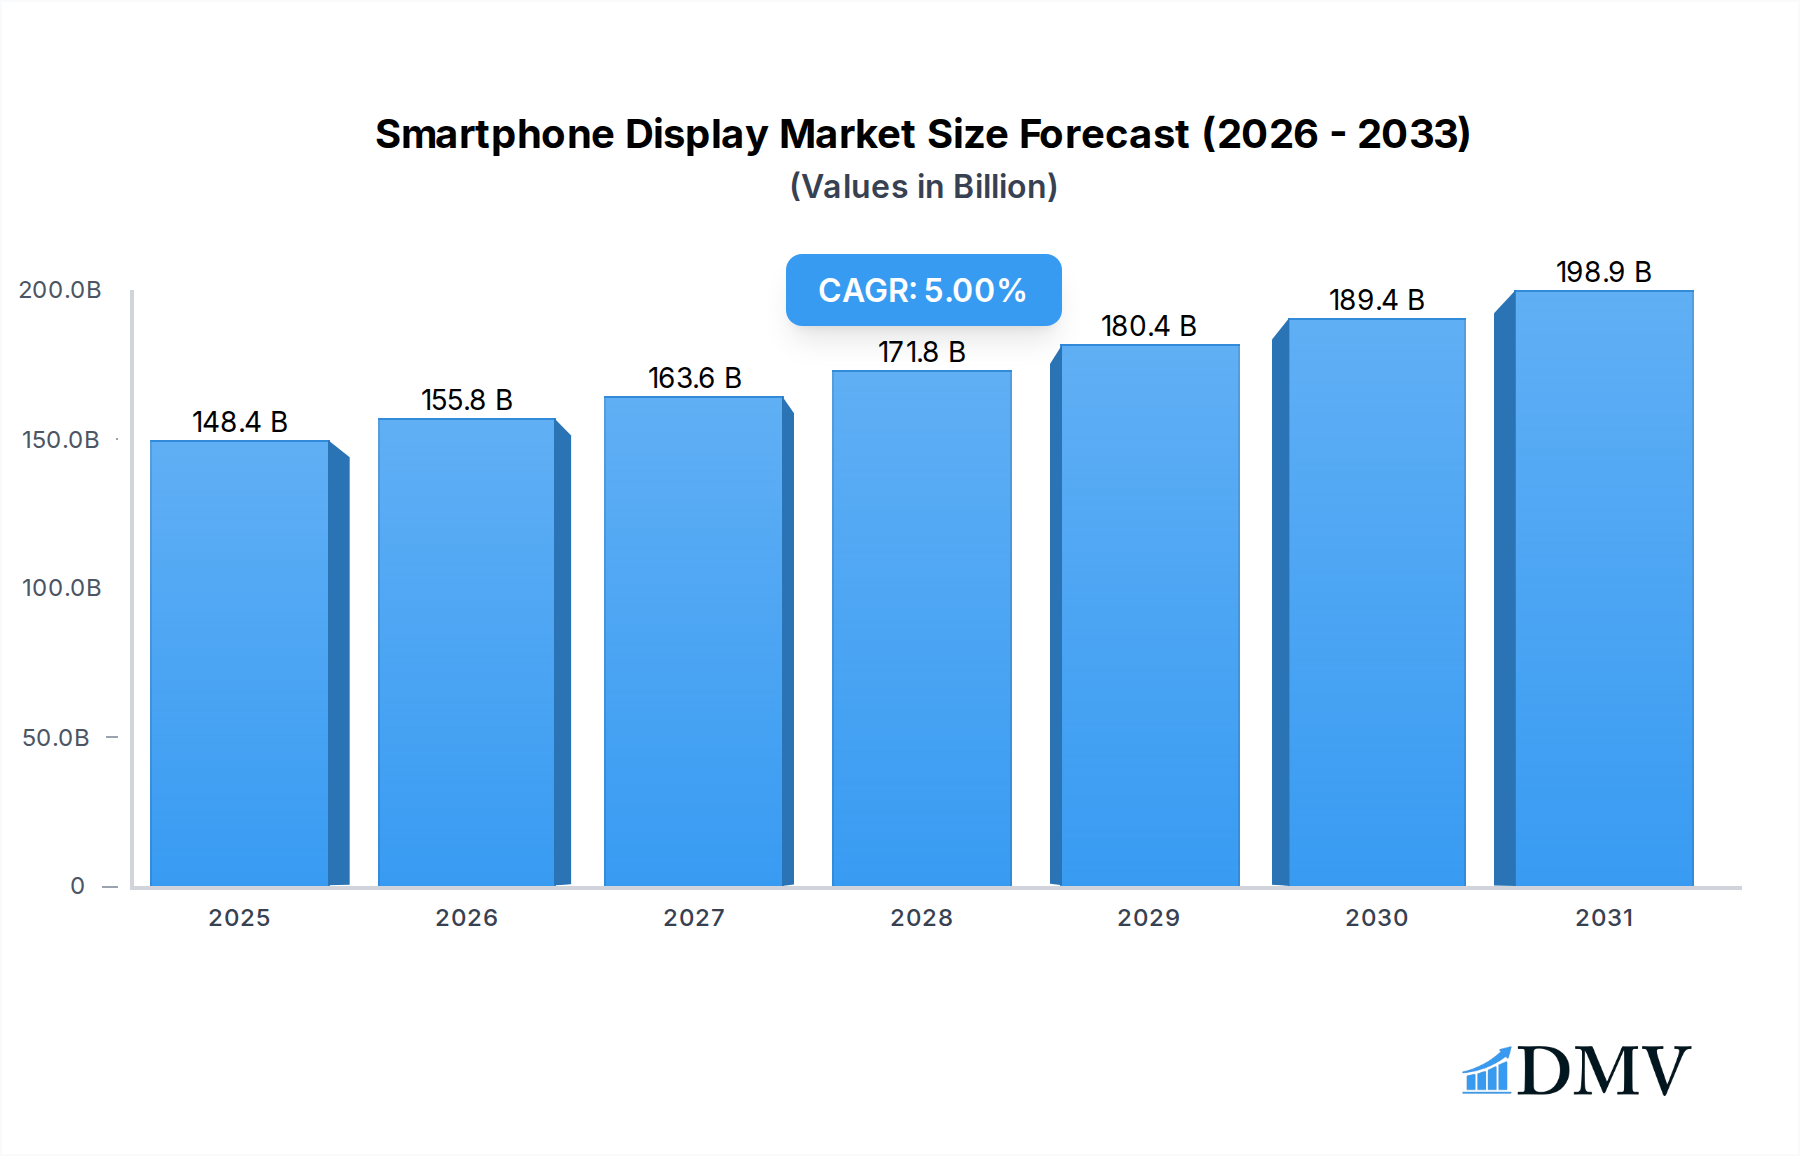
Smartphone Display Market Size (In Billion)

Macro tailwinds further support this growth trajectory, including the global expansion of 5G infrastructure, which necessitates higher resolution and refresh rate displays for an immersive multimedia experience. The burgeoning demand for foldable and rollable smartphones is also creating new opportunities, fostering innovation in flexible display manufacturing and influencing the Foldable Display Market. Moreover, the increasing penetration of smartphones in emerging economies, coupled with a rising disposable income, is broadening the consumer base for advanced devices. While the Liquid Crystal Display Market maintains a significant share, particularly in the mid-range and economy segments, the strategic shift by major OEMs towards OLED solutions for flagship models is undeniable. The overall Display Technology Market is characterized by relentless innovation, aiming for higher pixel densities, improved outdoor visibility, and enhanced durability. The interplay between these technological advancements and evolving consumer preferences positions the Smartphone Display Market for sustained expansion within the broader Consumer Electronics Market landscape, despite potential economic volatilities and supply chain considerations. This outlook underscores a dynamic environment where display technology remains a critical differentiator for smartphone manufacturers."
Smartphone Display Company Market Share
- "
Dominant Segment Analysis in Smartphone Display Market
Within the global Smartphone Display Market, the Organic Light-Emitting Diode (OLED) segment, encompassing its Active-Matrix variant (AMOLED), has emerged as the dominant force in terms of value share and technological leadership. This segment’s ascendancy is predicated on its intrinsic advantages over traditional Liquid Crystal Display (LCD) technologies, driving significant revenue generation. OLED panels offer superior contrast ratios, achieving true blacks by individually illuminating pixels, and boast wider viewing angles, faster response times, and exceptional color reproduction. Furthermore, the inherent flexibility of OLED materials has been instrumental in enabling innovative form factors, directly fueling the growth of the Foldable Display Market and paving the way for future rollable and slidable devices.
The dominance of OLED is not merely a technological preference but a strategic imperative for leading smartphone manufacturers. Companies like SAMSUNG and LG Electronics Inc. have invested heavily in OLED production, establishing vast fabrication capabilities that underpin the supply chain for premium smartphone models. SAMSUNG, in particular, holds a commanding position in the AMOLED Display Market, supplying panels to numerous other smartphone brands in addition to its own flagship devices. Other key players, such as BOE and Sharp Corporation, are rapidly increasing their OLED production capacities and technological prowess to compete effectively. While the Liquid Crystal Display Market still holds a substantial volume share, especially in the mid-range and economy smartphone segments due to its cost-effectiveness, its revenue contribution per unit is significantly lower compared to OLED.
The market share of the Organic Light-Emitting Diode Market continues to grow, consolidating its position at the premium and high-end tiers. This growth is driven by consumer willingness to pay a premium for enhanced display quality and innovative designs. Manufacturers are also leveraging OLED's power efficiency, particularly important with increasing refresh rates and always-on display features. The competitive landscape within this dominant segment is characterized by intense R&D efforts aimed at improving panel longevity, reducing manufacturing costs, and achieving higher brightness and efficiency levels. This ongoing innovation ensures that OLED remains at the forefront of the Display Technology Market within the smartphone industry, continuously pushing the boundaries of visual experience and device design."
- "
Key Market Drivers and Constraints in Smartphone Display Market
The Smartphone Display Market is influenced by a confluence of technological advancements and economic realities. A primary driver is the escalating demand for advanced display technologies, particularly in the Organic Light-Emitting Diode Market and the AMOLED Display Market. Consumers are increasingly prioritizing superior visual experiences, leading to a strong preference for displays offering higher resolutions (FHD, QHD), faster refresh rates (90Hz, 120Hz, and beyond), and enhanced color accuracy. This trend is quantified by a consistent increase in average selling prices (ASPs) for devices integrating these premium panels, bolstering market revenue. The enablement of novel form factors, such as those seen in the Foldable Display Market, is another significant driver. The inherent flexibility of OLED technology allows for bendable and foldable designs, unlocking new product categories and stimulating consumer upgrades, directly contributing to market expansion.
Furthermore, the pervasive rollout of 5G network infrastructure globally acts as a catalyst. Faster network speeds facilitate consumption of high-definition content, cloud gaming, and augmented reality applications, all of which benefit immensely from high-quality, responsive displays, thereby boosting demand for cutting-edge panels. The continuous innovation in power efficiency and durability of displays also contributes to market growth, addressing key consumer concerns. Within the broader Consumer Electronics Market, smartphones are critical, and display technology remains a key differentiator.
Conversely, several constraints impede the Smartphone Display Market's growth. High manufacturing costs for advanced OLED panels represent a significant barrier, especially for mid-tier smartphone manufacturers, limiting widespread adoption in more price-sensitive segments. This cost pressure leads to a competitive pricing environment, particularly pronounced in the traditional Liquid Crystal Display Market, where margins are continually squeezed. Supply chain volatility and raw material dependency also pose challenges. For instance, the sourcing of specialized materials like Indium Tin Oxide (ITO) and high-purity organic compounds, alongside Specialty Glass Market inputs, can be susceptible to geopolitical events, trade disputes, or natural disasters, leading to price fluctuations and supply shortages. Finally, market saturation in developed regions, while offset by growth in emerging economies, can slow overall market expansion rates for basic smartphone models, focusing competition on feature upgrades rather than new user acquisition."
- "
Competitive Ecosystem of Smartphone Display Market
The Smartphone Display Market is characterized by intense competition among a few dominant players and several rapidly emerging manufacturers, all vying for technological supremacy and market share. These companies are central to the Display Technology Market value chain, driving innovation across various display types, including the Organic Light-Emitting Diode Market and Liquid Crystal Display Market segments.
SAMSUNG: A global leader, particularly dominant in the AMOLED Display Market, known for its extensive R&D capabilities and massive production capacities for high-quality, flexible, and foldable OLED panels, supplying both its own devices and a wide array of other smartphone OEMs.
Japan Display Inc.?: A prominent player specializing in advanced LTPS LCD technology, with strategic investments in OLED production to transition and remain competitive in the evolving display landscape.
Toshiba Corporation?: While having a historical presence in display technology, its focus has largely shifted from direct smartphone panel manufacturing, often participating through joint ventures or licensing agreements.
LG Electronics Inc.: A key innovator, especially renowned for its OLED technology across various applications, including flexible and transparent displays, holding a strong position in both smartphone and larger format OLED panels.
Sharp Corporation: Known for its proprietary IGZO (Indium Gallium Zinc Oxide) LCD technology, which offers high resolution and low power consumption, and increasingly developing its OLED capabilities to cater to premium smartphone demands.
BOE: A rapidly expanding Chinese display manufacturer, aggressively increasing its production capacity for both LCD and flexible OLED panels, becoming a crucial supplier for a multitude of global smartphone brands.
Fujitsu Ltd.?: Though a major technology conglomerate, its direct involvement in smartphone display panel manufacturing is limited, typically focusing on integrated solutions or specific component development.
Sony Corporation: A prominent electronics manufacturer with a legacy in display technology, though its direct panel production for smartphones has diminished, it continues to innovate in display applications for its own devices.
Apple Inc.?: Primarily an OEM, Apple designs its own displays but relies on external suppliers like Samsung and LG for the manufacturing of its high-quality OLED panels, particularly for its iPhone lineup.
Motorola Inc: As an OEM, Motorola sources its smartphone displays from various panel manufacturers, integrating advanced display technologies into its diverse product portfolio, including devices within the Foldable Display Market.
Mitsubishi Electric Corporation?: Historically involved in display technology, its current focus is less on small-to-medium smartphone panels and more on specialized industrial or automotive display solutions.
Innolux Corporation?: A major Taiwanese display panel manufacturer, strong in LCD production, with growing investments and capabilities in advanced display technologies, including niche OLED applications.
AUO?: Another significant Taiwanese display manufacturer, actively involved in developing and producing a range of LCD and OLED panels for various applications, including smartphones and Wearable Technology Market devices.
Others?: This category includes numerous smaller players and specialized component manufacturers that contribute to the diverse and complex supply chain of the smartphone display industry."
"
Recent Developments & Milestones in Smartphone Display Market
Innovation and strategic maneuvers continually shape the competitive and technological landscape of the Smartphone Display Market, impacting segments from the AMOLED Display Market to the Foldable Display Market.
Q4 2023: Samsung Display announced the successful mass production of its latest generation QD-OLED panels, delivering enhanced brightness and improved color purity, primarily targeting the premium segment of the Organic Light-Emitting Diode Market for flagship smartphones.
H1 2024: BOE Technology Group significantly expanded its investment in new flexible OLED panel production lines in China, aiming to meet the surging demand for innovative form factors and consolidate its position in the rapidly growing Foldable Display Market.
Q3 2023: LG Display unveiled new LTPO (low-temperature polycrystalline oxide) OLED panels with dynamic refresh rates, allowing for greater power efficiency and extended battery life in high-end smartphones and devices within the Wearable Technology Market.
Q1 2024: Several smaller display manufacturers introduced cost-effective IPS LCD panels with higher refresh rates, intensifying competition within the Liquid Crystal Display Market and pushing down average prices in the mid-range smartphone segment.
Q2 2024: Advances in under-display camera (UDC) technology continued, with major smartphone OEMs showcasing devices featuring improved UDC solutions that seamlessly integrate with the main display, marking a significant step forward in the Display Technology Market.
H2 2023: Research efforts intensified in micro-LED and mini-LED display technologies for smartphones, promising even higher brightness, improved contrast, and greater energy efficiency, although mass production for small panels remains a future prospect."
"
Regional Market Breakdown for Smartphone Display Market
The global Smartphone Display Market exhibits significant regional disparities in terms of market share, growth dynamics, and technology adoption, influenced by manufacturing capabilities, consumer demographics, and economic development within the overall Consumer Electronics Market.
Asia Pacific is the undeniable powerhouse of the global Smartphone Display Market, commanding a dominant revenue share of well over 50%. This region is not only the largest consumer base for smartphones but also the primary hub for display panel manufacturing, with leading players from South Korea, China, and Japan driving production and innovation across the Organic Light-Emitting Diode Market and Liquid Crystal Display Market. The region is projected to register the highest CAGR of approximately 6.5% over the forecast period, fueled by strong demand from emerging economies like India and Southeast Asian nations, coupled with continuous technological advancements from established players. This makes Asia Pacific the fastest-growing and most pivotal market.
North America holds a substantial share of around 18% of the global market. It represents a mature market characterized by high disposable incomes and a strong preference for premium smartphones. The demand here is largely driven by early adoption of cutting-edge technologies, including advanced AMOLED Display Market panels, high refresh rates, and the latest devices within the Foldable Display Market. The region is expected to grow at a moderate CAGR of about 4%, with innovation and brand loyalty being key demand drivers rather than sheer volume expansion.
Europe follows closely with an estimated market share of approximately 15%. Similar to North America, Europe is a mature market where consumers seek high-end smartphones with superior display quality and features. Demand is robust for devices utilizing advanced Display Technology Market solutions, with a consistent upgrade cycle driving sales. The region is forecast to experience a CAGR of roughly 3.8%, slightly lower than North America, primarily due to economic saturation and stable smartphone penetration rates.
Middle East & Africa (MEA) and South America collectively represent emerging markets for smartphone displays. While their current individual market shares are smaller, they exhibit strong growth potential. MEA, in particular, is anticipated to achieve a notable CAGR of approximately 7%, positioning it as a rapidly expanding region. This growth is propelled by increasing smartphone penetration, improving network infrastructure, and a growing youth population that readily adopts new mobile technologies, driving demand for both economy and mid-range display solutions. The primary demand driver in these regions is the increasing affordability and accessibility of smartphones, leading to a surge in first-time users and feature upgrades."
- "
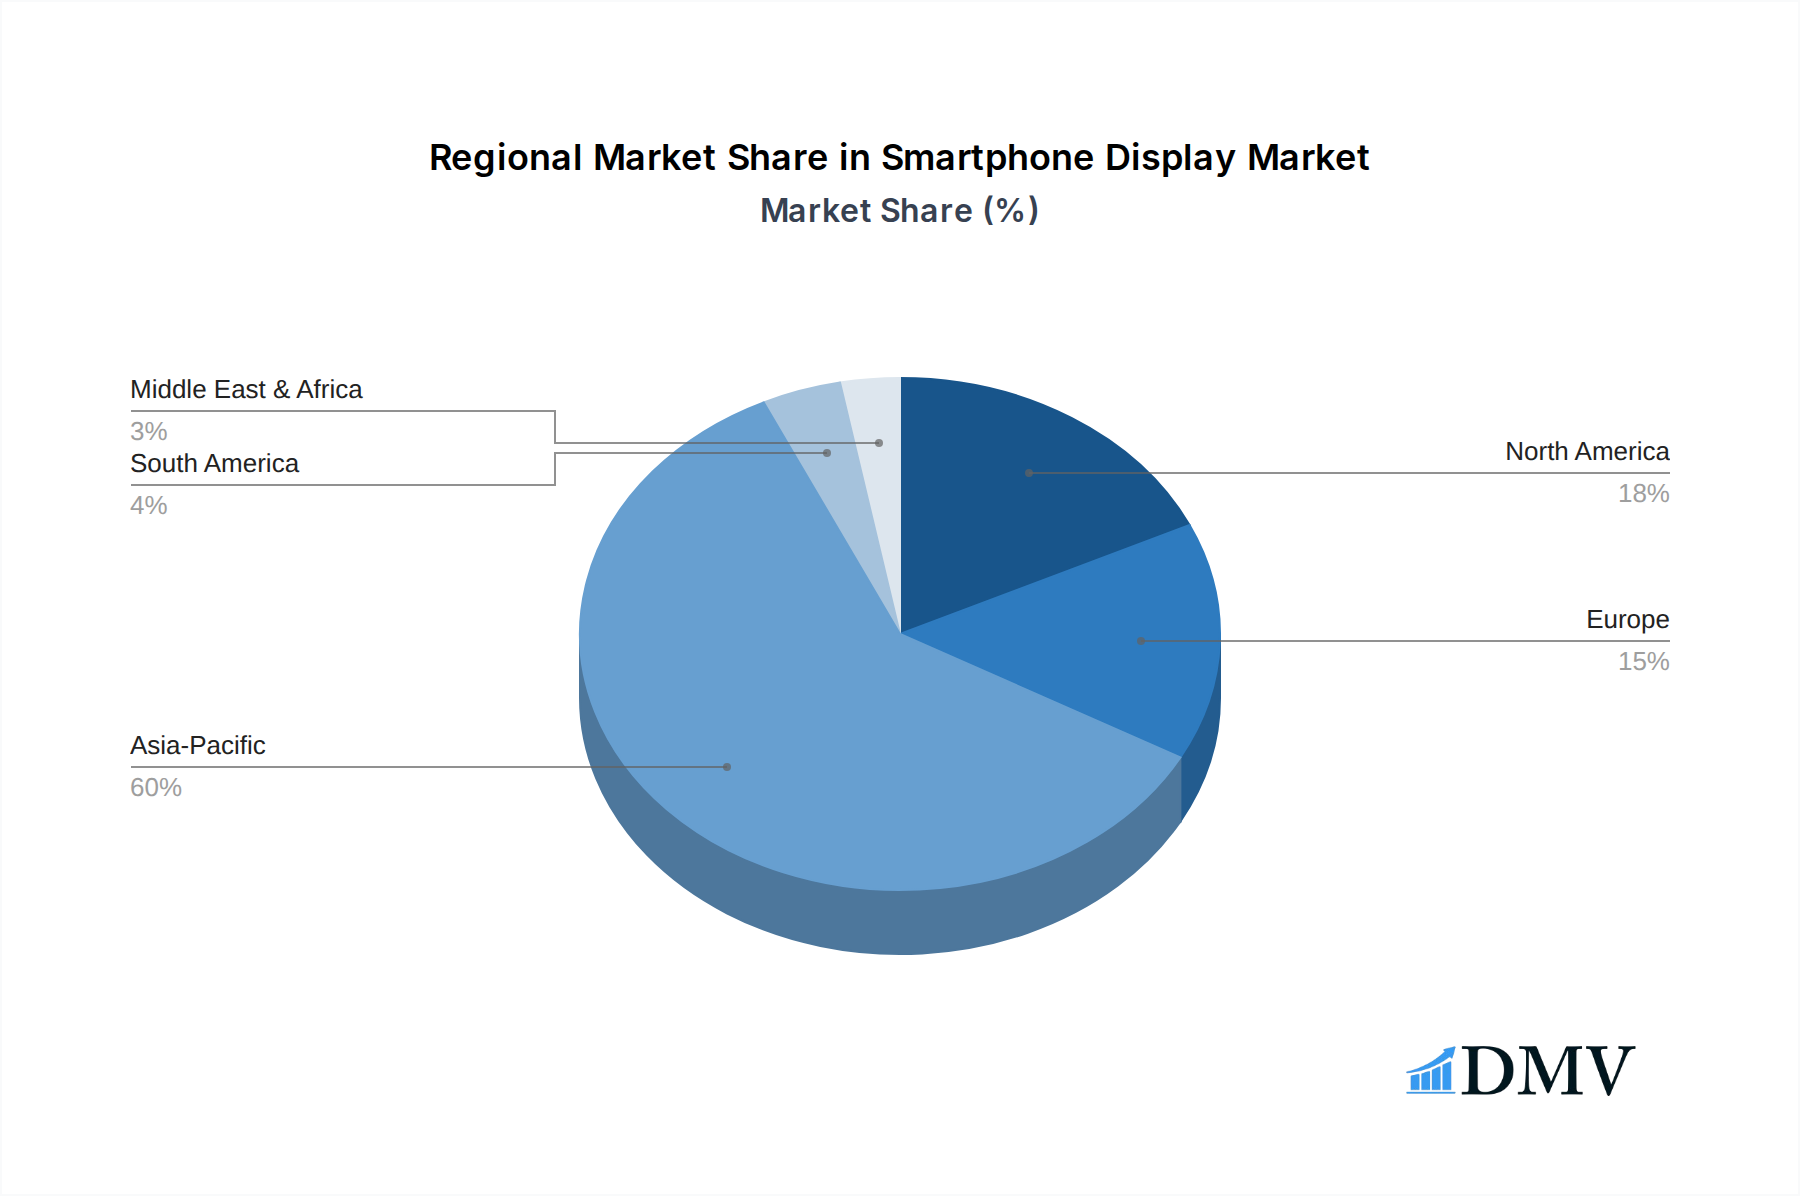
Smartphone Display Regional Market Share
Supply Chain & Raw Material Dynamics for Smartphone Display Market
The supply chain for the Smartphone Display Market is intricate and globally interconnected, heavily dependent on a specialized ecosystem of raw material providers and component manufacturers. Upstream dependencies are significant, with several key inputs influencing production costs and lead times, impacting both the Organic Light-Emitting Diode Market and the Liquid Crystal Display Market. Essential raw materials include various types of Specialty Glass Market substrates, such as ultra-thin glass for foldable displays and high-strength aluminosilicate glass for rigid panels. Price volatility in these glass substrates can directly affect display manufacturing costs, with recent trends showing moderate increases due to higher energy costs and logistics challenges. Indium Tin Oxide (ITO) is another critical input, used as a transparent conductive layer in nearly all display types; its sourcing can be prone to geopolitical risks as indium, a key component, is a relatively rare element with concentrated mining operations.
Other crucial components include polarizer films, color filters (for LCDs), liquid crystal materials (for LCDs), and a complex array of organic light-emitting materials, encapsulation materials, and driver ICs for OLED panels. Sourcing risks are amplified by the highly specialized nature of these materials and the limited number of suppliers for certain high-purity chemicals and compounds. For instance, the AMOLED Display Market relies on a specific set of organic layers whose patents and production are often controlled by a few dominant chemical companies. Historically, natural disasters, such as earthquakes in Japan or power outages in key manufacturing hubs, have disrupted the supply of critical components, leading to temporary price hikes and production delays across the Display Technology Market. Trade disputes and tariffs, particularly between major economic blocs, have also influenced raw material pricing and supply logistics, compelling manufacturers to diversify their sourcing strategies. For example, tariffs on specific electronic components have occasionally increased the cost of integrated circuits essential for display functionality, indirectly affecting the final product cost of smartphones in the Consumer Electronics Market."
- "
Export, Trade Flow & Tariff Impact on Smartphone Display Market
The Smartphone Display Market is characterized by significant cross-border trade flows, with a highly concentrated supply base and a globally dispersed demand. Major trade corridors primarily originate from East Asia, encompassing key exporting nations like South Korea, China, and Japan, which are global leaders in display panel manufacturing, particularly in the Organic Light-Emitting Diode Market and Liquid Crystal Display Market segments. These panels are then shipped to smartphone assembly hubs, predominantly in China, Vietnam, India, and increasingly Mexico, before the finished products are distributed globally. Leading importing nations for display panels thus include these assembly countries, while major consumer markets like the United States, Germany, and India are leading importers of finished smartphones incorporating these displays.
Tariff and non-tariff barriers have demonstrably impacted the dynamics of the Smartphone Display Market. For instance, the trade tensions between the United States and China have resulted in tariffs of 15-25% on certain display modules and related components, incrementally increasing the cost of goods for smartphone manufacturers sourcing from China and selling in the US. This has prompted some companies to shift production or diversify their supply chains to countries like Vietnam or India, indirectly influencing investment patterns in the Display Technology Market. Non-tariff barriers include stringent technical standards and environmental regulations, which can impose additional compliance costs for exporters. For example, specific certifications for material safety or energy efficiency might delay market entry or require product modifications, particularly for new technologies emerging from the Foldable Display Market.
Recent trade policies have also affected the Specialty Glass Market and other raw material flows, leading to increased landed costs for panel manufacturers. While exact quantification is complex, industry estimates suggest that cumulative tariff impacts have raised the cost of certain display components by 2-4% for specific trade lanes, ultimately translating into marginal price increases for consumers in affected regions of the Consumer Electronics Market. The global nature of the AMOLED Display Market supply chain, with materials sourced from various continents and assembled in others, makes it particularly vulnerable to geopolitical shifts and protectionist trade measures, driving ongoing efforts towards regionalizing supply chains where feasible.
Smartphone Display Segmentation
-
1. Type
-
1.1. Liquid Crystal Display (LCD)
- 1.1.1. TFT LCD
- 1.1.2. IPS LCD
- 1.2. Organic Light-Emitting Diode (OLED)
- 1.3. Active-Matrix Organic Light- Emitting Diode (AMOLED)
- 1.4. Others
-
1.1. Liquid Crystal Display (LCD)
-
2. Form Factor
- 2.1. Flat (Rigid)
- 2.2. Curved Edge
- 2.3. Foldable
- 2.4. Rollable/Slidable
-
3. Resolution
- 3.1. HD
- 3.2. FHD
- 3.3. QHD
- 3.4. Others
-
4. Size
- 4.1. Compact
- 4.2. Standard
- 4.3. Large
-
5. Price Range
- 5.1. Premium
- 5.2. Mid-Range
- 5.3. Economy
-
6. Sales Channel
- 6.1. OEM
- 6.2. Aftermarket
Smartphone Display Segmentation By Geography
-
1. North America
- 1.1. United States
- 1.2. Canada
- 1.3. Mexico
-
2. South America
- 2.1. Brazil
- 2.2. Argentina
- 2.3. Rest of South America
-
3. Europe
- 3.1. United Kingdom
- 3.2. Germany
- 3.3. France
- 3.4. Italy
- 3.5. Spain
- 3.6. Russia
- 3.7. Benelux
- 3.8. Nordics
- 3.9. Rest of Europe
-
4. Middle East & Africa
- 4.1. Turkey
- 4.2. Israel
- 4.3. GCC
- 4.4. North Africa
- 4.5. South Africa
- 4.6. Rest of Middle East & Africa
-
5. Asia Pacific
- 5.1. China
- 5.2. India
- 5.3. Japan
- 5.4. South Korea
- 5.5. ASEAN
- 5.6. Oceania
- 5.7. Rest of Asia Pacific
Smartphone Display Regional Market Share
Geographic Coverage of Smartphone Display
Smartphone Display REPORT HIGHLIGHTS
| Aspects | Details |
|---|---|
| Study Period | 2020-2034 |
| Base Year | 2025 |
| Estimated Year | 2026 |
| Forecast Period | 2026-2034 |
| Historical Period | 2020-2025 |
| Growth Rate | CAGR of 5% from 2020-2034 |
| Segmentation |
|
Table of Contents
- 1. Introduction
- 1.1. Research Scope
- 1.2. Market Segmentation
- 1.3. Research Objective
- 1.4. Definitions and Assumptions
- 2. Executive Summary
- 2.1. Market Snapshot
- 3. Market Dynamics
- 3.1. Market Drivers
- 3.2. Market Restrains
- 3.3. Market Trends
- 3.4. Market Opportunities
- 4. Market Factor Analysis
- 4.1. Porters Five Forces
- 4.1.1. Bargaining Power of Suppliers
- 4.1.2. Bargaining Power of Buyers
- 4.1.3. Threat of New Entrants
- 4.1.4. Threat of Substitutes
- 4.1.5. Competitive Rivalry
- 4.2. PESTEL analysis
- 4.3. BCG Analysis
- 4.3.1. Stars (High Growth, High Market Share)
- 4.3.2. Cash Cows (Low Growth, High Market Share)
- 4.3.3. Question Mark (High Growth, Low Market Share)
- 4.3.4. Dogs (Low Growth, Low Market Share)
- 4.4. Ansoff Matrix Analysis
- 4.5. Supply Chain Analysis
- 4.6. Regulatory Landscape
- 4.7. Current Market Potential and Opportunity Assessment (TAM–SAM–SOM Framework)
- 4.8. DMV Analyst Note
- 4.1. Porters Five Forces
- 5. Market Analysis, Insights and Forecast 2021-2033
- 5.1. Market Analysis, Insights and Forecast - by Type
- 5.1.1. Liquid Crystal Display (LCD)
- 5.1.1.1. TFT LCD
- 5.1.1.2. IPS LCD
- 5.1.2. Organic Light-Emitting Diode (OLED)
- 5.1.3. Active-Matrix Organic Light- Emitting Diode (AMOLED)
- 5.1.4. Others
- 5.1.1. Liquid Crystal Display (LCD)
- 5.2. Market Analysis, Insights and Forecast - by Form Factor
- 5.2.1. Flat (Rigid)
- 5.2.2. Curved Edge
- 5.2.3. Foldable
- 5.2.4. Rollable/Slidable
- 5.3. Market Analysis, Insights and Forecast - by Resolution
- 5.3.1. HD
- 5.3.2. FHD
- 5.3.3. QHD
- 5.3.4. Others
- 5.4. Market Analysis, Insights and Forecast - by Size
- 5.4.1. Compact
- 5.4.2. Standard
- 5.4.3. Large
- 5.5. Market Analysis, Insights and Forecast - by Price Range
- 5.5.1. Premium
- 5.5.2. Mid-Range
- 5.5.3. Economy
- 5.6. Market Analysis, Insights and Forecast - by Sales Channel
- 5.6.1. OEM
- 5.6.2. Aftermarket
- 5.7. Market Analysis, Insights and Forecast - by Region
- 5.7.1. North America
- 5.7.2. South America
- 5.7.3. Europe
- 5.7.4. Middle East & Africa
- 5.7.5. Asia Pacific
- 5.1. Market Analysis, Insights and Forecast - by Type
- 6. Global Smartphone Display Analysis, Insights and Forecast, 2021-2033
- 6.1. Market Analysis, Insights and Forecast - by Type
- 6.1.1. Liquid Crystal Display (LCD)
- 6.1.1.1. TFT LCD
- 6.1.1.2. IPS LCD
- 6.1.2. Organic Light-Emitting Diode (OLED)
- 6.1.3. Active-Matrix Organic Light- Emitting Diode (AMOLED)
- 6.1.4. Others
- 6.1.1. Liquid Crystal Display (LCD)
- 6.2. Market Analysis, Insights and Forecast - by Form Factor
- 6.2.1. Flat (Rigid)
- 6.2.2. Curved Edge
- 6.2.3. Foldable
- 6.2.4. Rollable/Slidable
- 6.3. Market Analysis, Insights and Forecast - by Resolution
- 6.3.1. HD
- 6.3.2. FHD
- 6.3.3. QHD
- 6.3.4. Others
- 6.4. Market Analysis, Insights and Forecast - by Size
- 6.4.1. Compact
- 6.4.2. Standard
- 6.4.3. Large
- 6.5. Market Analysis, Insights and Forecast - by Price Range
- 6.5.1. Premium
- 6.5.2. Mid-Range
- 6.5.3. Economy
- 6.6. Market Analysis, Insights and Forecast - by Sales Channel
- 6.6.1. OEM
- 6.6.2. Aftermarket
- 6.1. Market Analysis, Insights and Forecast - by Type
- 7. North America Smartphone Display Analysis, Insights and Forecast, 2020-2032
- 7.1. Market Analysis, Insights and Forecast - by Type
- 7.1.1. Liquid Crystal Display (LCD)
- 7.1.1.1. TFT LCD
- 7.1.1.2. IPS LCD
- 7.1.2. Organic Light-Emitting Diode (OLED)
- 7.1.3. Active-Matrix Organic Light- Emitting Diode (AMOLED)
- 7.1.4. Others
- 7.1.1. Liquid Crystal Display (LCD)
- 7.2. Market Analysis, Insights and Forecast - by Form Factor
- 7.2.1. Flat (Rigid)
- 7.2.2. Curved Edge
- 7.2.3. Foldable
- 7.2.4. Rollable/Slidable
- 7.3. Market Analysis, Insights and Forecast - by Resolution
- 7.3.1. HD
- 7.3.2. FHD
- 7.3.3. QHD
- 7.3.4. Others
- 7.4. Market Analysis, Insights and Forecast - by Size
- 7.4.1. Compact
- 7.4.2. Standard
- 7.4.3. Large
- 7.5. Market Analysis, Insights and Forecast - by Price Range
- 7.5.1. Premium
- 7.5.2. Mid-Range
- 7.5.3. Economy
- 7.6. Market Analysis, Insights and Forecast - by Sales Channel
- 7.6.1. OEM
- 7.6.2. Aftermarket
- 7.1. Market Analysis, Insights and Forecast - by Type
- 8. South America Smartphone Display Analysis, Insights and Forecast, 2020-2032
- 8.1. Market Analysis, Insights and Forecast - by Type
- 8.1.1. Liquid Crystal Display (LCD)
- 8.1.1.1. TFT LCD
- 8.1.1.2. IPS LCD
- 8.1.2. Organic Light-Emitting Diode (OLED)
- 8.1.3. Active-Matrix Organic Light- Emitting Diode (AMOLED)
- 8.1.4. Others
- 8.1.1. Liquid Crystal Display (LCD)
- 8.2. Market Analysis, Insights and Forecast - by Form Factor
- 8.2.1. Flat (Rigid)
- 8.2.2. Curved Edge
- 8.2.3. Foldable
- 8.2.4. Rollable/Slidable
- 8.3. Market Analysis, Insights and Forecast - by Resolution
- 8.3.1. HD
- 8.3.2. FHD
- 8.3.3. QHD
- 8.3.4. Others
- 8.4. Market Analysis, Insights and Forecast - by Size
- 8.4.1. Compact
- 8.4.2. Standard
- 8.4.3. Large
- 8.5. Market Analysis, Insights and Forecast - by Price Range
- 8.5.1. Premium
- 8.5.2. Mid-Range
- 8.5.3. Economy
- 8.6. Market Analysis, Insights and Forecast - by Sales Channel
- 8.6.1. OEM
- 8.6.2. Aftermarket
- 8.1. Market Analysis, Insights and Forecast - by Type
- 9. Europe Smartphone Display Analysis, Insights and Forecast, 2020-2032
- 9.1. Market Analysis, Insights and Forecast - by Type
- 9.1.1. Liquid Crystal Display (LCD)
- 9.1.1.1. TFT LCD
- 9.1.1.2. IPS LCD
- 9.1.2. Organic Light-Emitting Diode (OLED)
- 9.1.3. Active-Matrix Organic Light- Emitting Diode (AMOLED)
- 9.1.4. Others
- 9.1.1. Liquid Crystal Display (LCD)
- 9.2. Market Analysis, Insights and Forecast - by Form Factor
- 9.2.1. Flat (Rigid)
- 9.2.2. Curved Edge
- 9.2.3. Foldable
- 9.2.4. Rollable/Slidable
- 9.3. Market Analysis, Insights and Forecast - by Resolution
- 9.3.1. HD
- 9.3.2. FHD
- 9.3.3. QHD
- 9.3.4. Others
- 9.4. Market Analysis, Insights and Forecast - by Size
- 9.4.1. Compact
- 9.4.2. Standard
- 9.4.3. Large
- 9.5. Market Analysis, Insights and Forecast - by Price Range
- 9.5.1. Premium
- 9.5.2. Mid-Range
- 9.5.3. Economy
- 9.6. Market Analysis, Insights and Forecast - by Sales Channel
- 9.6.1. OEM
- 9.6.2. Aftermarket
- 9.1. Market Analysis, Insights and Forecast - by Type
- 10. Middle East & Africa Smartphone Display Analysis, Insights and Forecast, 2020-2032
- 10.1. Market Analysis, Insights and Forecast - by Type
- 10.1.1. Liquid Crystal Display (LCD)
- 10.1.1.1. TFT LCD
- 10.1.1.2. IPS LCD
- 10.1.2. Organic Light-Emitting Diode (OLED)
- 10.1.3. Active-Matrix Organic Light- Emitting Diode (AMOLED)
- 10.1.4. Others
- 10.1.1. Liquid Crystal Display (LCD)
- 10.2. Market Analysis, Insights and Forecast - by Form Factor
- 10.2.1. Flat (Rigid)
- 10.2.2. Curved Edge
- 10.2.3. Foldable
- 10.2.4. Rollable/Slidable
- 10.3. Market Analysis, Insights and Forecast - by Resolution
- 10.3.1. HD
- 10.3.2. FHD
- 10.3.3. QHD
- 10.3.4. Others
- 10.4. Market Analysis, Insights and Forecast - by Size
- 10.4.1. Compact
- 10.4.2. Standard
- 10.4.3. Large
- 10.5. Market Analysis, Insights and Forecast - by Price Range
- 10.5.1. Premium
- 10.5.2. Mid-Range
- 10.5.3. Economy
- 10.6. Market Analysis, Insights and Forecast - by Sales Channel
- 10.6.1. OEM
- 10.6.2. Aftermarket
- 10.1. Market Analysis, Insights and Forecast - by Type
- 11. Asia Pacific Smartphone Display Analysis, Insights and Forecast, 2020-2032
- 11.1. Market Analysis, Insights and Forecast - by Type
- 11.1.1. Liquid Crystal Display (LCD)
- 11.1.1.1. TFT LCD
- 11.1.1.2. IPS LCD
- 11.1.2. Organic Light-Emitting Diode (OLED)
- 11.1.3. Active-Matrix Organic Light- Emitting Diode (AMOLED)
- 11.1.4. Others
- 11.1.1. Liquid Crystal Display (LCD)
- 11.2. Market Analysis, Insights and Forecast - by Form Factor
- 11.2.1. Flat (Rigid)
- 11.2.2. Curved Edge
- 11.2.3. Foldable
- 11.2.4. Rollable/Slidable
- 11.3. Market Analysis, Insights and Forecast - by Resolution
- 11.3.1. HD
- 11.3.2. FHD
- 11.3.3. QHD
- 11.3.4. Others
- 11.4. Market Analysis, Insights and Forecast - by Size
- 11.4.1. Compact
- 11.4.2. Standard
- 11.4.3. Large
- 11.5. Market Analysis, Insights and Forecast - by Price Range
- 11.5.1. Premium
- 11.5.2. Mid-Range
- 11.5.3. Economy
- 11.6. Market Analysis, Insights and Forecast - by Sales Channel
- 11.6.1. OEM
- 11.6.2. Aftermarket
- 11.1. Market Analysis, Insights and Forecast - by Type
- 12. Competitive Analysis
- 12.1. Company Profiles
- 12.1.1 SAMSUNG
- 12.1.1.1. Company Overview
- 12.1.1.2. Products
- 12.1.1.3. Company Financials
- 12.1.1.4. SWOT Analysis
- 12.1.2 Japan Display Inc.
- 12.1.2.1. Company Overview
- 12.1.2.2. Products
- 12.1.2.3. Company Financials
- 12.1.2.4. SWOT Analysis
- 12.1.3 Toshiba Corporation
- 12.1.3.1. Company Overview
- 12.1.3.2. Products
- 12.1.3.3. Company Financials
- 12.1.3.4. SWOT Analysis
- 12.1.4 LG Electronics Inc.
- 12.1.4.1. Company Overview
- 12.1.4.2. Products
- 12.1.4.3. Company Financials
- 12.1.4.4. SWOT Analysis
- 12.1.5 Sharp Corporation
- 12.1.5.1. Company Overview
- 12.1.5.2. Products
- 12.1.5.3. Company Financials
- 12.1.5.4. SWOT Analysis
- 12.1.6 BOE
- 12.1.6.1. Company Overview
- 12.1.6.2. Products
- 12.1.6.3. Company Financials
- 12.1.6.4. SWOT Analysis
- 12.1.7 Fujitsu Ltd.
- 12.1.7.1. Company Overview
- 12.1.7.2. Products
- 12.1.7.3. Company Financials
- 12.1.7.4. SWOT Analysis
- 12.1.8 Sony Corporation
- 12.1.8.1. Company Overview
- 12.1.8.2. Products
- 12.1.8.3. Company Financials
- 12.1.8.4. SWOT Analysis
- 12.1.9 Apple Inc.
- 12.1.9.1. Company Overview
- 12.1.9.2. Products
- 12.1.9.3. Company Financials
- 12.1.9.4. SWOT Analysis
- 12.1.10 Motorola Inc
- 12.1.10.1. Company Overview
- 12.1.10.2. Products
- 12.1.10.3. Company Financials
- 12.1.10.4. SWOT Analysis
- 12.1.11 Mitsubishi Electric Corporation
- 12.1.11.1. Company Overview
- 12.1.11.2. Products
- 12.1.11.3. Company Financials
- 12.1.11.4. SWOT Analysis
- 12.1.12 Innolux Corporation
- 12.1.12.1. Company Overview
- 12.1.12.2. Products
- 12.1.12.3. Company Financials
- 12.1.12.4. SWOT Analysis
- 12.1.13 AUO
- 12.1.13.1. Company Overview
- 12.1.13.2. Products
- 12.1.13.3. Company Financials
- 12.1.13.4. SWOT Analysis
- 12.1.14 Others
- 12.1.14.1. Company Overview
- 12.1.14.2. Products
- 12.1.14.3. Company Financials
- 12.1.14.4. SWOT Analysis
- 12.1.1 SAMSUNG
- 12.2. Market Entropy
- 12.2.1 Company's Key Areas Served
- 12.2.2 Recent Developments
- 12.3. Company Market Share Analysis 2025
- 12.3.1 Top 5 Companies Market Share Analysis
- 12.3.2 Top 3 Companies Market Share Analysis
- 12.4. List of Potential Customers
- 13. Research Methodology
List of Figures
- Figure 1: Global Smartphone Display Revenue Breakdown (billion, %) by Region 2025 & 2033
- Figure 2: North America Smartphone Display Revenue (billion), by Type 2025 & 2033
- Figure 3: North America Smartphone Display Revenue Share (%), by Type 2025 & 2033
- Figure 4: North America Smartphone Display Revenue (billion), by Form Factor 2025 & 2033
- Figure 5: North America Smartphone Display Revenue Share (%), by Form Factor 2025 & 2033
- Figure 6: North America Smartphone Display Revenue (billion), by Resolution 2025 & 2033
- Figure 7: North America Smartphone Display Revenue Share (%), by Resolution 2025 & 2033
- Figure 8: North America Smartphone Display Revenue (billion), by Size 2025 & 2033
- Figure 9: North America Smartphone Display Revenue Share (%), by Size 2025 & 2033
- Figure 10: North America Smartphone Display Revenue (billion), by Price Range 2025 & 2033
- Figure 11: North America Smartphone Display Revenue Share (%), by Price Range 2025 & 2033
- Figure 12: North America Smartphone Display Revenue (billion), by Sales Channel 2025 & 2033
- Figure 13: North America Smartphone Display Revenue Share (%), by Sales Channel 2025 & 2033
- Figure 14: North America Smartphone Display Revenue (billion), by Country 2025 & 2033
- Figure 15: North America Smartphone Display Revenue Share (%), by Country 2025 & 2033
- Figure 16: South America Smartphone Display Revenue (billion), by Type 2025 & 2033
- Figure 17: South America Smartphone Display Revenue Share (%), by Type 2025 & 2033
- Figure 18: South America Smartphone Display Revenue (billion), by Form Factor 2025 & 2033
- Figure 19: South America Smartphone Display Revenue Share (%), by Form Factor 2025 & 2033
- Figure 20: South America Smartphone Display Revenue (billion), by Resolution 2025 & 2033
- Figure 21: South America Smartphone Display Revenue Share (%), by Resolution 2025 & 2033
- Figure 22: South America Smartphone Display Revenue (billion), by Size 2025 & 2033
- Figure 23: South America Smartphone Display Revenue Share (%), by Size 2025 & 2033
- Figure 24: South America Smartphone Display Revenue (billion), by Price Range 2025 & 2033
- Figure 25: South America Smartphone Display Revenue Share (%), by Price Range 2025 & 2033
- Figure 26: South America Smartphone Display Revenue (billion), by Sales Channel 2025 & 2033
- Figure 27: South America Smartphone Display Revenue Share (%), by Sales Channel 2025 & 2033
- Figure 28: South America Smartphone Display Revenue (billion), by Country 2025 & 2033
- Figure 29: South America Smartphone Display Revenue Share (%), by Country 2025 & 2033
- Figure 30: Europe Smartphone Display Revenue (billion), by Type 2025 & 2033
- Figure 31: Europe Smartphone Display Revenue Share (%), by Type 2025 & 2033
- Figure 32: Europe Smartphone Display Revenue (billion), by Form Factor 2025 & 2033
- Figure 33: Europe Smartphone Display Revenue Share (%), by Form Factor 2025 & 2033
- Figure 34: Europe Smartphone Display Revenue (billion), by Resolution 2025 & 2033
- Figure 35: Europe Smartphone Display Revenue Share (%), by Resolution 2025 & 2033
- Figure 36: Europe Smartphone Display Revenue (billion), by Size 2025 & 2033
- Figure 37: Europe Smartphone Display Revenue Share (%), by Size 2025 & 2033
- Figure 38: Europe Smartphone Display Revenue (billion), by Price Range 2025 & 2033
- Figure 39: Europe Smartphone Display Revenue Share (%), by Price Range 2025 & 2033
- Figure 40: Europe Smartphone Display Revenue (billion), by Sales Channel 2025 & 2033
- Figure 41: Europe Smartphone Display Revenue Share (%), by Sales Channel 2025 & 2033
- Figure 42: Europe Smartphone Display Revenue (billion), by Country 2025 & 2033
- Figure 43: Europe Smartphone Display Revenue Share (%), by Country 2025 & 2033
- Figure 44: Middle East & Africa Smartphone Display Revenue (billion), by Type 2025 & 2033
- Figure 45: Middle East & Africa Smartphone Display Revenue Share (%), by Type 2025 & 2033
- Figure 46: Middle East & Africa Smartphone Display Revenue (billion), by Form Factor 2025 & 2033
- Figure 47: Middle East & Africa Smartphone Display Revenue Share (%), by Form Factor 2025 & 2033
- Figure 48: Middle East & Africa Smartphone Display Revenue (billion), by Resolution 2025 & 2033
- Figure 49: Middle East & Africa Smartphone Display Revenue Share (%), by Resolution 2025 & 2033
- Figure 50: Middle East & Africa Smartphone Display Revenue (billion), by Size 2025 & 2033
- Figure 51: Middle East & Africa Smartphone Display Revenue Share (%), by Size 2025 & 2033
- Figure 52: Middle East & Africa Smartphone Display Revenue (billion), by Price Range 2025 & 2033
- Figure 53: Middle East & Africa Smartphone Display Revenue Share (%), by Price Range 2025 & 2033
- Figure 54: Middle East & Africa Smartphone Display Revenue (billion), by Sales Channel 2025 & 2033
- Figure 55: Middle East & Africa Smartphone Display Revenue Share (%), by Sales Channel 2025 & 2033
- Figure 56: Middle East & Africa Smartphone Display Revenue (billion), by Country 2025 & 2033
- Figure 57: Middle East & Africa Smartphone Display Revenue Share (%), by Country 2025 & 2033
- Figure 58: Asia Pacific Smartphone Display Revenue (billion), by Type 2025 & 2033
- Figure 59: Asia Pacific Smartphone Display Revenue Share (%), by Type 2025 & 2033
- Figure 60: Asia Pacific Smartphone Display Revenue (billion), by Form Factor 2025 & 2033
- Figure 61: Asia Pacific Smartphone Display Revenue Share (%), by Form Factor 2025 & 2033
- Figure 62: Asia Pacific Smartphone Display Revenue (billion), by Resolution 2025 & 2033
- Figure 63: Asia Pacific Smartphone Display Revenue Share (%), by Resolution 2025 & 2033
- Figure 64: Asia Pacific Smartphone Display Revenue (billion), by Size 2025 & 2033
- Figure 65: Asia Pacific Smartphone Display Revenue Share (%), by Size 2025 & 2033
- Figure 66: Asia Pacific Smartphone Display Revenue (billion), by Price Range 2025 & 2033
- Figure 67: Asia Pacific Smartphone Display Revenue Share (%), by Price Range 2025 & 2033
- Figure 68: Asia Pacific Smartphone Display Revenue (billion), by Sales Channel 2025 & 2033
- Figure 69: Asia Pacific Smartphone Display Revenue Share (%), by Sales Channel 2025 & 2033
- Figure 70: Asia Pacific Smartphone Display Revenue (billion), by Country 2025 & 2033
- Figure 71: Asia Pacific Smartphone Display Revenue Share (%), by Country 2025 & 2033
List of Tables
- Table 1: Global Smartphone Display Revenue billion Forecast, by Type 2020 & 2033
- Table 2: Global Smartphone Display Revenue billion Forecast, by Form Factor 2020 & 2033
- Table 3: Global Smartphone Display Revenue billion Forecast, by Resolution 2020 & 2033
- Table 4: Global Smartphone Display Revenue billion Forecast, by Size 2020 & 2033
- Table 5: Global Smartphone Display Revenue billion Forecast, by Price Range 2020 & 2033
- Table 6: Global Smartphone Display Revenue billion Forecast, by Sales Channel 2020 & 2033
- Table 7: Global Smartphone Display Revenue billion Forecast, by Region 2020 & 2033
- Table 8: Global Smartphone Display Revenue billion Forecast, by Type 2020 & 2033
- Table 9: Global Smartphone Display Revenue billion Forecast, by Form Factor 2020 & 2033
- Table 10: Global Smartphone Display Revenue billion Forecast, by Resolution 2020 & 2033
- Table 11: Global Smartphone Display Revenue billion Forecast, by Size 2020 & 2033
- Table 12: Global Smartphone Display Revenue billion Forecast, by Price Range 2020 & 2033
- Table 13: Global Smartphone Display Revenue billion Forecast, by Sales Channel 2020 & 2033
- Table 14: Global Smartphone Display Revenue billion Forecast, by Country 2020 & 2033
- Table 15: United States Smartphone Display Revenue (billion) Forecast, by Application 2020 & 2033
- Table 16: Canada Smartphone Display Revenue (billion) Forecast, by Application 2020 & 2033
- Table 17: Mexico Smartphone Display Revenue (billion) Forecast, by Application 2020 & 2033
- Table 18: Global Smartphone Display Revenue billion Forecast, by Type 2020 & 2033
- Table 19: Global Smartphone Display Revenue billion Forecast, by Form Factor 2020 & 2033
- Table 20: Global Smartphone Display Revenue billion Forecast, by Resolution 2020 & 2033
- Table 21: Global Smartphone Display Revenue billion Forecast, by Size 2020 & 2033
- Table 22: Global Smartphone Display Revenue billion Forecast, by Price Range 2020 & 2033
- Table 23: Global Smartphone Display Revenue billion Forecast, by Sales Channel 2020 & 2033
- Table 24: Global Smartphone Display Revenue billion Forecast, by Country 2020 & 2033
- Table 25: Brazil Smartphone Display Revenue (billion) Forecast, by Application 2020 & 2033
- Table 26: Argentina Smartphone Display Revenue (billion) Forecast, by Application 2020 & 2033
- Table 27: Rest of South America Smartphone Display Revenue (billion) Forecast, by Application 2020 & 2033
- Table 28: Global Smartphone Display Revenue billion Forecast, by Type 2020 & 2033
- Table 29: Global Smartphone Display Revenue billion Forecast, by Form Factor 2020 & 2033
- Table 30: Global Smartphone Display Revenue billion Forecast, by Resolution 2020 & 2033
- Table 31: Global Smartphone Display Revenue billion Forecast, by Size 2020 & 2033
- Table 32: Global Smartphone Display Revenue billion Forecast, by Price Range 2020 & 2033
- Table 33: Global Smartphone Display Revenue billion Forecast, by Sales Channel 2020 & 2033
- Table 34: Global Smartphone Display Revenue billion Forecast, by Country 2020 & 2033
- Table 35: United Kingdom Smartphone Display Revenue (billion) Forecast, by Application 2020 & 2033
- Table 36: Germany Smartphone Display Revenue (billion) Forecast, by Application 2020 & 2033
- Table 37: France Smartphone Display Revenue (billion) Forecast, by Application 2020 & 2033
- Table 38: Italy Smartphone Display Revenue (billion) Forecast, by Application 2020 & 2033
- Table 39: Spain Smartphone Display Revenue (billion) Forecast, by Application 2020 & 2033
- Table 40: Russia Smartphone Display Revenue (billion) Forecast, by Application 2020 & 2033
- Table 41: Benelux Smartphone Display Revenue (billion) Forecast, by Application 2020 & 2033
- Table 42: Nordics Smartphone Display Revenue (billion) Forecast, by Application 2020 & 2033
- Table 43: Rest of Europe Smartphone Display Revenue (billion) Forecast, by Application 2020 & 2033
- Table 44: Global Smartphone Display Revenue billion Forecast, by Type 2020 & 2033
- Table 45: Global Smartphone Display Revenue billion Forecast, by Form Factor 2020 & 2033
- Table 46: Global Smartphone Display Revenue billion Forecast, by Resolution 2020 & 2033
- Table 47: Global Smartphone Display Revenue billion Forecast, by Size 2020 & 2033
- Table 48: Global Smartphone Display Revenue billion Forecast, by Price Range 2020 & 2033
- Table 49: Global Smartphone Display Revenue billion Forecast, by Sales Channel 2020 & 2033
- Table 50: Global Smartphone Display Revenue billion Forecast, by Country 2020 & 2033
- Table 51: Turkey Smartphone Display Revenue (billion) Forecast, by Application 2020 & 2033
- Table 52: Israel Smartphone Display Revenue (billion) Forecast, by Application 2020 & 2033
- Table 53: GCC Smartphone Display Revenue (billion) Forecast, by Application 2020 & 2033
- Table 54: North Africa Smartphone Display Revenue (billion) Forecast, by Application 2020 & 2033
- Table 55: South Africa Smartphone Display Revenue (billion) Forecast, by Application 2020 & 2033
- Table 56: Rest of Middle East & Africa Smartphone Display Revenue (billion) Forecast, by Application 2020 & 2033
- Table 57: Global Smartphone Display Revenue billion Forecast, by Type 2020 & 2033
- Table 58: Global Smartphone Display Revenue billion Forecast, by Form Factor 2020 & 2033
- Table 59: Global Smartphone Display Revenue billion Forecast, by Resolution 2020 & 2033
- Table 60: Global Smartphone Display Revenue billion Forecast, by Size 2020 & 2033
- Table 61: Global Smartphone Display Revenue billion Forecast, by Price Range 2020 & 2033
- Table 62: Global Smartphone Display Revenue billion Forecast, by Sales Channel 2020 & 2033
- Table 63: Global Smartphone Display Revenue billion Forecast, by Country 2020 & 2033
- Table 64: China Smartphone Display Revenue (billion) Forecast, by Application 2020 & 2033
- Table 65: India Smartphone Display Revenue (billion) Forecast, by Application 2020 & 2033
- Table 66: Japan Smartphone Display Revenue (billion) Forecast, by Application 2020 & 2033
- Table 67: South Korea Smartphone Display Revenue (billion) Forecast, by Application 2020 & 2033
- Table 68: ASEAN Smartphone Display Revenue (billion) Forecast, by Application 2020 & 2033
- Table 69: Oceania Smartphone Display Revenue (billion) Forecast, by Application 2020 & 2033
- Table 70: Rest of Asia Pacific Smartphone Display Revenue (billion) Forecast, by Application 2020 & 2033
Frequently Asked Questions
1. What is the projected Compound Annual Growth Rate (CAGR) of the Smartphone Display?
The projected CAGR is approximately 5%.
2. Which companies are prominent players in the Smartphone Display?
Key companies in the market include SAMSUNG, Japan Display Inc., Toshiba Corporation, LG Electronics Inc., Sharp Corporation, BOE, Fujitsu Ltd., Sony Corporation, Apple Inc.,, Motorola Inc, Mitsubishi Electric Corporation, Innolux Corporation, AUO, Others.
3. What are the main segments of the Smartphone Display?
The market segments include Type, Form Factor, Resolution, Size, Price Range, Sales Channel.
4. Can you provide details about the market size?
The market size is estimated to be USD 141.36 billion as of 2022.
5. What are some drivers contributing to market growth?
N/A
6. What are the notable trends driving market growth?
N/A
7. Are there any restraints impacting market growth?
N/A
8. Can you provide examples of recent developments in the market?
N/A
9. What pricing options are available for accessing the report?
Pricing options include single-user, multi-user, and enterprise licenses priced at USD 2900.00, USD 4350.00, and USD 5800.00 respectively.
10. Is the market size provided in terms of value or volume?
The market size is provided in terms of value, measured in billion.
11. Are there any specific market keywords associated with the report?
Yes, the market keyword associated with the report is "Smartphone Display," which aids in identifying and referencing the specific market segment covered.
12. How do I determine which pricing option suits my needs best?
The pricing options vary based on user requirements and access needs. Individual users may opt for single-user licenses, while businesses requiring broader access may choose multi-user or enterprise licenses for cost-effective access to the report.
13. Are there any additional resources or data provided in the Smartphone Display report?
While the report offers comprehensive insights, it's advisable to review the specific contents or supplementary materials provided to ascertain if additional resources or data are available.
14. How can I stay updated on further developments or reports in the Smartphone Display?
To stay informed about further developments, trends, and reports in the Smartphone Display, consider subscribing to industry newsletters, following relevant companies and organizations, or regularly checking reputable industry news sources and publications.
Methodology
Step 1 - Identification of Relevant Samples Size from Population Database



Step 2 - Approaches for Defining Global Market Size (Value, Volume* & Price*)

Note*: In applicable scenarios
Step 3 - Data Sources
Primary Research
- Web Analytics
- Survey Reports
- Research Institute
- Latest Research Reports
- Opinion Leaders
Secondary Research
- Annual Reports
- White Paper
- Latest Press Release
- Industry Association
- Paid Database
- Investor Presentations

Step 4 - Data Triangulation
Involves using different sources of information in order to increase the validity of a study
These sources are likely to be stakeholders in a program - participants, other researchers, program staff, other community members, and so on.
Then we put all data in single framework & apply various statistical tools to find out the dynamic on the market.
During the analysis stage, feedback from the stakeholder groups would be compared to determine areas of agreement as well as areas of divergence