

Key Insights
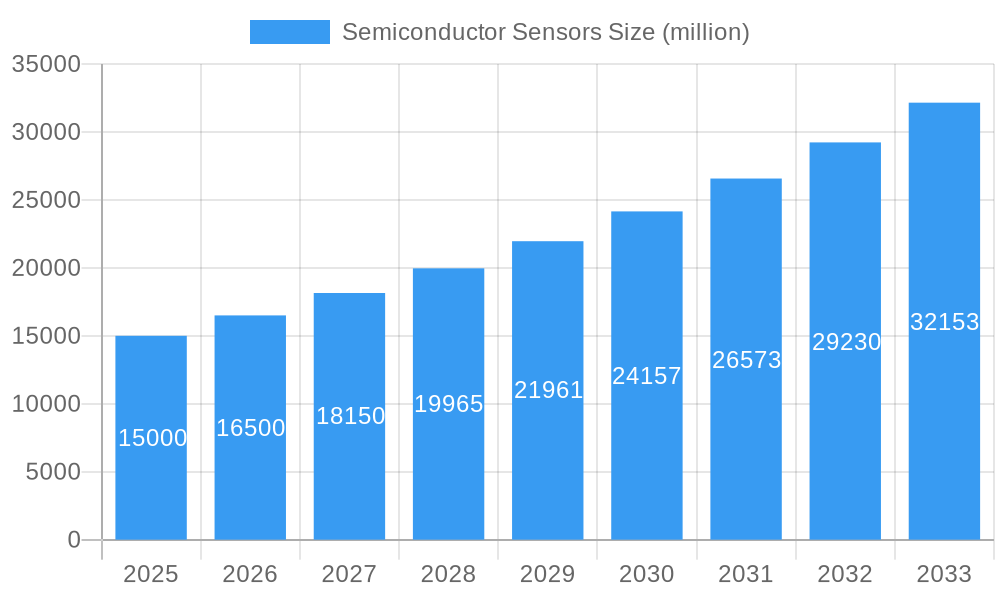
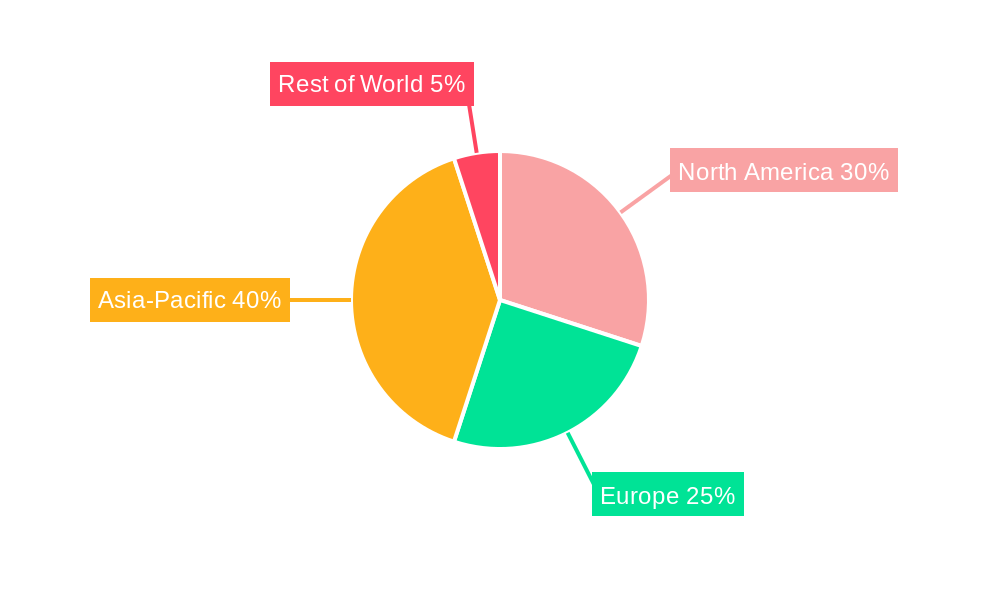
The semiconductor sensor market is experiencing robust growth, driven by the increasing demand for miniaturization, improved accuracy, and enhanced functionality across diverse applications. The market, estimated at $15 billion in 2025, is projected to witness a Compound Annual Growth Rate (CAGR) of 10% from 2025 to 2033, reaching approximately $39 billion by 2033. Key drivers include the proliferation of smart devices, the rise of the Internet of Things (IoT), advancements in automotive technology (particularly autonomous driving systems), and the growing need for precise and reliable sensing in industrial automation and healthcare. Emerging trends such as the integration of artificial intelligence (AI) and machine learning (ML) into sensor systems are further fueling market expansion. Companies like Figaro, Honeywell, and Nissha are key players, leveraging their expertise in miniaturization, material science, and advanced manufacturing processes. However, challenges remain, including the high cost of development and integration, the need for improved power efficiency, and concerns around data security and privacy in IoT applications. The market is segmented by sensor type (e.g., pressure, temperature, humidity), application (e.g., automotive, consumer electronics, industrial), and region (e.g., North America, Asia-Pacific, Europe). Asia-Pacific, particularly China, is expected to dominate the market due to robust manufacturing and technological advancements.
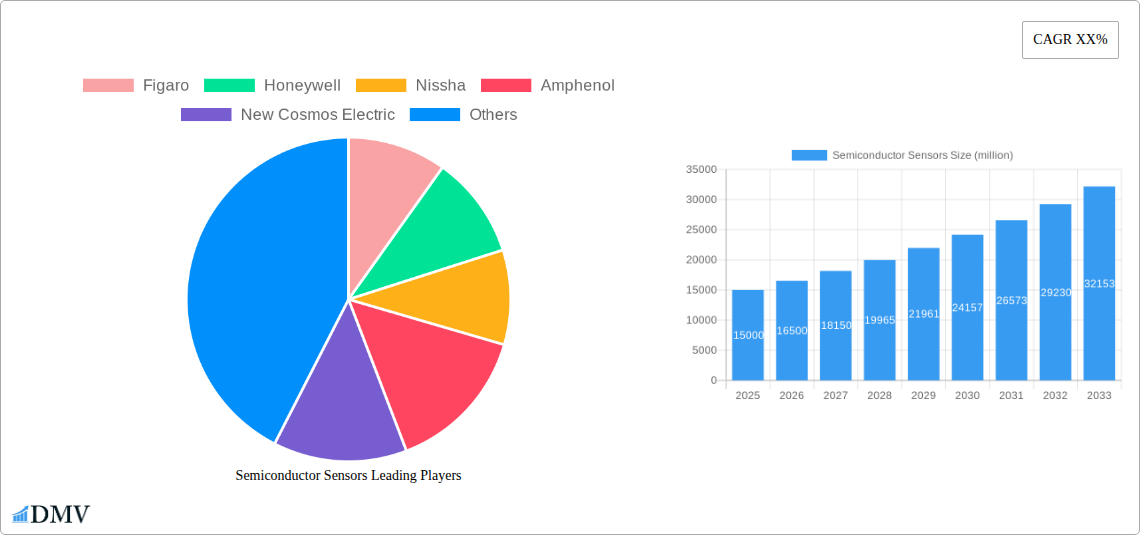
Semiconductor Sensors Market Size (In Billion)
The competitive landscape is characterized by both established players and emerging startups. Established players are focusing on expanding their product portfolios and strengthening their supply chains, while startups are innovating in areas like low-power consumption and advanced sensor integration. The market's future growth will largely depend on technological advancements, regulatory frameworks around data privacy, and the ongoing development of new applications for semiconductor sensors. Over the next decade, we anticipate a continuous shift towards more sophisticated sensors with improved performance metrics and integration capabilities, contributing to broader adoption across a wide spectrum of industries. The market's growth trajectory is poised to be shaped by collaborations between sensor manufacturers, software developers, and end-users to deliver complete, integrated sensing solutions.
Semiconductor Sensors Company Market Share
Semiconductor Sensors Market Report: 2019-2033
This comprehensive report provides an in-depth analysis of the global semiconductor sensors market, projecting a market value exceeding $XX million by 2033. The study covers the historical period (2019-2024), the base year (2025), and the forecast period (2025-2033), offering crucial insights for stakeholders seeking to navigate this rapidly evolving landscape. Key players like Figaro, Honeywell, Nissha, Amphenol, New Cosmos Electric, Alphasense, Sensorix, MGK Sensor, Shanghai AICI, China Wafer Level CSP, and Zhengzhou Winsen are meticulously analyzed, providing a complete understanding of market dynamics and future growth potential.
Semiconductor Sensors Market Composition & Trends
The global semiconductor sensor market exhibits a moderately concentrated landscape, with the top five players holding approximately XX% of the market share in 2025. However, the market is characterized by intense competition, driven by continuous innovation and the emergence of new players, particularly from the Asia-Pacific region. Regulatory landscapes, varying across different geographies, significantly impact market access and growth. Substitute products, such as MEMS-based sensors and other emerging technologies, pose a challenge to traditional semiconductor sensors. The end-user base spans diverse sectors, including automotive, healthcare, industrial automation, and consumer electronics, each with unique demands and growth trajectories. Furthermore, the market has witnessed significant M&A activity, with deal values exceeding $XX million in the last five years, indicating consolidation and strategic expansion efforts by leading players.
- Market Share Distribution (2025): Top 5 players: XX%; Others: XX%
- M&A Activity (2019-2024): Total deal value exceeding $XX million. Key acquisitions include [insert details of significant acquisitions if available, otherwise state "data unavailable"].
- Key Innovation Catalysts: Miniaturization, enhanced sensitivity, improved power efficiency, and integration with advanced processing capabilities.
- Regulatory Landscape: Varying standards and certifications across regions impacting product development and market entry.
- Substitute Products: MEMS sensors, optical sensors, and other emerging technologies.
Semiconductor Sensors Industry Evolution
The semiconductor sensor market has witnessed remarkable growth, expanding at a CAGR of XX% during the historical period (2019-2024) and projected to grow at a CAGR of XX% during the forecast period (2025-2033). This growth is fueled by several key factors, including the rising adoption of IoT devices, the increasing demand for automation across various industries, and the development of advanced sensor technologies enabling new applications. Technological advancements, such as the integration of artificial intelligence (AI) and machine learning (ML) in sensor systems, are further propelling market growth. Consumer demands for smaller, more energy-efficient, and higher-performing sensors are shaping the product development roadmap for major players. The automotive industry, in particular, is a key driver, with the increasing adoption of Advanced Driver-Assistance Systems (ADAS) and autonomous driving technologies significantly boosting the demand for semiconductor sensors.
Leading Regions, Countries, or Segments in Semiconductor Sensors
The Asia-Pacific region is currently the dominant market for semiconductor sensors, driven by robust economic growth, substantial government investments in technological advancements, and a large and rapidly expanding manufacturing base. Within the Asia-Pacific region, China and South Korea stand out as leading national markets, benefiting from significant government support for the semiconductor industry. The automotive segment is the largest end-use segment, followed by consumer electronics and industrial automation.
- Key Drivers for Asia-Pacific Dominance:
- Strong economic growth and increasing disposable incomes.
- Government initiatives and investment in semiconductor technology.
- Large and growing manufacturing base.
- High adoption of consumer electronics and IoT devices.
- Dominance Factors: High production volumes, lower manufacturing costs, and strong government support for the semiconductor industry.
Semiconductor Sensors Product Innovations
Recent innovations include the development of highly sensitive and miniaturized sensors with improved power efficiency, enabling integration into smaller and more energy-efficient devices. Advanced materials and fabrication processes are leading to improved performance metrics such as higher accuracy, wider operating temperature ranges, and increased longevity. Unique selling propositions are centered around enhanced functionality, improved reliability, and cost-effectiveness. Technological advancements like the integration of AI and ML capabilities are creating smarter and more adaptive sensor systems.
Propelling Factors for Semiconductor Sensors Growth
Several factors are driving the growth of the semiconductor sensor market. Technological advancements, such as the development of advanced materials and fabrication techniques, are continuously improving sensor performance and functionality. The increasing demand for automation across various industries, including automotive, healthcare, and industrial automation, is fueling the adoption of semiconductor sensors. Furthermore, supportive government policies and regulations encouraging technological innovation are creating a favorable environment for market growth. The expanding applications of IoT technologies are further augmenting demand.
Obstacles in the Semiconductor Sensors Market
Challenges facing the semiconductor sensor market include supply chain disruptions, particularly in the procurement of raw materials and specialized components. Stringent regulatory requirements and certification processes across different regions pose significant hurdles for market entry. Intense competition from established players and the emergence of new entrants is creating pricing pressures and impacting profitability. These factors combined are estimated to have a negative impact of XX% on market growth in 2025.
Future Opportunities in Semiconductor Sensors
The future of the semiconductor sensor market is promising, with considerable opportunities arising from the adoption of new technologies such as 5G and AI. The emergence of new applications in areas like environmental monitoring and precision agriculture are creating new avenues for growth. The increasing demand for smart devices and connected systems is further driving the adoption of semiconductor sensors.
Major Players in the Semiconductor Sensors Ecosystem
- Figaro
- Honeywell
- Nissha
- Amphenol
- New Cosmos Electric
- Alphasense
- Sensorix
- MGK Sensor
- Shanghai AICI
- China Wafer Level CSP
- Zhengzhou Winsen
Key Developments in Semiconductor Sensors Industry
- 2023 Q1: Honeywell launched a new line of high-precision pressure sensors, expanding its portfolio in the industrial automation sector.
- 2022 Q4: Figaro announced a strategic partnership with a leading automotive supplier to develop advanced sensor solutions for autonomous vehicles.
- 2021 Q3: A significant merger between two key players resulted in a consolidation of market share in the biomedical sensors segment. [Further details if available, otherwise remove this point]
Strategic Semiconductor Sensors Market Forecast
The semiconductor sensor market is poised for continued growth driven by technological advancements, increasing demand from various industries, and the expansion of IoT applications. Future opportunities lie in the development of innovative sensor technologies targeting emerging applications in areas such as environmental monitoring, healthcare, and autonomous vehicles. The market is expected to reach a value exceeding $XX million by 2033, indicating a significant potential for investment and expansion.
Semiconductor Sensors Segmentation
-
1. Application
- 1.1. Industrial Automation
- 1.2. Household Appliance
- 1.3. Environmental Monitoring
- 1.4. Medical
- 1.5. Automobile
- 1.6. Others
-
2. Types
- 2.1. Temperature Sensor
- 2.2. Pressure Sensor
- 2.3. Humidity Sensor
- 2.4. Gas Sensor
- 2.5. Others
Semiconductor Sensors Segmentation By Geography
-
1. North America
- 1.1. United States
- 1.2. Canada
- 1.3. Mexico
-
2. South America
- 2.1. Brazil
- 2.2. Argentina
- 2.3. Rest of South America
-
3. Europe
- 3.1. United Kingdom
- 3.2. Germany
- 3.3. France
- 3.4. Italy
- 3.5. Spain
- 3.6. Russia
- 3.7. Benelux
- 3.8. Nordics
- 3.9. Rest of Europe
-
4. Middle East & Africa
- 4.1. Turkey
- 4.2. Israel
- 4.3. GCC
- 4.4. North Africa
- 4.5. South Africa
- 4.6. Rest of Middle East & Africa
-
5. Asia Pacific
- 5.1. China
- 5.2. India
- 5.3. Japan
- 5.4. South Korea
- 5.5. ASEAN
- 5.6. Oceania
- 5.7. Rest of Asia Pacific
Semiconductor Sensors Regional Market Share
Geographic Coverage of Semiconductor Sensors
Semiconductor Sensors REPORT HIGHLIGHTS
| Aspects | Details |
|---|---|
| Study Period | 2020-2034 |
| Base Year | 2025 |
| Estimated Year | 2026 |
| Forecast Period | 2026-2034 |
| Historical Period | 2020-2025 |
| Growth Rate | CAGR of 6.25% from 2020-2034 |
| Segmentation |
|
Table of Contents
- 1. Introduction
- 1.1. Research Scope
- 1.2. Market Segmentation
- 1.3. Research Objective
- 1.4. Definitions and Assumptions
- 2. Executive Summary
- 2.1. Market Snapshot
- 3. Market Dynamics
- 3.1. Market Drivers
- 3.2. Market Restrains
- 3.3. Market Trends
- 3.4. Market Opportunities
- 4. Market Factor Analysis
- 4.1. Porters Five Forces
- 4.1.1. Bargaining Power of Suppliers
- 4.1.2. Bargaining Power of Buyers
- 4.1.3. Threat of New Entrants
- 4.1.4. Threat of Substitutes
- 4.1.5. Competitive Rivalry
- 4.2. PESTEL analysis
- 4.3. BCG Analysis
- 4.3.1. Stars (High Growth, High Market Share)
- 4.3.2. Cash Cows (Low Growth, High Market Share)
- 4.3.3. Question Mark (High Growth, Low Market Share)
- 4.3.4. Dogs (Low Growth, Low Market Share)
- 4.4. Ansoff Matrix Analysis
- 4.5. Supply Chain Analysis
- 4.6. Regulatory Landscape
- 4.7. Current Market Potential and Opportunity Assessment (TAM–SAM–SOM Framework)
- 4.8. DMV Analyst Note
- 4.1. Porters Five Forces
- 5. Market Analysis, Insights and Forecast 2021-2033
- 5.1. Market Analysis, Insights and Forecast - by Application
- 5.1.1. Industrial Automation
- 5.1.2. Household Appliance
- 5.1.3. Environmental Monitoring
- 5.1.4. Medical
- 5.1.5. Automobile
- 5.1.6. Others
- 5.2. Market Analysis, Insights and Forecast - by Types
- 5.2.1. Temperature Sensor
- 5.2.2. Pressure Sensor
- 5.2.3. Humidity Sensor
- 5.2.4. Gas Sensor
- 5.2.5. Others
- 5.3. Market Analysis, Insights and Forecast - by Region
- 5.3.1. North America
- 5.3.2. South America
- 5.3.3. Europe
- 5.3.4. Middle East & Africa
- 5.3.5. Asia Pacific
- 5.1. Market Analysis, Insights and Forecast - by Application
- 6. Global Semiconductor Sensors Analysis, Insights and Forecast, 2021-2033
- 6.1. Market Analysis, Insights and Forecast - by Application
- 6.1.1. Industrial Automation
- 6.1.2. Household Appliance
- 6.1.3. Environmental Monitoring
- 6.1.4. Medical
- 6.1.5. Automobile
- 6.1.6. Others
- 6.2. Market Analysis, Insights and Forecast - by Types
- 6.2.1. Temperature Sensor
- 6.2.2. Pressure Sensor
- 6.2.3. Humidity Sensor
- 6.2.4. Gas Sensor
- 6.2.5. Others
- 6.1. Market Analysis, Insights and Forecast - by Application
- 7. North America Semiconductor Sensors Analysis, Insights and Forecast, 2020-2032
- 7.1. Market Analysis, Insights and Forecast - by Application
- 7.1.1. Industrial Automation
- 7.1.2. Household Appliance
- 7.1.3. Environmental Monitoring
- 7.1.4. Medical
- 7.1.5. Automobile
- 7.1.6. Others
- 7.2. Market Analysis, Insights and Forecast - by Types
- 7.2.1. Temperature Sensor
- 7.2.2. Pressure Sensor
- 7.2.3. Humidity Sensor
- 7.2.4. Gas Sensor
- 7.2.5. Others
- 7.1. Market Analysis, Insights and Forecast - by Application
- 8. South America Semiconductor Sensors Analysis, Insights and Forecast, 2020-2032
- 8.1. Market Analysis, Insights and Forecast - by Application
- 8.1.1. Industrial Automation
- 8.1.2. Household Appliance
- 8.1.3. Environmental Monitoring
- 8.1.4. Medical
- 8.1.5. Automobile
- 8.1.6. Others
- 8.2. Market Analysis, Insights and Forecast - by Types
- 8.2.1. Temperature Sensor
- 8.2.2. Pressure Sensor
- 8.2.3. Humidity Sensor
- 8.2.4. Gas Sensor
- 8.2.5. Others
- 8.1. Market Analysis, Insights and Forecast - by Application
- 9. Europe Semiconductor Sensors Analysis, Insights and Forecast, 2020-2032
- 9.1. Market Analysis, Insights and Forecast - by Application
- 9.1.1. Industrial Automation
- 9.1.2. Household Appliance
- 9.1.3. Environmental Monitoring
- 9.1.4. Medical
- 9.1.5. Automobile
- 9.1.6. Others
- 9.2. Market Analysis, Insights and Forecast - by Types
- 9.2.1. Temperature Sensor
- 9.2.2. Pressure Sensor
- 9.2.3. Humidity Sensor
- 9.2.4. Gas Sensor
- 9.2.5. Others
- 9.1. Market Analysis, Insights and Forecast - by Application
- 10. Middle East & Africa Semiconductor Sensors Analysis, Insights and Forecast, 2020-2032
- 10.1. Market Analysis, Insights and Forecast - by Application
- 10.1.1. Industrial Automation
- 10.1.2. Household Appliance
- 10.1.3. Environmental Monitoring
- 10.1.4. Medical
- 10.1.5. Automobile
- 10.1.6. Others
- 10.2. Market Analysis, Insights and Forecast - by Types
- 10.2.1. Temperature Sensor
- 10.2.2. Pressure Sensor
- 10.2.3. Humidity Sensor
- 10.2.4. Gas Sensor
- 10.2.5. Others
- 10.1. Market Analysis, Insights and Forecast - by Application
- 11. Asia Pacific Semiconductor Sensors Analysis, Insights and Forecast, 2020-2032
- 11.1. Market Analysis, Insights and Forecast - by Application
- 11.1.1. Industrial Automation
- 11.1.2. Household Appliance
- 11.1.3. Environmental Monitoring
- 11.1.4. Medical
- 11.1.5. Automobile
- 11.1.6. Others
- 11.2. Market Analysis, Insights and Forecast - by Types
- 11.2.1. Temperature Sensor
- 11.2.2. Pressure Sensor
- 11.2.3. Humidity Sensor
- 11.2.4. Gas Sensor
- 11.2.5. Others
- 11.1. Market Analysis, Insights and Forecast - by Application
- 12. Competitive Analysis
- 12.1. Company Profiles
- 12.1.1 Figaro
- 12.1.1.1. Company Overview
- 12.1.1.2. Products
- 12.1.1.3. Company Financials
- 12.1.1.4. SWOT Analysis
- 12.1.2 Honeywell
- 12.1.2.1. Company Overview
- 12.1.2.2. Products
- 12.1.2.3. Company Financials
- 12.1.2.4. SWOT Analysis
- 12.1.3 Nissha
- 12.1.3.1. Company Overview
- 12.1.3.2. Products
- 12.1.3.3. Company Financials
- 12.1.3.4. SWOT Analysis
- 12.1.4 Amphenol
- 12.1.4.1. Company Overview
- 12.1.4.2. Products
- 12.1.4.3. Company Financials
- 12.1.4.4. SWOT Analysis
- 12.1.5 New Cosmos Electric
- 12.1.5.1. Company Overview
- 12.1.5.2. Products
- 12.1.5.3. Company Financials
- 12.1.5.4. SWOT Analysis
- 12.1.6 Alphasense
- 12.1.6.1. Company Overview
- 12.1.6.2. Products
- 12.1.6.3. Company Financials
- 12.1.6.4. SWOT Analysis
- 12.1.7 Sensorix
- 12.1.7.1. Company Overview
- 12.1.7.2. Products
- 12.1.7.3. Company Financials
- 12.1.7.4. SWOT Analysis
- 12.1.8 MGK Sensor
- 12.1.8.1. Company Overview
- 12.1.8.2. Products
- 12.1.8.3. Company Financials
- 12.1.8.4. SWOT Analysis
- 12.1.9 Shanghai AICI
- 12.1.9.1. Company Overview
- 12.1.9.2. Products
- 12.1.9.3. Company Financials
- 12.1.9.4. SWOT Analysis
- 12.1.10 China Wafer Level CSP
- 12.1.10.1. Company Overview
- 12.1.10.2. Products
- 12.1.10.3. Company Financials
- 12.1.10.4. SWOT Analysis
- 12.1.11 Zhengzhou Winsen
- 12.1.11.1. Company Overview
- 12.1.11.2. Products
- 12.1.11.3. Company Financials
- 12.1.11.4. SWOT Analysis
- 12.1.1 Figaro
- 12.2. Market Entropy
- 12.2.1 Company's Key Areas Served
- 12.2.2 Recent Developments
- 12.3. Company Market Share Analysis 2025
- 12.3.1 Top 5 Companies Market Share Analysis
- 12.3.2 Top 3 Companies Market Share Analysis
- 12.4. List of Potential Customers
- 13. Research Methodology
List of Figures
- Figure 1: Global Semiconductor Sensors Revenue Breakdown (billion, %) by Region 2025 & 2033
- Figure 2: Global Semiconductor Sensors Volume Breakdown (K, %) by Region 2025 & 2033
- Figure 3: North America Semiconductor Sensors Revenue (billion), by Application 2025 & 2033
- Figure 4: North America Semiconductor Sensors Volume (K), by Application 2025 & 2033
- Figure 5: North America Semiconductor Sensors Revenue Share (%), by Application 2025 & 2033
- Figure 6: North America Semiconductor Sensors Volume Share (%), by Application 2025 & 2033
- Figure 7: North America Semiconductor Sensors Revenue (billion), by Types 2025 & 2033
- Figure 8: North America Semiconductor Sensors Volume (K), by Types 2025 & 2033
- Figure 9: North America Semiconductor Sensors Revenue Share (%), by Types 2025 & 2033
- Figure 10: North America Semiconductor Sensors Volume Share (%), by Types 2025 & 2033
- Figure 11: North America Semiconductor Sensors Revenue (billion), by Country 2025 & 2033
- Figure 12: North America Semiconductor Sensors Volume (K), by Country 2025 & 2033
- Figure 13: North America Semiconductor Sensors Revenue Share (%), by Country 2025 & 2033
- Figure 14: North America Semiconductor Sensors Volume Share (%), by Country 2025 & 2033
- Figure 15: South America Semiconductor Sensors Revenue (billion), by Application 2025 & 2033
- Figure 16: South America Semiconductor Sensors Volume (K), by Application 2025 & 2033
- Figure 17: South America Semiconductor Sensors Revenue Share (%), by Application 2025 & 2033
- Figure 18: South America Semiconductor Sensors Volume Share (%), by Application 2025 & 2033
- Figure 19: South America Semiconductor Sensors Revenue (billion), by Types 2025 & 2033
- Figure 20: South America Semiconductor Sensors Volume (K), by Types 2025 & 2033
- Figure 21: South America Semiconductor Sensors Revenue Share (%), by Types 2025 & 2033
- Figure 22: South America Semiconductor Sensors Volume Share (%), by Types 2025 & 2033
- Figure 23: South America Semiconductor Sensors Revenue (billion), by Country 2025 & 2033
- Figure 24: South America Semiconductor Sensors Volume (K), by Country 2025 & 2033
- Figure 25: South America Semiconductor Sensors Revenue Share (%), by Country 2025 & 2033
- Figure 26: South America Semiconductor Sensors Volume Share (%), by Country 2025 & 2033
- Figure 27: Europe Semiconductor Sensors Revenue (billion), by Application 2025 & 2033
- Figure 28: Europe Semiconductor Sensors Volume (K), by Application 2025 & 2033
- Figure 29: Europe Semiconductor Sensors Revenue Share (%), by Application 2025 & 2033
- Figure 30: Europe Semiconductor Sensors Volume Share (%), by Application 2025 & 2033
- Figure 31: Europe Semiconductor Sensors Revenue (billion), by Types 2025 & 2033
- Figure 32: Europe Semiconductor Sensors Volume (K), by Types 2025 & 2033
- Figure 33: Europe Semiconductor Sensors Revenue Share (%), by Types 2025 & 2033
- Figure 34: Europe Semiconductor Sensors Volume Share (%), by Types 2025 & 2033
- Figure 35: Europe Semiconductor Sensors Revenue (billion), by Country 2025 & 2033
- Figure 36: Europe Semiconductor Sensors Volume (K), by Country 2025 & 2033
- Figure 37: Europe Semiconductor Sensors Revenue Share (%), by Country 2025 & 2033
- Figure 38: Europe Semiconductor Sensors Volume Share (%), by Country 2025 & 2033
- Figure 39: Middle East & Africa Semiconductor Sensors Revenue (billion), by Application 2025 & 2033
- Figure 40: Middle East & Africa Semiconductor Sensors Volume (K), by Application 2025 & 2033
- Figure 41: Middle East & Africa Semiconductor Sensors Revenue Share (%), by Application 2025 & 2033
- Figure 42: Middle East & Africa Semiconductor Sensors Volume Share (%), by Application 2025 & 2033
- Figure 43: Middle East & Africa Semiconductor Sensors Revenue (billion), by Types 2025 & 2033
- Figure 44: Middle East & Africa Semiconductor Sensors Volume (K), by Types 2025 & 2033
- Figure 45: Middle East & Africa Semiconductor Sensors Revenue Share (%), by Types 2025 & 2033
- Figure 46: Middle East & Africa Semiconductor Sensors Volume Share (%), by Types 2025 & 2033
- Figure 47: Middle East & Africa Semiconductor Sensors Revenue (billion), by Country 2025 & 2033
- Figure 48: Middle East & Africa Semiconductor Sensors Volume (K), by Country 2025 & 2033
- Figure 49: Middle East & Africa Semiconductor Sensors Revenue Share (%), by Country 2025 & 2033
- Figure 50: Middle East & Africa Semiconductor Sensors Volume Share (%), by Country 2025 & 2033
- Figure 51: Asia Pacific Semiconductor Sensors Revenue (billion), by Application 2025 & 2033
- Figure 52: Asia Pacific Semiconductor Sensors Volume (K), by Application 2025 & 2033
- Figure 53: Asia Pacific Semiconductor Sensors Revenue Share (%), by Application 2025 & 2033
- Figure 54: Asia Pacific Semiconductor Sensors Volume Share (%), by Application 2025 & 2033
- Figure 55: Asia Pacific Semiconductor Sensors Revenue (billion), by Types 2025 & 2033
- Figure 56: Asia Pacific Semiconductor Sensors Volume (K), by Types 2025 & 2033
- Figure 57: Asia Pacific Semiconductor Sensors Revenue Share (%), by Types 2025 & 2033
- Figure 58: Asia Pacific Semiconductor Sensors Volume Share (%), by Types 2025 & 2033
- Figure 59: Asia Pacific Semiconductor Sensors Revenue (billion), by Country 2025 & 2033
- Figure 60: Asia Pacific Semiconductor Sensors Volume (K), by Country 2025 & 2033
- Figure 61: Asia Pacific Semiconductor Sensors Revenue Share (%), by Country 2025 & 2033
- Figure 62: Asia Pacific Semiconductor Sensors Volume Share (%), by Country 2025 & 2033
List of Tables
- Table 1: Global Semiconductor Sensors Revenue billion Forecast, by Application 2020 & 2033
- Table 2: Global Semiconductor Sensors Volume K Forecast, by Application 2020 & 2033
- Table 3: Global Semiconductor Sensors Revenue billion Forecast, by Types 2020 & 2033
- Table 4: Global Semiconductor Sensors Volume K Forecast, by Types 2020 & 2033
- Table 5: Global Semiconductor Sensors Revenue billion Forecast, by Region 2020 & 2033
- Table 6: Global Semiconductor Sensors Volume K Forecast, by Region 2020 & 2033
- Table 7: Global Semiconductor Sensors Revenue billion Forecast, by Application 2020 & 2033
- Table 8: Global Semiconductor Sensors Volume K Forecast, by Application 2020 & 2033
- Table 9: Global Semiconductor Sensors Revenue billion Forecast, by Types 2020 & 2033
- Table 10: Global Semiconductor Sensors Volume K Forecast, by Types 2020 & 2033
- Table 11: Global Semiconductor Sensors Revenue billion Forecast, by Country 2020 & 2033
- Table 12: Global Semiconductor Sensors Volume K Forecast, by Country 2020 & 2033
- Table 13: United States Semiconductor Sensors Revenue (billion) Forecast, by Application 2020 & 2033
- Table 14: United States Semiconductor Sensors Volume (K) Forecast, by Application 2020 & 2033
- Table 15: Canada Semiconductor Sensors Revenue (billion) Forecast, by Application 2020 & 2033
- Table 16: Canada Semiconductor Sensors Volume (K) Forecast, by Application 2020 & 2033
- Table 17: Mexico Semiconductor Sensors Revenue (billion) Forecast, by Application 2020 & 2033
- Table 18: Mexico Semiconductor Sensors Volume (K) Forecast, by Application 2020 & 2033
- Table 19: Global Semiconductor Sensors Revenue billion Forecast, by Application 2020 & 2033
- Table 20: Global Semiconductor Sensors Volume K Forecast, by Application 2020 & 2033
- Table 21: Global Semiconductor Sensors Revenue billion Forecast, by Types 2020 & 2033
- Table 22: Global Semiconductor Sensors Volume K Forecast, by Types 2020 & 2033
- Table 23: Global Semiconductor Sensors Revenue billion Forecast, by Country 2020 & 2033
- Table 24: Global Semiconductor Sensors Volume K Forecast, by Country 2020 & 2033
- Table 25: Brazil Semiconductor Sensors Revenue (billion) Forecast, by Application 2020 & 2033
- Table 26: Brazil Semiconductor Sensors Volume (K) Forecast, by Application 2020 & 2033
- Table 27: Argentina Semiconductor Sensors Revenue (billion) Forecast, by Application 2020 & 2033
- Table 28: Argentina Semiconductor Sensors Volume (K) Forecast, by Application 2020 & 2033
- Table 29: Rest of South America Semiconductor Sensors Revenue (billion) Forecast, by Application 2020 & 2033
- Table 30: Rest of South America Semiconductor Sensors Volume (K) Forecast, by Application 2020 & 2033
- Table 31: Global Semiconductor Sensors Revenue billion Forecast, by Application 2020 & 2033
- Table 32: Global Semiconductor Sensors Volume K Forecast, by Application 2020 & 2033
- Table 33: Global Semiconductor Sensors Revenue billion Forecast, by Types 2020 & 2033
- Table 34: Global Semiconductor Sensors Volume K Forecast, by Types 2020 & 2033
- Table 35: Global Semiconductor Sensors Revenue billion Forecast, by Country 2020 & 2033
- Table 36: Global Semiconductor Sensors Volume K Forecast, by Country 2020 & 2033
- Table 37: United Kingdom Semiconductor Sensors Revenue (billion) Forecast, by Application 2020 & 2033
- Table 38: United Kingdom Semiconductor Sensors Volume (K) Forecast, by Application 2020 & 2033
- Table 39: Germany Semiconductor Sensors Revenue (billion) Forecast, by Application 2020 & 2033
- Table 40: Germany Semiconductor Sensors Volume (K) Forecast, by Application 2020 & 2033
- Table 41: France Semiconductor Sensors Revenue (billion) Forecast, by Application 2020 & 2033
- Table 42: France Semiconductor Sensors Volume (K) Forecast, by Application 2020 & 2033
- Table 43: Italy Semiconductor Sensors Revenue (billion) Forecast, by Application 2020 & 2033
- Table 44: Italy Semiconductor Sensors Volume (K) Forecast, by Application 2020 & 2033
- Table 45: Spain Semiconductor Sensors Revenue (billion) Forecast, by Application 2020 & 2033
- Table 46: Spain Semiconductor Sensors Volume (K) Forecast, by Application 2020 & 2033
- Table 47: Russia Semiconductor Sensors Revenue (billion) Forecast, by Application 2020 & 2033
- Table 48: Russia Semiconductor Sensors Volume (K) Forecast, by Application 2020 & 2033
- Table 49: Benelux Semiconductor Sensors Revenue (billion) Forecast, by Application 2020 & 2033
- Table 50: Benelux Semiconductor Sensors Volume (K) Forecast, by Application 2020 & 2033
- Table 51: Nordics Semiconductor Sensors Revenue (billion) Forecast, by Application 2020 & 2033
- Table 52: Nordics Semiconductor Sensors Volume (K) Forecast, by Application 2020 & 2033
- Table 53: Rest of Europe Semiconductor Sensors Revenue (billion) Forecast, by Application 2020 & 2033
- Table 54: Rest of Europe Semiconductor Sensors Volume (K) Forecast, by Application 2020 & 2033
- Table 55: Global Semiconductor Sensors Revenue billion Forecast, by Application 2020 & 2033
- Table 56: Global Semiconductor Sensors Volume K Forecast, by Application 2020 & 2033
- Table 57: Global Semiconductor Sensors Revenue billion Forecast, by Types 2020 & 2033
- Table 58: Global Semiconductor Sensors Volume K Forecast, by Types 2020 & 2033
- Table 59: Global Semiconductor Sensors Revenue billion Forecast, by Country 2020 & 2033
- Table 60: Global Semiconductor Sensors Volume K Forecast, by Country 2020 & 2033
- Table 61: Turkey Semiconductor Sensors Revenue (billion) Forecast, by Application 2020 & 2033
- Table 62: Turkey Semiconductor Sensors Volume (K) Forecast, by Application 2020 & 2033
- Table 63: Israel Semiconductor Sensors Revenue (billion) Forecast, by Application 2020 & 2033
- Table 64: Israel Semiconductor Sensors Volume (K) Forecast, by Application 2020 & 2033
- Table 65: GCC Semiconductor Sensors Revenue (billion) Forecast, by Application 2020 & 2033
- Table 66: GCC Semiconductor Sensors Volume (K) Forecast, by Application 2020 & 2033
- Table 67: North Africa Semiconductor Sensors Revenue (billion) Forecast, by Application 2020 & 2033
- Table 68: North Africa Semiconductor Sensors Volume (K) Forecast, by Application 2020 & 2033
- Table 69: South Africa Semiconductor Sensors Revenue (billion) Forecast, by Application 2020 & 2033
- Table 70: South Africa Semiconductor Sensors Volume (K) Forecast, by Application 2020 & 2033
- Table 71: Rest of Middle East & Africa Semiconductor Sensors Revenue (billion) Forecast, by Application 2020 & 2033
- Table 72: Rest of Middle East & Africa Semiconductor Sensors Volume (K) Forecast, by Application 2020 & 2033
- Table 73: Global Semiconductor Sensors Revenue billion Forecast, by Application 2020 & 2033
- Table 74: Global Semiconductor Sensors Volume K Forecast, by Application 2020 & 2033
- Table 75: Global Semiconductor Sensors Revenue billion Forecast, by Types 2020 & 2033
- Table 76: Global Semiconductor Sensors Volume K Forecast, by Types 2020 & 2033
- Table 77: Global Semiconductor Sensors Revenue billion Forecast, by Country 2020 & 2033
- Table 78: Global Semiconductor Sensors Volume K Forecast, by Country 2020 & 2033
- Table 79: China Semiconductor Sensors Revenue (billion) Forecast, by Application 2020 & 2033
- Table 80: China Semiconductor Sensors Volume (K) Forecast, by Application 2020 & 2033
- Table 81: India Semiconductor Sensors Revenue (billion) Forecast, by Application 2020 & 2033
- Table 82: India Semiconductor Sensors Volume (K) Forecast, by Application 2020 & 2033
- Table 83: Japan Semiconductor Sensors Revenue (billion) Forecast, by Application 2020 & 2033
- Table 84: Japan Semiconductor Sensors Volume (K) Forecast, by Application 2020 & 2033
- Table 85: South Korea Semiconductor Sensors Revenue (billion) Forecast, by Application 2020 & 2033
- Table 86: South Korea Semiconductor Sensors Volume (K) Forecast, by Application 2020 & 2033
- Table 87: ASEAN Semiconductor Sensors Revenue (billion) Forecast, by Application 2020 & 2033
- Table 88: ASEAN Semiconductor Sensors Volume (K) Forecast, by Application 2020 & 2033
- Table 89: Oceania Semiconductor Sensors Revenue (billion) Forecast, by Application 2020 & 2033
- Table 90: Oceania Semiconductor Sensors Volume (K) Forecast, by Application 2020 & 2033
- Table 91: Rest of Asia Pacific Semiconductor Sensors Revenue (billion) Forecast, by Application 2020 & 2033
- Table 92: Rest of Asia Pacific Semiconductor Sensors Volume (K) Forecast, by Application 2020 & 2033
Frequently Asked Questions
1. What is the projected Compound Annual Growth Rate (CAGR) of the Semiconductor Sensors?
The projected CAGR is approximately 6.25%.
2. Which companies are prominent players in the Semiconductor Sensors?
Key companies in the market include Figaro, Honeywell, Nissha, Amphenol, New Cosmos Electric, Alphasense, Sensorix, MGK Sensor, Shanghai AICI, China Wafer Level CSP, Zhengzhou Winsen.
3. What are the main segments of the Semiconductor Sensors?
The market segments include Application, Types.
4. Can you provide details about the market size?
The market size is estimated to be USD 702.44 billion as of 2022.
5. What are some drivers contributing to market growth?
N/A
6. What are the notable trends driving market growth?
N/A
7. Are there any restraints impacting market growth?
N/A
8. Can you provide examples of recent developments in the market?
N/A
9. What pricing options are available for accessing the report?
Pricing options include single-user, multi-user, and enterprise licenses priced at USD 3350.00, USD 5025.00, and USD 6700.00 respectively.
10. Is the market size provided in terms of value or volume?
The market size is provided in terms of value, measured in billion and volume, measured in K.
11. Are there any specific market keywords associated with the report?
Yes, the market keyword associated with the report is "Semiconductor Sensors," which aids in identifying and referencing the specific market segment covered.
12. How do I determine which pricing option suits my needs best?
The pricing options vary based on user requirements and access needs. Individual users may opt for single-user licenses, while businesses requiring broader access may choose multi-user or enterprise licenses for cost-effective access to the report.
13. Are there any additional resources or data provided in the Semiconductor Sensors report?
While the report offers comprehensive insights, it's advisable to review the specific contents or supplementary materials provided to ascertain if additional resources or data are available.
14. How can I stay updated on further developments or reports in the Semiconductor Sensors?
To stay informed about further developments, trends, and reports in the Semiconductor Sensors, consider subscribing to industry newsletters, following relevant companies and organizations, or regularly checking reputable industry news sources and publications.
Methodology
Step 1 - Identification of Relevant Samples Size from Population Database


Step 2 - Approaches for Defining Global Market Size (Value, Volume* & Price*)

Note*: In applicable scenarios
Step 3 - Data Sources
Primary Research
- Web Analytics
- Survey Reports
- Research Institute
- Latest Research Reports
- Opinion Leaders
Secondary Research
- Annual Reports
- White Paper
- Latest Press Release
- Industry Association
- Paid Database
- Investor Presentations

Step 4 - Data Triangulation
Involves using different sources of information in order to increase the validity of a study
These sources are likely to be stakeholders in a program - participants, other researchers, program staff, other community members, and so on.
Then we put all data in single framework & apply various statistical tools to find out the dynamic on the market.
During the analysis stage, feedback from the stakeholder groups would be compared to determine areas of agreement as well as areas of divergence