

Key Insights
The global Oncology & Cancer Drugs market is poised for significant expansion, projected to reach $261.22 billion in 2025 with a robust Compound Annual Growth Rate (CAGR) of 12.8% through 2033. This impressive growth is fueled by a confluence of escalating cancer incidence worldwide, advancements in drug development, and increasing healthcare expenditure. The market is witnessing a paradigm shift from traditional chemotherapy towards more targeted and personalized treatment modalities, including targeted therapy and immunotherapy. These innovative approaches offer improved efficacy and reduced side effects, driving their adoption across various cancer types such as blood cancer, breast cancer, gastrointestinal cancer, prostate cancer, and respiratory/lung cancer. The expanding pipeline of novel drugs, coupled with strategic collaborations among leading pharmaceutical giants like Roche, Celgene, Novartis, and Bristol-Myers Squibb, further bolsters market dynamism.
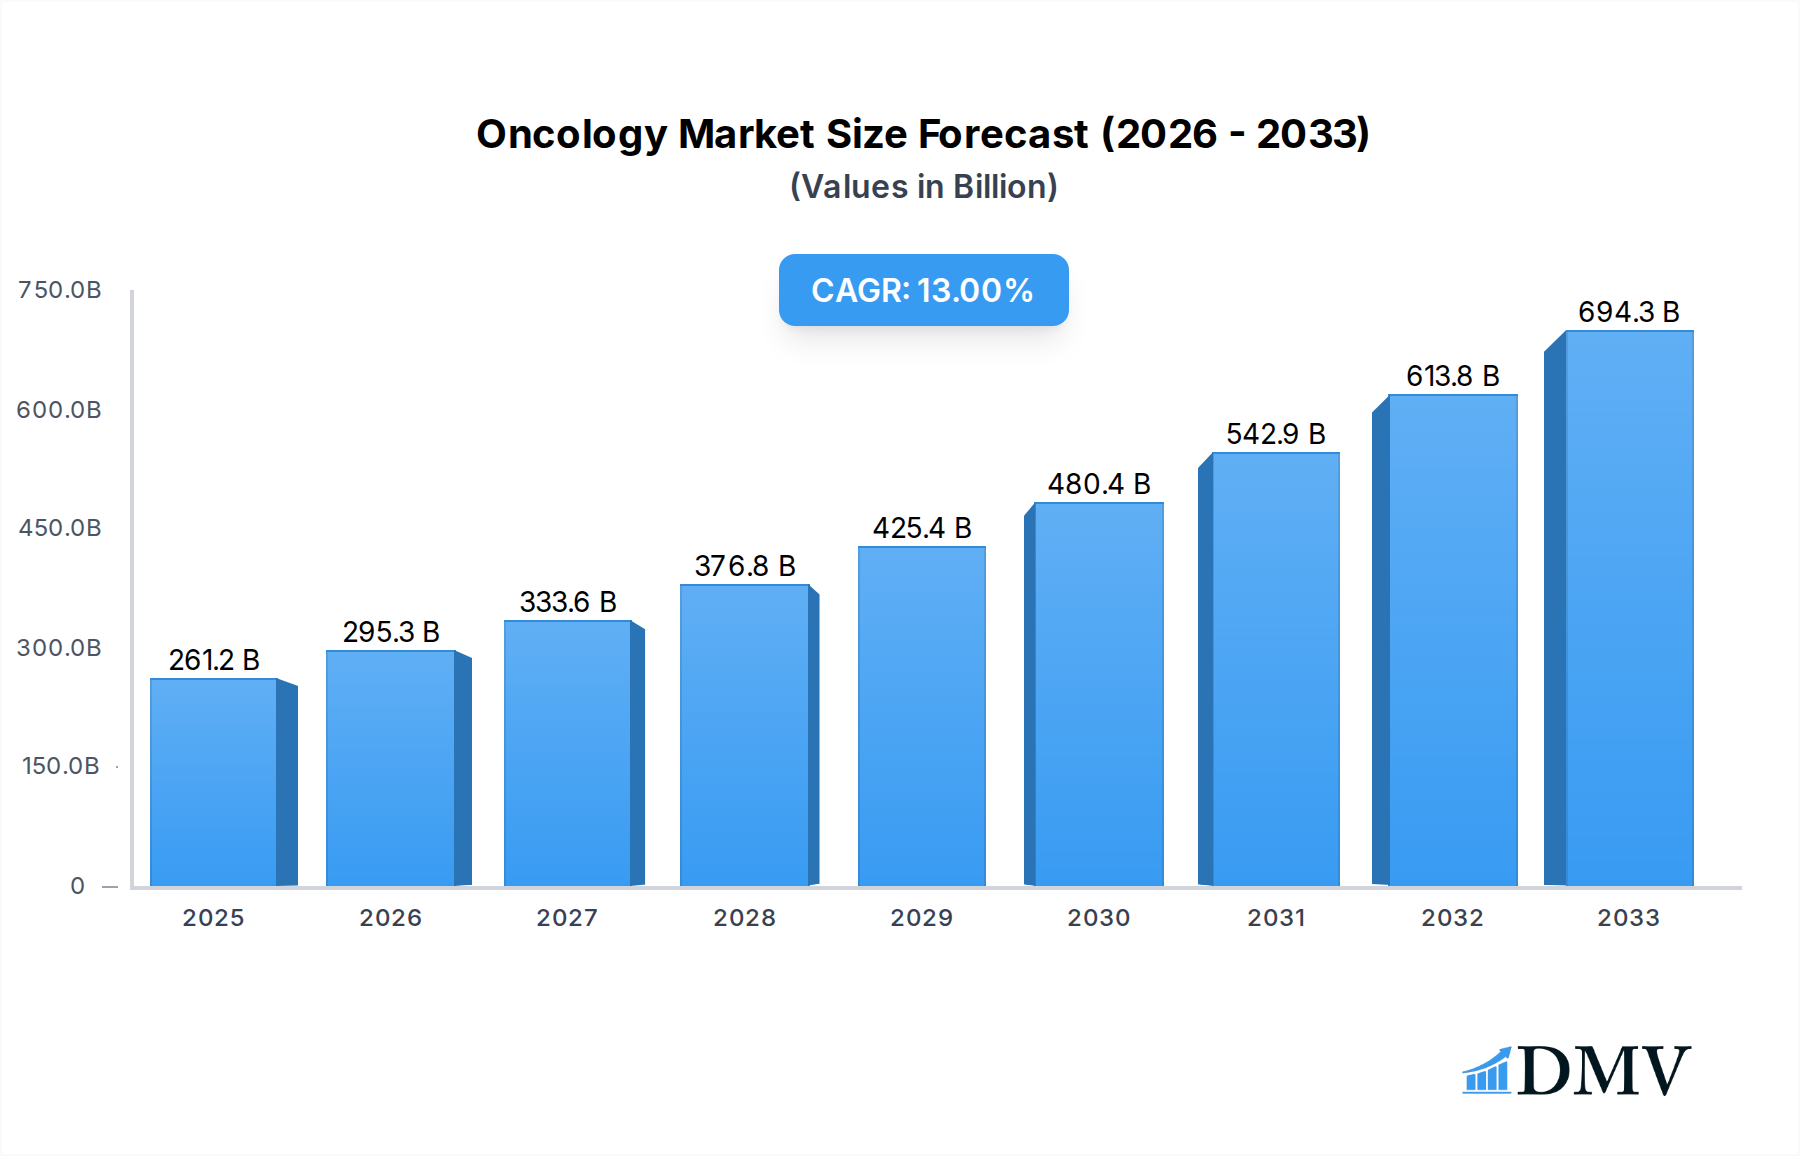
Oncology & Cancer Drugs Market Size (In Billion)
While the oncology drug market exhibits strong growth potential, certain factors could moderate its trajectory. The high cost of novel cancer therapies presents a significant restraint, potentially limiting accessibility for a substantial patient population, particularly in emerging economies. Stringent regulatory approval processes for new drugs also contribute to longer market entry times. Despite these challenges, continuous research and development efforts are focused on addressing unmet medical needs and developing more affordable treatment options. The market is segmented by application and therapy type, with chemotherapy, targeted therapy, and immunotherapy being the dominant segments. Geographically, North America currently leads the market, driven by advanced healthcare infrastructure and high adoption rates of new therapies, followed by Europe. However, the Asia Pacific region is anticipated to witness the fastest growth due to rising disposable incomes, increasing awareness, and improving healthcare access.

Oncology & Cancer Drugs Company Market Share
This in-depth market report delves into the dynamic oncology and cancer drugs market, providing a detailed analysis of its current landscape and future projections. Spanning the historical period of 2019-2024, base year 2025, and a comprehensive forecast period from 2025-2033, this report is your definitive guide to understanding the evolving cancer drug market, oncology therapeutics, and biologic cancer treatments. We examine the strategic imperatives, growth drivers, and emerging opportunities shaping this multi-billion dollar industry, offering critical insights for stakeholders.
The global oncology and cancer drugs market is a highly competitive and innovative sector, projected to reach trillions by 2025 and continue its upward trajectory. This report meticulously examines the market's composition, including concentration levels, innovation catalysts, stringent regulatory landscapes, the impact of substitute products, evolving end-user profiles, and crucial M&A activities within the pharmaceutical industry. Key players like Roche, Celgene, Novartis, Bristol-Myers Squibb, Johnson & Johnson, Merck & Co., AstraZeneca, Pfizer, Amgen, Eli Lilly, and AbbVie are analyzed for their market share distribution and strategic acquisitions. The report quantifies M&A deal values reaching billions, reflecting the intense consolidation and investment in novel cancer therapies. Market concentration is influenced by blockbuster drug pipelines and patent cliffs, driving continuous innovation to secure market leadership.
Oncology & Cancer Drugs Market Composition & Trends
The oncology and cancer drugs market is characterized by a dynamic interplay of innovation, regulatory oversight, and strategic investments. The market concentration is significant, with a few major pharmaceutical giants holding substantial shares, driven by their robust R&D pipelines and established distribution networks. However, the rise of biologics, targeted therapies, and immunotherapies has fostered innovation, creating opportunities for smaller, agile players and driving intense competition. Regulatory bodies like the FDA and EMA play a crucial role in shaping the market through stringent approval processes, accelerated pathways for breakthrough therapies, and post-market surveillance. The threat of substitute products, while present in traditional chemotherapy, is diminishing with the advent of more personalized and effective treatments. End-user profiles are increasingly sophisticated, demanding not only efficacy but also improved quality of life and reduced side effects. Mergers and acquisitions remain a dominant strategy for companies seeking to expand their portfolios, acquire novel technologies, and gain market access. M&A deal values are consistently in the billions, underscoring the strategic importance of consolidating R&D capabilities and market presence.
- Market Share Distribution: Dominant players command significant shares, with continuous shifts driven by pipeline successes and patent expiries.
- Innovation Catalysts: Advances in genomics, molecular biology, and drug delivery systems are accelerating the development of novel cancer treatment drugs.
- Regulatory Landscapes: Strict but evolving regulations ensure drug safety and efficacy while providing pathways for expedited review of life-saving therapies.
- Substitute Products: Emerging advanced cancer therapies are gradually displacing traditional treatments in specific indications.
- End-User Profiles: Patients and healthcare providers demand personalized treatment plans, improved survival rates, and enhanced quality of life.
- M&A Activities: Strategic acquisitions are vital for portfolio expansion, technology integration, and market consolidation, with deal values in the billions.
Oncology & Cancer Drugs Industry Evolution
The oncology and cancer drugs industry has witnessed a profound transformation over the historical period, marked by an accelerating market growth trajectory and groundbreaking technological advancements. From 2019 to 2024, the market experienced robust expansion, driven by an increasing global cancer burden and a surge in the development of sophisticated cancer treatment options. The adoption of targeted therapies and immunotherapies has revolutionized patient care, leading to significantly improved outcomes and survival rates for many cancer types. This shift from broad-spectrum chemotherapy to precision medicine has been fueled by advancements in genetic sequencing and molecular diagnostics, enabling the identification of specific tumor mutations and the development of tailored treatments. Consumer demand has evolved in parallel, with patients and their families actively seeking more effective, less toxic, and often personalized treatment regimens. This evolving demand has spurred pharmaceutical companies to invest heavily in R&D, focusing on therapies that not only extend life but also enhance the quality of life during treatment.
Growth rates in the oncology sector have consistently outpaced the broader pharmaceutical market, with projections indicating sustained double-digit growth in the coming years. The cancer drug market size is projected to reach trillions by 2025, a testament to the sustained innovation and investment in this field. Specific data points, such as the increasing market share of biologics and immunotherapies – now accounting for billions in revenue – highlight this paradigm shift. The adoption metrics for these advanced therapies, measured by patient access and prescription rates, are steadily increasing across various cancer indications, including blood cancer, breast cancer, lung cancer, and prostate cancer. Furthermore, the development of novel drug delivery systems, such as antibody-drug conjugates (ADCs) and innovative vaccine technologies, is further enhancing treatment efficacy and patient compliance. The collaborative efforts between academic research institutions, biotechnology firms, and established pharmaceutical giants have been instrumental in accelerating the translation of scientific discoveries into viable cancer therapeutics. The regulatory landscape, while demanding, has also adapted to facilitate the approval of innovative oncology drugs, further contributing to the industry's evolution. The intricate web of advancements in genomics, immunology, and drug formulation continues to redefine the boundaries of what is possible in cancer treatment, promising a future with more effective and less burdensome therapies.
Leading Regions, Countries, or Segments in Oncology & Cancer Drugs
The global oncology and cancer drugs market exhibits distinct regional leadership and segment dominance, driven by a complex interplay of factors including healthcare infrastructure, R&D investment, regulatory frameworks, and disease prevalence. North America, particularly the United States, consistently emerges as a leading region, fueled by substantial investment in pharmaceutical R&D, a high prevalence of cancer, and advanced healthcare systems that facilitate the adoption of innovative therapies. This dominance is further bolstered by strong government support for medical research and a robust ecosystem of academic institutions and biotechnology firms. Within North America, the breast cancer segment and lung cancer segment are particularly strong, reflecting high incidence rates and significant advancements in treatment.
The immunotherapy (biologic therapy) segment stands out as a dominant type across most leading regions, showcasing its revolutionary impact on cancer treatment. Its efficacy in treating a wide range of cancers, from blood cancer to melanoma, has propelled its growth to billions in market value. This segment's dominance is supported by continuous breakthroughs in understanding the human immune system's interaction with cancer cells and the development of highly specific and potent biologic agents. Targeted therapy is another critical segment experiencing substantial growth, driven by advancements in molecular diagnostics that allow for personalized treatment approaches based on specific genetic mutations within tumors. This has led to significant market share gains in the prostate cancer and gastrointestinal cancer segments, where targeted agents are proving highly effective.
Key drivers for this regional and segmental dominance include:
- Investment Trends: Billions are invested annually in R&D by both private companies and government bodies, particularly in the US, driving innovation in new cancer drugs.
- Regulatory Support: Favorable regulatory pathways, such as accelerated approvals for oncology drugs in the US and Europe, expedite market access for life-saving treatments.
- Disease Prevalence: High incidence rates of specific cancers, like breast cancer and lung cancer, create a substantial patient population and market demand.
- Technological Advancements: Breakthroughs in genomics, proteomics, and drug delivery systems are enabling the development of more effective and targeted therapies, particularly in immunotherapy.
- Healthcare Infrastructure: Well-established healthcare systems with advanced diagnostic capabilities and specialized oncology centers facilitate the widespread adoption of cutting-edge cancer treatments.
The Respiratory/Lung Cancer segment, for instance, has seen explosive growth due to innovative immunotherapies and targeted agents, with market value reaching billions. Similarly, the Blood Cancer segment, encompassing leukemias, lymphomas, and myeloma, benefits from a consistent pipeline of novel therapeutic agents, contributing billions to the overall market. The constant evolution of chemotherapy alongside these novel modalities ensures that the Others application and type categories continue to play a role, albeit with a shifting focus.
Oncology & Cancer Drugs Product Innovations
Recent product innovations in the oncology and cancer drugs market are redefining treatment paradigms and significantly improving patient outcomes. These advancements are primarily focused on developing more targeted therapies, potent immunotherapies, and novel drug delivery mechanisms. For example, the development of next-generation checkpoint inhibitors has expanded the efficacy of immunotherapy (biologic therapy) to a broader patient population, generating billions in revenue. Furthermore, the rise of antibody-drug conjugates (ADCs) represents a significant leap in targeted therapy, enabling the precise delivery of cytotoxic agents directly to cancer cells, thereby minimizing systemic toxicity and improving patient response rates. Performance metrics for these new agents, such as objective response rates and progression-free survival, are consistently demonstrating substantial improvements over existing treatments, driving their adoption and market penetration into the billions.
Propelling Factors for Oncology & Cancer Drugs Growth
The oncology and cancer drugs market is propelled by a confluence of powerful forces driving its continuous expansion. Technologically, breakthroughs in genomics and molecular diagnostics have unlocked the potential for highly personalized and targeted therapies, moving beyond traditional chemotherapy to immunotherapy and targeted therapy. Economic factors, including increasing healthcare expenditure globally and robust investment in pharmaceutical R&D, are fueling the development of novel cancer treatment drugs. Regulatory support, characterized by expedited approval pathways for life-saving oncology drugs and favorable reimbursement policies in key markets, significantly accelerates market access and adoption. The growing global cancer burden, coupled with an aging population, further amplifies the demand for effective cancer therapeutics. Innovations in drug delivery systems and a better understanding of tumor biology are also critical, leading to improved efficacy and reduced side effects for patients.
Obstacles in the Oncology & Cancer Drugs Market
Despite the robust growth, the oncology and cancer drugs market faces significant obstacles. Regulatory challenges remain a constant, with stringent approval processes and post-market surveillance adding to the time and cost of bringing new therapies to market, impacting potential billions in early revenue. Supply chain disruptions, exacerbated by global events, can impact the availability of crucial raw materials and finished drug products, leading to patient access issues and revenue losses. High drug development costs and the lengthy timelines associated with clinical trials necessitate substantial upfront investment, posing a barrier for smaller companies and increasing the overall cost of cancer drugs. Intense competitive pressures, particularly with the advent of biosimilars and the ongoing race for market exclusivity, also necessitate continuous innovation and strategic market positioning to maintain revenue streams in the billions.
Future Opportunities in Oncology & Cancer Drugs
The future of the oncology and cancer drugs market is brimming with opportunities, promising further expansion into the trillions. Emerging markets, particularly in Asia-Pacific and Latin America, present significant untapped potential due to growing healthcare access and increasing cancer incidence. Technological advancements in areas like artificial intelligence (AI) for drug discovery and development, liquid biopsies for early detection, and advanced combination therapies offer avenues for novel treatment strategies and improved patient outcomes. Personalized medicine, driven by advancements in targeted therapy and immunotherapy, will continue to dominate, creating opportunities for companion diagnostics and bespoke treatment regimens. Furthermore, the increasing focus on survivorship and palliative care in oncology opens up new avenues for supportive care drugs and technologies, adding to the overall market value.
Major Players in the Oncology & Cancer Drugs Ecosystem
- Roche
- Celgene
- Novartis
- Bristol-Myers Squibb
- Johnson & Johnson
- Merck & Co.
- AstraZeneca
- Pfizer
- Amgen
- Eli Lilly
- AbbVie
- Takeda
- Astellas
- Ipsen
- Sanofi
- Bayer
- Biogen Idec
- Teva
- Otsuka
- Eisai
- Merck KGaA
- Gilead Sciences
Key Developments in Oncology & Cancer Drugs Industry
- 2024: Launch of novel CAR-T therapy for relapsed/refractory B-cell lymphomas, expanding blood cancer treatment options and contributing billions to the market.
- 2023: Major pharmaceutical company announces breakthrough in early detection of prostate cancer using liquid biopsy technology.
- 2023: FDA approves new immunotherapy for previously untreatable lung cancer, marking a significant advance in respiratory/lung cancer treatment.
- 2022: Acquisition of a biotechnology firm specializing in targeted therapy by a leading pharmaceutical giant, signaling continued consolidation in the cancer drug market.
- 2021: Significant advancements in mRNA vaccine technology show promise for cancer vaccines, opening a new frontier in oncology.
- 2020: Expansion of approval for a blockbuster breast cancer drug to include earlier stages of the disease, boosting its market reach into billions.
- 2019: Introduction of a novel combination therapy for gastrointestinal cancer, demonstrating superior efficacy and survival benefits.
Strategic Oncology & Cancer Drugs Market Forecast
The oncology and cancer drugs market is poised for sustained, robust growth, driven by relentless innovation and expanding global access to advanced cancer treatments. The forecast period from 2025 to 2033 anticipates continued acceleration, with immunotherapies, targeted therapies, and novel biologic therapies leading the charge. Investments in R&D will remain a critical catalyst, focusing on overcoming resistance mechanisms and improving treatment outcomes for a wider range of cancers, including blood cancer, breast cancer, gastrointestinal cancer, prostate cancer, and respiratory/lung cancer. The increasing demand for personalized medicine and the expansion into emerging markets will further contribute to the market's multi-trillion dollar potential, underscoring the immense opportunities for stakeholders to contribute to and benefit from advancements in cancer therapeutics.
Oncology & Cancer Drugs Segmentation
-
1. Application
- 1.1. Blood Cancer
- 1.2. Breast Cancer
- 1.3. Gastrointestinal Cancer
- 1.4. Prostate Cancer
- 1.5. Respiratory/Lung Cancer
- 1.6. Others
-
2. Types
- 2.1. Chemotherapy
- 2.2. Targeted Therapy
- 2.3. Immunotherapy (Biologic Therapy)
- 2.4. Hormonal Therapy
- 2.5. Others
Oncology & Cancer Drugs Segmentation By Geography
-
1. North America
- 1.1. United States
- 1.2. Canada
- 1.3. Mexico
-
2. South America
- 2.1. Brazil
- 2.2. Argentina
- 2.3. Rest of South America
-
3. Europe
- 3.1. United Kingdom
- 3.2. Germany
- 3.3. France
- 3.4. Italy
- 3.5. Spain
- 3.6. Russia
- 3.7. Benelux
- 3.8. Nordics
- 3.9. Rest of Europe
-
4. Middle East & Africa
- 4.1. Turkey
- 4.2. Israel
- 4.3. GCC
- 4.4. North Africa
- 4.5. South Africa
- 4.6. Rest of Middle East & Africa
-
5. Asia Pacific
- 5.1. China
- 5.2. India
- 5.3. Japan
- 5.4. South Korea
- 5.5. ASEAN
- 5.6. Oceania
- 5.7. Rest of Asia Pacific

Oncology & Cancer Drugs Regional Market Share
Geographic Coverage of Oncology & Cancer Drugs
Oncology & Cancer Drugs REPORT HIGHLIGHTS
| Aspects | Details |
|---|---|
| Study Period | 2020-2034 |
| Base Year | 2025 |
| Estimated Year | 2026 |
| Forecast Period | 2026-2034 |
| Historical Period | 2020-2025 |
| Growth Rate | CAGR of 12.8% from 2020-2034 |
| Segmentation |
|
Table of Contents
- 1. Introduction
- 1.1. Research Scope
- 1.2. Market Segmentation
- 1.3. Research Methodology
- 1.4. Definitions and Assumptions
- 2. Executive Summary
- 2.1. Introduction
- 3. Market Dynamics
- 3.1. Introduction
- 3.2. Market Drivers
- 3.3. Market Restrains
- 3.4. Market Trends
- 4. Market Factor Analysis
- 4.1. Porters Five Forces
- 4.2. Supply/Value Chain
- 4.3. PESTEL analysis
- 4.4. Market Entropy
- 4.5. Patent/Trademark Analysis
- 5. Global Oncology & Cancer Drugs Analysis, Insights and Forecast, 2020-2032
- 5.1. Market Analysis, Insights and Forecast - by Application
- 5.1.1. Blood Cancer
- 5.1.2. Breast Cancer
- 5.1.3. Gastrointestinal Cancer
- 5.1.4. Prostate Cancer
- 5.1.5. Respiratory/Lung Cancer
- 5.1.6. Others
- 5.2. Market Analysis, Insights and Forecast - by Types
- 5.2.1. Chemotherapy
- 5.2.2. Targeted Therapy
- 5.2.3. Immunotherapy (Biologic Therapy)
- 5.2.4. Hormonal Therapy
- 5.2.5. Others
- 5.3. Market Analysis, Insights and Forecast - by Region
- 5.3.1. North America
- 5.3.2. South America
- 5.3.3. Europe
- 5.3.4. Middle East & Africa
- 5.3.5. Asia Pacific
- 5.1. Market Analysis, Insights and Forecast - by Application
- 6. North America Oncology & Cancer Drugs Analysis, Insights and Forecast, 2020-2032
- 6.1. Market Analysis, Insights and Forecast - by Application
- 6.1.1. Blood Cancer
- 6.1.2. Breast Cancer
- 6.1.3. Gastrointestinal Cancer
- 6.1.4. Prostate Cancer
- 6.1.5. Respiratory/Lung Cancer
- 6.1.6. Others
- 6.2. Market Analysis, Insights and Forecast - by Types
- 6.2.1. Chemotherapy
- 6.2.2. Targeted Therapy
- 6.2.3. Immunotherapy (Biologic Therapy)
- 6.2.4. Hormonal Therapy
- 6.2.5. Others
- 6.1. Market Analysis, Insights and Forecast - by Application
- 7. South America Oncology & Cancer Drugs Analysis, Insights and Forecast, 2020-2032
- 7.1. Market Analysis, Insights and Forecast - by Application
- 7.1.1. Blood Cancer
- 7.1.2. Breast Cancer
- 7.1.3. Gastrointestinal Cancer
- 7.1.4. Prostate Cancer
- 7.1.5. Respiratory/Lung Cancer
- 7.1.6. Others
- 7.2. Market Analysis, Insights and Forecast - by Types
- 7.2.1. Chemotherapy
- 7.2.2. Targeted Therapy
- 7.2.3. Immunotherapy (Biologic Therapy)
- 7.2.4. Hormonal Therapy
- 7.2.5. Others
- 7.1. Market Analysis, Insights and Forecast - by Application
- 8. Europe Oncology & Cancer Drugs Analysis, Insights and Forecast, 2020-2032
- 8.1. Market Analysis, Insights and Forecast - by Application
- 8.1.1. Blood Cancer
- 8.1.2. Breast Cancer
- 8.1.3. Gastrointestinal Cancer
- 8.1.4. Prostate Cancer
- 8.1.5. Respiratory/Lung Cancer
- 8.1.6. Others
- 8.2. Market Analysis, Insights and Forecast - by Types
- 8.2.1. Chemotherapy
- 8.2.2. Targeted Therapy
- 8.2.3. Immunotherapy (Biologic Therapy)
- 8.2.4. Hormonal Therapy
- 8.2.5. Others
- 8.1. Market Analysis, Insights and Forecast - by Application
- 9. Middle East & Africa Oncology & Cancer Drugs Analysis, Insights and Forecast, 2020-2032
- 9.1. Market Analysis, Insights and Forecast - by Application
- 9.1.1. Blood Cancer
- 9.1.2. Breast Cancer
- 9.1.3. Gastrointestinal Cancer
- 9.1.4. Prostate Cancer
- 9.1.5. Respiratory/Lung Cancer
- 9.1.6. Others
- 9.2. Market Analysis, Insights and Forecast - by Types
- 9.2.1. Chemotherapy
- 9.2.2. Targeted Therapy
- 9.2.3. Immunotherapy (Biologic Therapy)
- 9.2.4. Hormonal Therapy
- 9.2.5. Others
- 9.1. Market Analysis, Insights and Forecast - by Application
- 10. Asia Pacific Oncology & Cancer Drugs Analysis, Insights and Forecast, 2020-2032
- 10.1. Market Analysis, Insights and Forecast - by Application
- 10.1.1. Blood Cancer
- 10.1.2. Breast Cancer
- 10.1.3. Gastrointestinal Cancer
- 10.1.4. Prostate Cancer
- 10.1.5. Respiratory/Lung Cancer
- 10.1.6. Others
- 10.2. Market Analysis, Insights and Forecast - by Types
- 10.2.1. Chemotherapy
- 10.2.2. Targeted Therapy
- 10.2.3. Immunotherapy (Biologic Therapy)
- 10.2.4. Hormonal Therapy
- 10.2.5. Others
- 10.1. Market Analysis, Insights and Forecast - by Application
- 11. Competitive Analysis
- 11.1. Global Market Share Analysis 2025
- 11.2. Company Profiles
- 11.2.1 Roche
- 11.2.1.1. Overview
- 11.2.1.2. Products
- 11.2.1.3. SWOT Analysis
- 11.2.1.4. Recent Developments
- 11.2.1.5. Financials (Based on Availability)
- 11.2.2 Celgene
- 11.2.2.1. Overview
- 11.2.2.2. Products
- 11.2.2.3. SWOT Analysis
- 11.2.2.4. Recent Developments
- 11.2.2.5. Financials (Based on Availability)
- 11.2.3 Novartis
- 11.2.3.1. Overview
- 11.2.3.2. Products
- 11.2.3.3. SWOT Analysis
- 11.2.3.4. Recent Developments
- 11.2.3.5. Financials (Based on Availability)
- 11.2.4 Bristol-Myers Squibb
- 11.2.4.1. Overview
- 11.2.4.2. Products
- 11.2.4.3. SWOT Analysis
- 11.2.4.4. Recent Developments
- 11.2.4.5. Financials (Based on Availability)
- 11.2.5 Johnson & Johnson
- 11.2.5.1. Overview
- 11.2.5.2. Products
- 11.2.5.3. SWOT Analysis
- 11.2.5.4. Recent Developments
- 11.2.5.5. Financials (Based on Availability)
- 11.2.6 Merck & Co.
- 11.2.6.1. Overview
- 11.2.6.2. Products
- 11.2.6.3. SWOT Analysis
- 11.2.6.4. Recent Developments
- 11.2.6.5. Financials (Based on Availability)
- 11.2.7 AstraZeneca
- 11.2.7.1. Overview
- 11.2.7.2. Products
- 11.2.7.3. SWOT Analysis
- 11.2.7.4. Recent Developments
- 11.2.7.5. Financials (Based on Availability)
- 11.2.8 Pfizer
- 11.2.8.1. Overview
- 11.2.8.2. Products
- 11.2.8.3. SWOT Analysis
- 11.2.8.4. Recent Developments
- 11.2.8.5. Financials (Based on Availability)
- 11.2.9 Amgen
- 11.2.9.1. Overview
- 11.2.9.2. Products
- 11.2.9.3. SWOT Analysis
- 11.2.9.4. Recent Developments
- 11.2.9.5. Financials (Based on Availability)
- 11.2.10 Eli Lilly
- 11.2.10.1. Overview
- 11.2.10.2. Products
- 11.2.10.3. SWOT Analysis
- 11.2.10.4. Recent Developments
- 11.2.10.5. Financials (Based on Availability)
- 11.2.11 AbbVie
- 11.2.11.1. Overview
- 11.2.11.2. Products
- 11.2.11.3. SWOT Analysis
- 11.2.11.4. Recent Developments
- 11.2.11.5. Financials (Based on Availability)
- 11.2.12 Takeda
- 11.2.12.1. Overview
- 11.2.12.2. Products
- 11.2.12.3. SWOT Analysis
- 11.2.12.4. Recent Developments
- 11.2.12.5. Financials (Based on Availability)
- 11.2.13 Astellas
- 11.2.13.1. Overview
- 11.2.13.2. Products
- 11.2.13.3. SWOT Analysis
- 11.2.13.4. Recent Developments
- 11.2.13.5. Financials (Based on Availability)
- 11.2.14 Ipsen
- 11.2.14.1. Overview
- 11.2.14.2. Products
- 11.2.14.3. SWOT Analysis
- 11.2.14.4. Recent Developments
- 11.2.14.5. Financials (Based on Availability)
- 11.2.15 Sanofi
- 11.2.15.1. Overview
- 11.2.15.2. Products
- 11.2.15.3. SWOT Analysis
- 11.2.15.4. Recent Developments
- 11.2.15.5. Financials (Based on Availability)
- 11.2.16 Bayer
- 11.2.16.1. Overview
- 11.2.16.2. Products
- 11.2.16.3. SWOT Analysis
- 11.2.16.4. Recent Developments
- 11.2.16.5. Financials (Based on Availability)
- 11.2.17 Biogen Idec
- 11.2.17.1. Overview
- 11.2.17.2. Products
- 11.2.17.3. SWOT Analysis
- 11.2.17.4. Recent Developments
- 11.2.17.5. Financials (Based on Availability)
- 11.2.18 Teva
- 11.2.18.1. Overview
- 11.2.18.2. Products
- 11.2.18.3. SWOT Analysis
- 11.2.18.4. Recent Developments
- 11.2.18.5. Financials (Based on Availability)
- 11.2.19 Otsuka
- 11.2.19.1. Overview
- 11.2.19.2. Products
- 11.2.19.3. SWOT Analysis
- 11.2.19.4. Recent Developments
- 11.2.19.5. Financials (Based on Availability)
- 11.2.20 Eisai
- 11.2.20.1. Overview
- 11.2.20.2. Products
- 11.2.20.3. SWOT Analysis
- 11.2.20.4. Recent Developments
- 11.2.20.5. Financials (Based on Availability)
- 11.2.21 Merck KGaA
- 11.2.21.1. Overview
- 11.2.21.2. Products
- 11.2.21.3. SWOT Analysis
- 11.2.21.4. Recent Developments
- 11.2.21.5. Financials (Based on Availability)
- 11.2.22 Gilead Sciences
- 11.2.22.1. Overview
- 11.2.22.2. Products
- 11.2.22.3. SWOT Analysis
- 11.2.22.4. Recent Developments
- 11.2.22.5. Financials (Based on Availability)
- 11.2.1 Roche
List of Figures
- Figure 1: Global Oncology & Cancer Drugs Revenue Breakdown (undefined, %) by Region 2025 & 2033
- Figure 2: Global Oncology & Cancer Drugs Volume Breakdown (K, %) by Region 2025 & 2033
- Figure 3: North America Oncology & Cancer Drugs Revenue (undefined), by Application 2025 & 2033
- Figure 4: North America Oncology & Cancer Drugs Volume (K), by Application 2025 & 2033
- Figure 5: North America Oncology & Cancer Drugs Revenue Share (%), by Application 2025 & 2033
- Figure 6: North America Oncology & Cancer Drugs Volume Share (%), by Application 2025 & 2033
- Figure 7: North America Oncology & Cancer Drugs Revenue (undefined), by Types 2025 & 2033
- Figure 8: North America Oncology & Cancer Drugs Volume (K), by Types 2025 & 2033
- Figure 9: North America Oncology & Cancer Drugs Revenue Share (%), by Types 2025 & 2033
- Figure 10: North America Oncology & Cancer Drugs Volume Share (%), by Types 2025 & 2033
- Figure 11: North America Oncology & Cancer Drugs Revenue (undefined), by Country 2025 & 2033
- Figure 12: North America Oncology & Cancer Drugs Volume (K), by Country 2025 & 2033
- Figure 13: North America Oncology & Cancer Drugs Revenue Share (%), by Country 2025 & 2033
- Figure 14: North America Oncology & Cancer Drugs Volume Share (%), by Country 2025 & 2033
- Figure 15: South America Oncology & Cancer Drugs Revenue (undefined), by Application 2025 & 2033
- Figure 16: South America Oncology & Cancer Drugs Volume (K), by Application 2025 & 2033
- Figure 17: South America Oncology & Cancer Drugs Revenue Share (%), by Application 2025 & 2033
- Figure 18: South America Oncology & Cancer Drugs Volume Share (%), by Application 2025 & 2033
- Figure 19: South America Oncology & Cancer Drugs Revenue (undefined), by Types 2025 & 2033
- Figure 20: South America Oncology & Cancer Drugs Volume (K), by Types 2025 & 2033
- Figure 21: South America Oncology & Cancer Drugs Revenue Share (%), by Types 2025 & 2033
- Figure 22: South America Oncology & Cancer Drugs Volume Share (%), by Types 2025 & 2033
- Figure 23: South America Oncology & Cancer Drugs Revenue (undefined), by Country 2025 & 2033
- Figure 24: South America Oncology & Cancer Drugs Volume (K), by Country 2025 & 2033
- Figure 25: South America Oncology & Cancer Drugs Revenue Share (%), by Country 2025 & 2033
- Figure 26: South America Oncology & Cancer Drugs Volume Share (%), by Country 2025 & 2033
- Figure 27: Europe Oncology & Cancer Drugs Revenue (undefined), by Application 2025 & 2033
- Figure 28: Europe Oncology & Cancer Drugs Volume (K), by Application 2025 & 2033
- Figure 29: Europe Oncology & Cancer Drugs Revenue Share (%), by Application 2025 & 2033
- Figure 30: Europe Oncology & Cancer Drugs Volume Share (%), by Application 2025 & 2033
- Figure 31: Europe Oncology & Cancer Drugs Revenue (undefined), by Types 2025 & 2033
- Figure 32: Europe Oncology & Cancer Drugs Volume (K), by Types 2025 & 2033
- Figure 33: Europe Oncology & Cancer Drugs Revenue Share (%), by Types 2025 & 2033
- Figure 34: Europe Oncology & Cancer Drugs Volume Share (%), by Types 2025 & 2033
- Figure 35: Europe Oncology & Cancer Drugs Revenue (undefined), by Country 2025 & 2033
- Figure 36: Europe Oncology & Cancer Drugs Volume (K), by Country 2025 & 2033
- Figure 37: Europe Oncology & Cancer Drugs Revenue Share (%), by Country 2025 & 2033
- Figure 38: Europe Oncology & Cancer Drugs Volume Share (%), by Country 2025 & 2033
- Figure 39: Middle East & Africa Oncology & Cancer Drugs Revenue (undefined), by Application 2025 & 2033
- Figure 40: Middle East & Africa Oncology & Cancer Drugs Volume (K), by Application 2025 & 2033
- Figure 41: Middle East & Africa Oncology & Cancer Drugs Revenue Share (%), by Application 2025 & 2033
- Figure 42: Middle East & Africa Oncology & Cancer Drugs Volume Share (%), by Application 2025 & 2033
- Figure 43: Middle East & Africa Oncology & Cancer Drugs Revenue (undefined), by Types 2025 & 2033
- Figure 44: Middle East & Africa Oncology & Cancer Drugs Volume (K), by Types 2025 & 2033
- Figure 45: Middle East & Africa Oncology & Cancer Drugs Revenue Share (%), by Types 2025 & 2033
- Figure 46: Middle East & Africa Oncology & Cancer Drugs Volume Share (%), by Types 2025 & 2033
- Figure 47: Middle East & Africa Oncology & Cancer Drugs Revenue (undefined), by Country 2025 & 2033
- Figure 48: Middle East & Africa Oncology & Cancer Drugs Volume (K), by Country 2025 & 2033
- Figure 49: Middle East & Africa Oncology & Cancer Drugs Revenue Share (%), by Country 2025 & 2033
- Figure 50: Middle East & Africa Oncology & Cancer Drugs Volume Share (%), by Country 2025 & 2033
- Figure 51: Asia Pacific Oncology & Cancer Drugs Revenue (undefined), by Application 2025 & 2033
- Figure 52: Asia Pacific Oncology & Cancer Drugs Volume (K), by Application 2025 & 2033
- Figure 53: Asia Pacific Oncology & Cancer Drugs Revenue Share (%), by Application 2025 & 2033
- Figure 54: Asia Pacific Oncology & Cancer Drugs Volume Share (%), by Application 2025 & 2033
- Figure 55: Asia Pacific Oncology & Cancer Drugs Revenue (undefined), by Types 2025 & 2033
- Figure 56: Asia Pacific Oncology & Cancer Drugs Volume (K), by Types 2025 & 2033
- Figure 57: Asia Pacific Oncology & Cancer Drugs Revenue Share (%), by Types 2025 & 2033
- Figure 58: Asia Pacific Oncology & Cancer Drugs Volume Share (%), by Types 2025 & 2033
- Figure 59: Asia Pacific Oncology & Cancer Drugs Revenue (undefined), by Country 2025 & 2033
- Figure 60: Asia Pacific Oncology & Cancer Drugs Volume (K), by Country 2025 & 2033
- Figure 61: Asia Pacific Oncology & Cancer Drugs Revenue Share (%), by Country 2025 & 2033
- Figure 62: Asia Pacific Oncology & Cancer Drugs Volume Share (%), by Country 2025 & 2033
List of Tables
- Table 1: Global Oncology & Cancer Drugs Revenue undefined Forecast, by Application 2020 & 2033
- Table 2: Global Oncology & Cancer Drugs Volume K Forecast, by Application 2020 & 2033
- Table 3: Global Oncology & Cancer Drugs Revenue undefined Forecast, by Types 2020 & 2033
- Table 4: Global Oncology & Cancer Drugs Volume K Forecast, by Types 2020 & 2033
- Table 5: Global Oncology & Cancer Drugs Revenue undefined Forecast, by Region 2020 & 2033
- Table 6: Global Oncology & Cancer Drugs Volume K Forecast, by Region 2020 & 2033
- Table 7: Global Oncology & Cancer Drugs Revenue undefined Forecast, by Application 2020 & 2033
- Table 8: Global Oncology & Cancer Drugs Volume K Forecast, by Application 2020 & 2033
- Table 9: Global Oncology & Cancer Drugs Revenue undefined Forecast, by Types 2020 & 2033
- Table 10: Global Oncology & Cancer Drugs Volume K Forecast, by Types 2020 & 2033
- Table 11: Global Oncology & Cancer Drugs Revenue undefined Forecast, by Country 2020 & 2033
- Table 12: Global Oncology & Cancer Drugs Volume K Forecast, by Country 2020 & 2033
- Table 13: United States Oncology & Cancer Drugs Revenue (undefined) Forecast, by Application 2020 & 2033
- Table 14: United States Oncology & Cancer Drugs Volume (K) Forecast, by Application 2020 & 2033
- Table 15: Canada Oncology & Cancer Drugs Revenue (undefined) Forecast, by Application 2020 & 2033
- Table 16: Canada Oncology & Cancer Drugs Volume (K) Forecast, by Application 2020 & 2033
- Table 17: Mexico Oncology & Cancer Drugs Revenue (undefined) Forecast, by Application 2020 & 2033
- Table 18: Mexico Oncology & Cancer Drugs Volume (K) Forecast, by Application 2020 & 2033
- Table 19: Global Oncology & Cancer Drugs Revenue undefined Forecast, by Application 2020 & 2033
- Table 20: Global Oncology & Cancer Drugs Volume K Forecast, by Application 2020 & 2033
- Table 21: Global Oncology & Cancer Drugs Revenue undefined Forecast, by Types 2020 & 2033
- Table 22: Global Oncology & Cancer Drugs Volume K Forecast, by Types 2020 & 2033
- Table 23: Global Oncology & Cancer Drugs Revenue undefined Forecast, by Country 2020 & 2033
- Table 24: Global Oncology & Cancer Drugs Volume K Forecast, by Country 2020 & 2033
- Table 25: Brazil Oncology & Cancer Drugs Revenue (undefined) Forecast, by Application 2020 & 2033
- Table 26: Brazil Oncology & Cancer Drugs Volume (K) Forecast, by Application 2020 & 2033
- Table 27: Argentina Oncology & Cancer Drugs Revenue (undefined) Forecast, by Application 2020 & 2033
- Table 28: Argentina Oncology & Cancer Drugs Volume (K) Forecast, by Application 2020 & 2033
- Table 29: Rest of South America Oncology & Cancer Drugs Revenue (undefined) Forecast, by Application 2020 & 2033
- Table 30: Rest of South America Oncology & Cancer Drugs Volume (K) Forecast, by Application 2020 & 2033
- Table 31: Global Oncology & Cancer Drugs Revenue undefined Forecast, by Application 2020 & 2033
- Table 32: Global Oncology & Cancer Drugs Volume K Forecast, by Application 2020 & 2033
- Table 33: Global Oncology & Cancer Drugs Revenue undefined Forecast, by Types 2020 & 2033
- Table 34: Global Oncology & Cancer Drugs Volume K Forecast, by Types 2020 & 2033
- Table 35: Global Oncology & Cancer Drugs Revenue undefined Forecast, by Country 2020 & 2033
- Table 36: Global Oncology & Cancer Drugs Volume K Forecast, by Country 2020 & 2033
- Table 37: United Kingdom Oncology & Cancer Drugs Revenue (undefined) Forecast, by Application 2020 & 2033
- Table 38: United Kingdom Oncology & Cancer Drugs Volume (K) Forecast, by Application 2020 & 2033
- Table 39: Germany Oncology & Cancer Drugs Revenue (undefined) Forecast, by Application 2020 & 2033
- Table 40: Germany Oncology & Cancer Drugs Volume (K) Forecast, by Application 2020 & 2033
- Table 41: France Oncology & Cancer Drugs Revenue (undefined) Forecast, by Application 2020 & 2033
- Table 42: France Oncology & Cancer Drugs Volume (K) Forecast, by Application 2020 & 2033
- Table 43: Italy Oncology & Cancer Drugs Revenue (undefined) Forecast, by Application 2020 & 2033
- Table 44: Italy Oncology & Cancer Drugs Volume (K) Forecast, by Application 2020 & 2033
- Table 45: Spain Oncology & Cancer Drugs Revenue (undefined) Forecast, by Application 2020 & 2033
- Table 46: Spain Oncology & Cancer Drugs Volume (K) Forecast, by Application 2020 & 2033
- Table 47: Russia Oncology & Cancer Drugs Revenue (undefined) Forecast, by Application 2020 & 2033
- Table 48: Russia Oncology & Cancer Drugs Volume (K) Forecast, by Application 2020 & 2033
- Table 49: Benelux Oncology & Cancer Drugs Revenue (undefined) Forecast, by Application 2020 & 2033
- Table 50: Benelux Oncology & Cancer Drugs Volume (K) Forecast, by Application 2020 & 2033
- Table 51: Nordics Oncology & Cancer Drugs Revenue (undefined) Forecast, by Application 2020 & 2033
- Table 52: Nordics Oncology & Cancer Drugs Volume (K) Forecast, by Application 2020 & 2033
- Table 53: Rest of Europe Oncology & Cancer Drugs Revenue (undefined) Forecast, by Application 2020 & 2033
- Table 54: Rest of Europe Oncology & Cancer Drugs Volume (K) Forecast, by Application 2020 & 2033
- Table 55: Global Oncology & Cancer Drugs Revenue undefined Forecast, by Application 2020 & 2033
- Table 56: Global Oncology & Cancer Drugs Volume K Forecast, by Application 2020 & 2033
- Table 57: Global Oncology & Cancer Drugs Revenue undefined Forecast, by Types 2020 & 2033
- Table 58: Global Oncology & Cancer Drugs Volume K Forecast, by Types 2020 & 2033
- Table 59: Global Oncology & Cancer Drugs Revenue undefined Forecast, by Country 2020 & 2033
- Table 60: Global Oncology & Cancer Drugs Volume K Forecast, by Country 2020 & 2033
- Table 61: Turkey Oncology & Cancer Drugs Revenue (undefined) Forecast, by Application 2020 & 2033
- Table 62: Turkey Oncology & Cancer Drugs Volume (K) Forecast, by Application 2020 & 2033
- Table 63: Israel Oncology & Cancer Drugs Revenue (undefined) Forecast, by Application 2020 & 2033
- Table 64: Israel Oncology & Cancer Drugs Volume (K) Forecast, by Application 2020 & 2033
- Table 65: GCC Oncology & Cancer Drugs Revenue (undefined) Forecast, by Application 2020 & 2033
- Table 66: GCC Oncology & Cancer Drugs Volume (K) Forecast, by Application 2020 & 2033
- Table 67: North Africa Oncology & Cancer Drugs Revenue (undefined) Forecast, by Application 2020 & 2033
- Table 68: North Africa Oncology & Cancer Drugs Volume (K) Forecast, by Application 2020 & 2033
- Table 69: South Africa Oncology & Cancer Drugs Revenue (undefined) Forecast, by Application 2020 & 2033
- Table 70: South Africa Oncology & Cancer Drugs Volume (K) Forecast, by Application 2020 & 2033
- Table 71: Rest of Middle East & Africa Oncology & Cancer Drugs Revenue (undefined) Forecast, by Application 2020 & 2033
- Table 72: Rest of Middle East & Africa Oncology & Cancer Drugs Volume (K) Forecast, by Application 2020 & 2033
- Table 73: Global Oncology & Cancer Drugs Revenue undefined Forecast, by Application 2020 & 2033
- Table 74: Global Oncology & Cancer Drugs Volume K Forecast, by Application 2020 & 2033
- Table 75: Global Oncology & Cancer Drugs Revenue undefined Forecast, by Types 2020 & 2033
- Table 76: Global Oncology & Cancer Drugs Volume K Forecast, by Types 2020 & 2033
- Table 77: Global Oncology & Cancer Drugs Revenue undefined Forecast, by Country 2020 & 2033
- Table 78: Global Oncology & Cancer Drugs Volume K Forecast, by Country 2020 & 2033
- Table 79: China Oncology & Cancer Drugs Revenue (undefined) Forecast, by Application 2020 & 2033
- Table 80: China Oncology & Cancer Drugs Volume (K) Forecast, by Application 2020 & 2033
- Table 81: India Oncology & Cancer Drugs Revenue (undefined) Forecast, by Application 2020 & 2033
- Table 82: India Oncology & Cancer Drugs Volume (K) Forecast, by Application 2020 & 2033
- Table 83: Japan Oncology & Cancer Drugs Revenue (undefined) Forecast, by Application 2020 & 2033
- Table 84: Japan Oncology & Cancer Drugs Volume (K) Forecast, by Application 2020 & 2033
- Table 85: South Korea Oncology & Cancer Drugs Revenue (undefined) Forecast, by Application 2020 & 2033
- Table 86: South Korea Oncology & Cancer Drugs Volume (K) Forecast, by Application 2020 & 2033
- Table 87: ASEAN Oncology & Cancer Drugs Revenue (undefined) Forecast, by Application 2020 & 2033
- Table 88: ASEAN Oncology & Cancer Drugs Volume (K) Forecast, by Application 2020 & 2033
- Table 89: Oceania Oncology & Cancer Drugs Revenue (undefined) Forecast, by Application 2020 & 2033
- Table 90: Oceania Oncology & Cancer Drugs Volume (K) Forecast, by Application 2020 & 2033
- Table 91: Rest of Asia Pacific Oncology & Cancer Drugs Revenue (undefined) Forecast, by Application 2020 & 2033
- Table 92: Rest of Asia Pacific Oncology & Cancer Drugs Volume (K) Forecast, by Application 2020 & 2033
Frequently Asked Questions
1. What is the projected Compound Annual Growth Rate (CAGR) of the Oncology & Cancer Drugs?
The projected CAGR is approximately 12.8%.
2. Which companies are prominent players in the Oncology & Cancer Drugs?
Key companies in the market include Roche, Celgene, Novartis, Bristol-Myers Squibb, Johnson & Johnson, Merck & Co., AstraZeneca, Pfizer, Amgen, Eli Lilly, AbbVie, Takeda, Astellas, Ipsen, Sanofi, Bayer, Biogen Idec, Teva, Otsuka, Eisai, Merck KGaA, Gilead Sciences.
3. What are the main segments of the Oncology & Cancer Drugs?
The market segments include Application, Types.
4. Can you provide details about the market size?
The market size is estimated to be USD XXX N/A as of 2022.
5. What are some drivers contributing to market growth?
N/A
6. What are the notable trends driving market growth?
N/A
7. Are there any restraints impacting market growth?
N/A
8. Can you provide examples of recent developments in the market?
N/A
9. What pricing options are available for accessing the report?
Pricing options include single-user, multi-user, and enterprise licenses priced at USD 3350.00, USD 5025.00, and USD 6700.00 respectively.
10. Is the market size provided in terms of value or volume?
The market size is provided in terms of value, measured in N/A and volume, measured in K.
11. Are there any specific market keywords associated with the report?
Yes, the market keyword associated with the report is "Oncology & Cancer Drugs," which aids in identifying and referencing the specific market segment covered.
12. How do I determine which pricing option suits my needs best?
The pricing options vary based on user requirements and access needs. Individual users may opt for single-user licenses, while businesses requiring broader access may choose multi-user or enterprise licenses for cost-effective access to the report.
13. Are there any additional resources or data provided in the Oncology & Cancer Drugs report?
While the report offers comprehensive insights, it's advisable to review the specific contents or supplementary materials provided to ascertain if additional resources or data are available.
14. How can I stay updated on further developments or reports in the Oncology & Cancer Drugs?
To stay informed about further developments, trends, and reports in the Oncology & Cancer Drugs, consider subscribing to industry newsletters, following relevant companies and organizations, or regularly checking reputable industry news sources and publications.
Methodology
Step 1 - Identification of Relevant Samples Size from Population Database


Step 2 - Approaches for Defining Global Market Size (Value, Volume* & Price*)

Note*: In applicable scenarios
Step 3 - Data Sources
Primary Research
- Web Analytics
- Survey Reports
- Research Institute
- Latest Research Reports
- Opinion Leaders
Secondary Research
- Annual Reports
- White Paper
- Latest Press Release
- Industry Association
- Paid Database
- Investor Presentations

Step 4 - Data Triangulation
Involves using different sources of information in order to increase the validity of a study
These sources are likely to be stakeholders in a program - participants, other researchers, program staff, other community members, and so on.
Then we put all data in single framework & apply various statistical tools to find out the dynamic on the market.
During the analysis stage, feedback from the stakeholder groups would be compared to determine areas of agreement as well as areas of divergence