

Key Insights
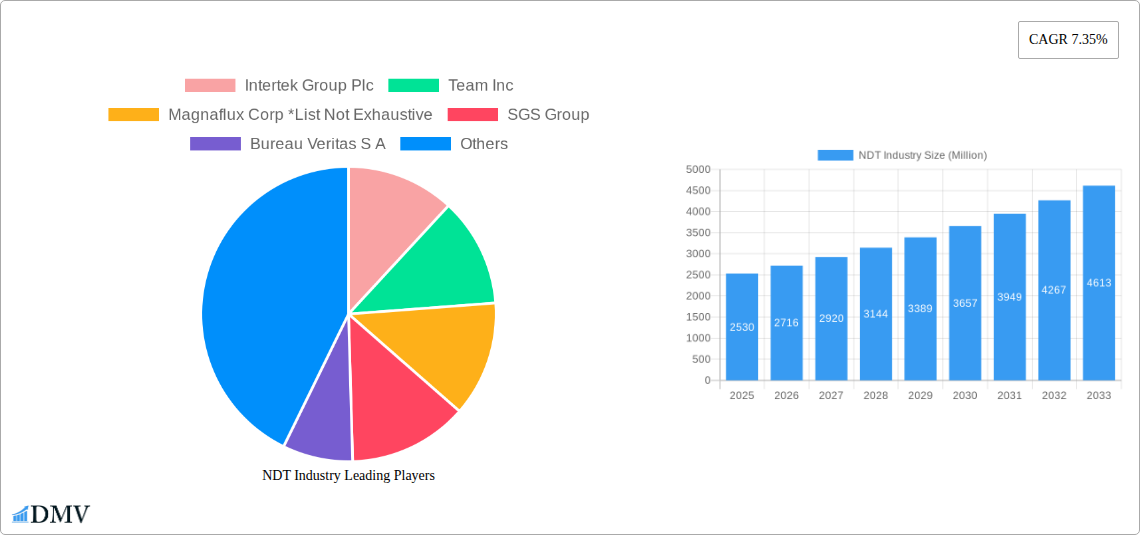
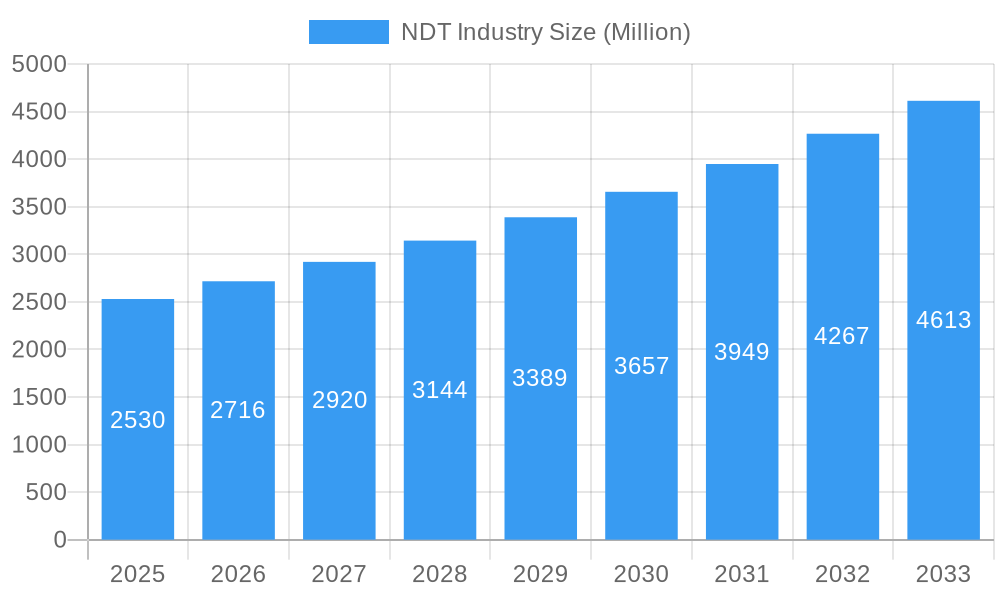
The Non-Destructive Testing (NDT) industry is experiencing robust growth, projected to reach a market size of $2.53 billion in 2025, with a Compound Annual Growth Rate (CAGR) of 7.35% from 2019 to 2033. This expansion is fueled by several key drivers. Increasing infrastructure development globally, particularly in emerging economies, necessitates rigorous quality control and safety measures, significantly boosting demand for NDT services and equipment. The growing adoption of advanced manufacturing techniques, like additive manufacturing (3D printing), introduces unique material challenges requiring sophisticated NDT methods for defect detection and quality assurance. Furthermore, stringent regulatory standards across various industries, including aerospace, automotive, and oil & gas, mandate comprehensive NDT inspections, driving market growth. The rising awareness of safety and preventive maintenance also contributes to the industry's expansion. Within the various NDT methods, ultrasonic testing and radiography testing are expected to retain significant market share due to their versatility and widespread applicability. The services segment is currently dominant, reflecting the outsourcing trend among various industries.
NDT Industry Market Size (In Billion)
Looking ahead, several trends will shape the future of the NDT market. The increasing integration of automation and artificial intelligence (AI) into NDT processes promises improved efficiency, accuracy, and reduced inspection time. The development of more portable and user-friendly NDT equipment is further expanding its accessibility across diverse applications and locations. However, the high initial investment costs associated with advanced NDT equipment and the requirement for skilled personnel pose significant challenges to market growth. Furthermore, technological advancements necessitate continuous training and upskilling of the workforce, which could hinder the expansion in some regions. Nevertheless, the overall market outlook remains positive, with significant growth potential driven by the aforementioned factors, especially within the Asia-Pacific region experiencing rapid industrialization and infrastructure development. The projected market size by 2033 will significantly surpass the 2025 figure, reflecting this sustained growth trajectory.
NDT Industry Company Market Share
NDT Industry Market Report: A Comprehensive Analysis 2019-2033
This comprehensive report provides a detailed analysis of the Non-Destructive Testing (NDT) industry, offering invaluable insights for stakeholders seeking to understand market trends, growth opportunities, and competitive dynamics. The report covers the period from 2019 to 2033, with a focus on the 2025-2033 forecast period. The global NDT market is projected to reach a value of $XX Million by 2033, driven by increasing demand across diverse end-user industries. This report analyzes key segments including Testing Technologies (Radiography, Ultrasonic, Magnetic Particle, Liquid Penetrant, Visual Inspection, Eddy Current, and Others), End-user Industries (Oil & Gas, Power & Energy, Construction, Automotive & Transportation, Aerospace & Defense, and Others), and Product Types (Services and Equipment).
NDT Industry Market Composition & Trends
The NDT market is moderately concentrated, with key players like Intertek Group Plc, SGS Group, Bureau Veritas S A, and Team Inc. holding significant market share. However, the presence of numerous smaller specialized firms contributes to a dynamic competitive landscape. The market share distribution in 2025 is estimated as follows: Intertek Group Plc (XX%), SGS Group (XX%), Bureau Veritas S A (XX%), Team Inc (XX%), and Others (XX%). Innovation is primarily driven by advancements in testing technologies, particularly in automated inspection systems and data analytics capabilities. Stringent regulatory frameworks, particularly in safety-critical industries like aerospace and energy, are major drivers, mandating regular NDT inspections. Substitute technologies are limited, given the unique capabilities of NDT in detecting internal flaws without damaging the inspected item. Major end-users include companies operating in Oil & Gas, Power & Energy, and Automotive & Transportation sectors.
- Market Concentration: Moderately concentrated, with a few large players dominating.
- Innovation Catalysts: Advancements in automation, data analytics, and specialized testing methods.
- Regulatory Landscape: Stringent regulations in safety-critical industries drive demand.
- Substitute Products: Limited substitutes due to the unique capabilities of NDT.
- End-User Profiles: Predominantly safety-conscious industries (Oil & Gas, Aerospace, etc.).
- M&A Activities: Over the period 2019-2024, approximately $XX Million was invested in M&A activities within the NDT sector, with a notable increase in activity in 2022.
NDT Industry Evolution
The NDT market has exhibited steady growth over the historical period (2019-2024), with a Compound Annual Growth Rate (CAGR) of approximately XX%. This growth is projected to continue during the forecast period (2025-2033), driven by several factors. Technological advancements, such as the integration of AI and machine learning for automated defect detection, are significantly improving the efficiency and accuracy of NDT procedures. Rising demand from emerging economies, particularly in Asia-Pacific and the Middle East, is further fueling market expansion. The increasing adoption of advanced materials in various industries also necessitates more sophisticated NDT techniques, contributing to overall growth. Consumer demand is shifting toward faster, more accurate, and cost-effective NDT solutions, encouraging companies to invest heavily in R&D. The adoption rate of advanced NDT technologies is projected to increase by XX% annually during the forecast period.
Leading Regions, Countries, or Segments in NDT Industry
North America currently holds the largest market share in the NDT industry, driven by robust growth in the oil & gas and aerospace sectors. Europe follows closely, with a strong presence of established NDT service providers. The Asia-Pacific region is witnessing the fastest growth, owing to significant investments in infrastructure development and industrial expansion. Within the testing technology segment, Ultrasonic Testing and Radiography Testing hold the largest shares. In the end-user industry segment, Oil & Gas and Automotive & Transportation are the key drivers. The services segment dominates the overall market, primarily due to the outsourcing of NDT services by various companies.
- Key Drivers (North America): High investments in aerospace & defense, stringent safety regulations.
- Key Drivers (Europe): Strong presence of established NDT service providers, advanced technological capabilities.
- Key Drivers (Asia-Pacific): Rapid infrastructure development, rising industrialization.
- Dominant Segments (Testing Technology): Ultrasonic Testing and Radiography Testing.
- Dominant Segments (End-user Industry): Oil & Gas and Automotive & Transportation.
- Dominant Segments (Type): Services.
NDT Industry Product Innovations
Recent innovations include the development of portable and handheld NDT devices, enabling on-site inspections in remote or challenging environments. Advanced data analytics tools provide faster, more comprehensive defect analysis, reducing inspection time and improving accuracy. The integration of AI and machine learning algorithms enhances defect identification and classification, minimizing human error. These advancements offer unique selling propositions such as increased efficiency, improved accuracy, and reduced operational costs.
Propelling Factors for NDT Industry Growth
Several factors are driving the growth of the NDT industry. Technological advancements, including automation and AI, are improving the speed and accuracy of inspections. Stringent safety regulations across numerous industries mandate regular NDT testing. The increasing complexity of manufactured components necessitates more advanced NDT methods to detect subtle defects. Furthermore, the expansion of various end-user industries like renewable energy and construction is creating new opportunities for NDT service providers.
Obstacles in the NDT Industry Market
The NDT industry faces several challenges. Supply chain disruptions caused by global events can impact the availability of specialized equipment and materials. Competition among various NDT service providers is intense, leading to price pressures. Furthermore, stringent regulatory compliance requirements can increase operational costs for companies. These obstacles can hinder the overall growth of the market, and their impact is estimated to reduce the market growth by XX% annually during the forecast period.
Future Opportunities in NDT Industry
The NDT industry is poised for significant growth, fueled by several emerging opportunities. The adoption of advanced materials, like composites and nanomaterials, will require more sophisticated NDT techniques. The growing adoption of digitalization and the Industrial Internet of Things (IIoT) will lead to further automation and data analysis capabilities within the NDT industry. Furthermore, emerging sectors such as renewable energy and space exploration are creating new demand for specialized NDT solutions.
Major Players in the NDT Industry Ecosystem
- Intertek Group Plc
- Team Inc
- Magnaflux Corp
- SGS Group
- Bureau Veritas S A
- Nikon Metrology NV
- Fujifilm Corporation
- TÜV Rheinland AG
- Mistras Group Inc
- Yxlon International Gmbh (Comet Holding Ag)
- Applus Services
- Olympus Corporation
- GE Measurement & Control Solutions
Key Developments in NDT Industry Industry
- 2022 Q4: Intertek Group Plc acquired a specialized NDT company, expanding its service portfolio.
- 2023 Q1: Significant investment in R&D by Bureau Veritas S A to develop advanced AI-powered NDT systems.
- 2023 Q2: Launch of a new portable ultrasonic testing device by Olympus Corporation.
- 2024 Q1: SGS Group announced a partnership with a leading technology provider to integrate blockchain technology for enhanced NDT data security. (Further data points would be added here based on actual events)
Strategic NDT Industry Market Forecast
The NDT market is expected to experience robust growth driven by technological advancements, increasing demand across various industries, and stringent safety regulations. Continued innovation in automated inspection systems, AI-powered data analysis, and portable devices will further drive market expansion. The emergence of new industries and applications will create lucrative opportunities for NDT service providers and equipment manufacturers. The market's positive outlook reflects the enduring importance of NDT in ensuring safety, quality, and efficiency across a wide range of sectors.
NDT Industry Segmentation
-
1. Type
- 1.1. Equipment
- 1.2. Services
-
2. Testing Technology
- 2.1. Radiography Testing
- 2.2. Ultrasonic Testing
- 2.3. Magnetic Particle Testing
- 2.4. Liquid Penetrant Testing
- 2.5. Visual Inspection Testing
- 2.6. Eddy Current Testing
- 2.7. Other Testing Technologies
-
3. End-user Industry
- 3.1. Oil and Gas
- 3.2. Power and Energy
- 3.3. Construction
- 3.4. Automotive and Transportation
- 3.5. Aerospace
- 3.6. Defense
- 3.7. Other End User Industries
NDT Industry Segmentation By Geography
-
1. North America
- 1.1. United States
- 1.2. Canada
-
2. Europe
- 2.1. Germany
- 2.2. United Kingdom
- 2.3. France
-
3. Asia
- 3.1. China
- 3.2. Japan
- 3.3. India
- 4. Australia and New Zealand
-
5. Latin America
- 5.1. Brazil
- 5.2. Argentina
- 5.3. Mexico
-
6. Middle East and Africa
- 6.1. United Arab Emirates
- 6.2. Saudi Arabia
- 6.3. South Africa

NDT Industry Regional Market Share
Geographic Coverage of NDT Industry
NDT Industry REPORT HIGHLIGHTS
| Aspects | Details |
|---|---|
| Study Period | 2020-2034 |
| Base Year | 2025 |
| Estimated Year | 2026 |
| Forecast Period | 2026-2034 |
| Historical Period | 2020-2025 |
| Growth Rate | CAGR of 7.35% from 2020-2034 |
| Segmentation |
|
Table of Contents
- 1. Introduction
- 1.1. Research Scope
- 1.2. Market Segmentation
- 1.3. Research Objective
- 1.4. Definitions and Assumptions
- 2. Executive Summary
- 2.1. Market Snapshot
- 3. Market Dynamics
- 3.1. Market Drivers
- 3.2. Market Restrains
- 3.3. Market Trends
- 3.4. Market Opportunities
- 4. Market Factor Analysis
- 4.1. Porters Five Forces
- 4.1.1. Bargaining Power of Suppliers
- 4.1.2. Bargaining Power of Buyers
- 4.1.3. Threat of New Entrants
- 4.1.4. Threat of Substitutes
- 4.1.5. Competitive Rivalry
- 4.2. PESTEL analysis
- 4.3. BCG Analysis
- 4.3.1. Stars (High Growth, High Market Share)
- 4.3.2. Cash Cows (Low Growth, High Market Share)
- 4.3.3. Question Mark (High Growth, Low Market Share)
- 4.3.4. Dogs (Low Growth, Low Market Share)
- 4.4. Ansoff Matrix Analysis
- 4.5. Supply Chain Analysis
- 4.6. Regulatory Landscape
- 4.7. Current Market Potential and Opportunity Assessment (TAM–SAM–SOM Framework)
- 4.8. DMV Analyst Note
- 4.1. Porters Five Forces
- 5. Market Analysis, Insights and Forecast 2021-2033
- 5.1. Market Analysis, Insights and Forecast - by Type
- 5.1.1. Equipment
- 5.1.2. Services
- 5.2. Market Analysis, Insights and Forecast - by Testing Technology
- 5.2.1. Radiography Testing
- 5.2.2. Ultrasonic Testing
- 5.2.3. Magnetic Particle Testing
- 5.2.4. Liquid Penetrant Testing
- 5.2.5. Visual Inspection Testing
- 5.2.6. Eddy Current Testing
- 5.2.7. Other Testing Technologies
- 5.3. Market Analysis, Insights and Forecast - by End-user Industry
- 5.3.1. Oil and Gas
- 5.3.2. Power and Energy
- 5.3.3. Construction
- 5.3.4. Automotive and Transportation
- 5.3.5. Aerospace
- 5.3.6. Defense
- 5.3.7. Other End User Industries
- 5.4. Market Analysis, Insights and Forecast - by Region
- 5.4.1. North America
- 5.4.2. Europe
- 5.4.3. Asia
- 5.4.4. Australia and New Zealand
- 5.4.5. Latin America
- 5.4.6. Middle East and Africa
- 5.1. Market Analysis, Insights and Forecast - by Type
- 6. Global NDT Industry Analysis, Insights and Forecast, 2021-2033
- 6.1. Market Analysis, Insights and Forecast - by Type
- 6.1.1. Equipment
- 6.1.2. Services
- 6.2. Market Analysis, Insights and Forecast - by Testing Technology
- 6.2.1. Radiography Testing
- 6.2.2. Ultrasonic Testing
- 6.2.3. Magnetic Particle Testing
- 6.2.4. Liquid Penetrant Testing
- 6.2.5. Visual Inspection Testing
- 6.2.6. Eddy Current Testing
- 6.2.7. Other Testing Technologies
- 6.3. Market Analysis, Insights and Forecast - by End-user Industry
- 6.3.1. Oil and Gas
- 6.3.2. Power and Energy
- 6.3.3. Construction
- 6.3.4. Automotive and Transportation
- 6.3.5. Aerospace
- 6.3.6. Defense
- 6.3.7. Other End User Industries
- 6.1. Market Analysis, Insights and Forecast - by Type
- 7. North America NDT Industry Analysis, Insights and Forecast, 2020-2032
- 7.1. Market Analysis, Insights and Forecast - by Type
- 7.1.1. Equipment
- 7.1.2. Services
- 7.2. Market Analysis, Insights and Forecast - by Testing Technology
- 7.2.1. Radiography Testing
- 7.2.2. Ultrasonic Testing
- 7.2.3. Magnetic Particle Testing
- 7.2.4. Liquid Penetrant Testing
- 7.2.5. Visual Inspection Testing
- 7.2.6. Eddy Current Testing
- 7.2.7. Other Testing Technologies
- 7.3. Market Analysis, Insights and Forecast - by End-user Industry
- 7.3.1. Oil and Gas
- 7.3.2. Power and Energy
- 7.3.3. Construction
- 7.3.4. Automotive and Transportation
- 7.3.5. Aerospace
- 7.3.6. Defense
- 7.3.7. Other End User Industries
- 7.1. Market Analysis, Insights and Forecast - by Type
- 8. Europe NDT Industry Analysis, Insights and Forecast, 2020-2032
- 8.1. Market Analysis, Insights and Forecast - by Type
- 8.1.1. Equipment
- 8.1.2. Services
- 8.2. Market Analysis, Insights and Forecast - by Testing Technology
- 8.2.1. Radiography Testing
- 8.2.2. Ultrasonic Testing
- 8.2.3. Magnetic Particle Testing
- 8.2.4. Liquid Penetrant Testing
- 8.2.5. Visual Inspection Testing
- 8.2.6. Eddy Current Testing
- 8.2.7. Other Testing Technologies
- 8.3. Market Analysis, Insights and Forecast - by End-user Industry
- 8.3.1. Oil and Gas
- 8.3.2. Power and Energy
- 8.3.3. Construction
- 8.3.4. Automotive and Transportation
- 8.3.5. Aerospace
- 8.3.6. Defense
- 8.3.7. Other End User Industries
- 8.1. Market Analysis, Insights and Forecast - by Type
- 9. Asia NDT Industry Analysis, Insights and Forecast, 2020-2032
- 9.1. Market Analysis, Insights and Forecast - by Type
- 9.1.1. Equipment
- 9.1.2. Services
- 9.2. Market Analysis, Insights and Forecast - by Testing Technology
- 9.2.1. Radiography Testing
- 9.2.2. Ultrasonic Testing
- 9.2.3. Magnetic Particle Testing
- 9.2.4. Liquid Penetrant Testing
- 9.2.5. Visual Inspection Testing
- 9.2.6. Eddy Current Testing
- 9.2.7. Other Testing Technologies
- 9.3. Market Analysis, Insights and Forecast - by End-user Industry
- 9.3.1. Oil and Gas
- 9.3.2. Power and Energy
- 9.3.3. Construction
- 9.3.4. Automotive and Transportation
- 9.3.5. Aerospace
- 9.3.6. Defense
- 9.3.7. Other End User Industries
- 9.1. Market Analysis, Insights and Forecast - by Type
- 10. Australia and New Zealand NDT Industry Analysis, Insights and Forecast, 2020-2032
- 10.1. Market Analysis, Insights and Forecast - by Type
- 10.1.1. Equipment
- 10.1.2. Services
- 10.2. Market Analysis, Insights and Forecast - by Testing Technology
- 10.2.1. Radiography Testing
- 10.2.2. Ultrasonic Testing
- 10.2.3. Magnetic Particle Testing
- 10.2.4. Liquid Penetrant Testing
- 10.2.5. Visual Inspection Testing
- 10.2.6. Eddy Current Testing
- 10.2.7. Other Testing Technologies
- 10.3. Market Analysis, Insights and Forecast - by End-user Industry
- 10.3.1. Oil and Gas
- 10.3.2. Power and Energy
- 10.3.3. Construction
- 10.3.4. Automotive and Transportation
- 10.3.5. Aerospace
- 10.3.6. Defense
- 10.3.7. Other End User Industries
- 10.1. Market Analysis, Insights and Forecast - by Type
- 11. Latin America NDT Industry Analysis, Insights and Forecast, 2020-2032
- 11.1. Market Analysis, Insights and Forecast - by Type
- 11.1.1. Equipment
- 11.1.2. Services
- 11.2. Market Analysis, Insights and Forecast - by Testing Technology
- 11.2.1. Radiography Testing
- 11.2.2. Ultrasonic Testing
- 11.2.3. Magnetic Particle Testing
- 11.2.4. Liquid Penetrant Testing
- 11.2.5. Visual Inspection Testing
- 11.2.6. Eddy Current Testing
- 11.2.7. Other Testing Technologies
- 11.3. Market Analysis, Insights and Forecast - by End-user Industry
- 11.3.1. Oil and Gas
- 11.3.2. Power and Energy
- 11.3.3. Construction
- 11.3.4. Automotive and Transportation
- 11.3.5. Aerospace
- 11.3.6. Defense
- 11.3.7. Other End User Industries
- 11.1. Market Analysis, Insights and Forecast - by Type
- 12. Middle East and Africa NDT Industry Analysis, Insights and Forecast, 2020-2032
- 12.1. Market Analysis, Insights and Forecast - by Type
- 12.1.1. Equipment
- 12.1.2. Services
- 12.2. Market Analysis, Insights and Forecast - by Testing Technology
- 12.2.1. Radiography Testing
- 12.2.2. Ultrasonic Testing
- 12.2.3. Magnetic Particle Testing
- 12.2.4. Liquid Penetrant Testing
- 12.2.5. Visual Inspection Testing
- 12.2.6. Eddy Current Testing
- 12.2.7. Other Testing Technologies
- 12.3. Market Analysis, Insights and Forecast - by End-user Industry
- 12.3.1. Oil and Gas
- 12.3.2. Power and Energy
- 12.3.3. Construction
- 12.3.4. Automotive and Transportation
- 12.3.5. Aerospace
- 12.3.6. Defense
- 12.3.7. Other End User Industries
- 12.1. Market Analysis, Insights and Forecast - by Type
- 13. Competitive Analysis
- 13.1. Company Profiles
- 13.1.1 Intertek Group Plc
- 13.1.1.1. Company Overview
- 13.1.1.2. Products
- 13.1.1.3. Company Financials
- 13.1.1.4. SWOT Analysis
- 13.1.2 Team Inc
- 13.1.2.1. Company Overview
- 13.1.2.2. Products
- 13.1.2.3. Company Financials
- 13.1.2.4. SWOT Analysis
- 13.1.3 Magnaflux Corp *List Not Exhaustive
- 13.1.3.1. Company Overview
- 13.1.3.2. Products
- 13.1.3.3. Company Financials
- 13.1.3.4. SWOT Analysis
- 13.1.4 SGS Group
- 13.1.4.1. Company Overview
- 13.1.4.2. Products
- 13.1.4.3. Company Financials
- 13.1.4.4. SWOT Analysis
- 13.1.5 Bureau Veritas S A
- 13.1.5.1. Company Overview
- 13.1.5.2. Products
- 13.1.5.3. Company Financials
- 13.1.5.4. SWOT Analysis
- 13.1.6 Nikon Metrology NV
- 13.1.6.1. Company Overview
- 13.1.6.2. Products
- 13.1.6.3. Company Financials
- 13.1.6.4. SWOT Analysis
- 13.1.7 Fujifilm Corporation
- 13.1.7.1. Company Overview
- 13.1.7.2. Products
- 13.1.7.3. Company Financials
- 13.1.7.4. SWOT Analysis
- 13.1.8 TÜV Rheinland AG
- 13.1.8.1. Company Overview
- 13.1.8.2. Products
- 13.1.8.3. Company Financials
- 13.1.8.4. SWOT Analysis
- 13.1.9 Mistras Group Inc
- 13.1.9.1. Company Overview
- 13.1.9.2. Products
- 13.1.9.3. Company Financials
- 13.1.9.4. SWOT Analysis
- 13.1.10 Yxlon International Gmbh (Comet Holding Ag)
- 13.1.10.1. Company Overview
- 13.1.10.2. Products
- 13.1.10.3. Company Financials
- 13.1.10.4. SWOT Analysis
- 13.1.11 Applus Services
- 13.1.11.1. Company Overview
- 13.1.11.2. Products
- 13.1.11.3. Company Financials
- 13.1.11.4. SWOT Analysis
- 13.1.12 Olympus Corporation
- 13.1.12.1. Company Overview
- 13.1.12.2. Products
- 13.1.12.3. Company Financials
- 13.1.12.4. SWOT Analysis
- 13.1.13 GE Measurement & Control Solutions
- 13.1.13.1. Company Overview
- 13.1.13.2. Products
- 13.1.13.3. Company Financials
- 13.1.13.4. SWOT Analysis
- 13.1.1 Intertek Group Plc
- 13.2. Market Entropy
- 13.2.1 Company's Key Areas Served
- 13.2.2 Recent Developments
- 13.3. Company Market Share Analysis 2025
- 13.3.1 Top 5 Companies Market Share Analysis
- 13.3.2 Top 3 Companies Market Share Analysis
- 13.4. List of Potential Customers
- 14. Research Methodology
List of Figures
- Figure 1: Global NDT Industry Revenue Breakdown (Million, %) by Region 2025 & 2033
- Figure 2: North America NDT Industry Revenue (Million), by Type 2025 & 2033
- Figure 3: North America NDT Industry Revenue Share (%), by Type 2025 & 2033
- Figure 4: North America NDT Industry Revenue (Million), by Testing Technology 2025 & 2033
- Figure 5: North America NDT Industry Revenue Share (%), by Testing Technology 2025 & 2033
- Figure 6: North America NDT Industry Revenue (Million), by End-user Industry 2025 & 2033
- Figure 7: North America NDT Industry Revenue Share (%), by End-user Industry 2025 & 2033
- Figure 8: North America NDT Industry Revenue (Million), by Country 2025 & 2033
- Figure 9: North America NDT Industry Revenue Share (%), by Country 2025 & 2033
- Figure 10: Europe NDT Industry Revenue (Million), by Type 2025 & 2033
- Figure 11: Europe NDT Industry Revenue Share (%), by Type 2025 & 2033
- Figure 12: Europe NDT Industry Revenue (Million), by Testing Technology 2025 & 2033
- Figure 13: Europe NDT Industry Revenue Share (%), by Testing Technology 2025 & 2033
- Figure 14: Europe NDT Industry Revenue (Million), by End-user Industry 2025 & 2033
- Figure 15: Europe NDT Industry Revenue Share (%), by End-user Industry 2025 & 2033
- Figure 16: Europe NDT Industry Revenue (Million), by Country 2025 & 2033
- Figure 17: Europe NDT Industry Revenue Share (%), by Country 2025 & 2033
- Figure 18: Asia NDT Industry Revenue (Million), by Type 2025 & 2033
- Figure 19: Asia NDT Industry Revenue Share (%), by Type 2025 & 2033
- Figure 20: Asia NDT Industry Revenue (Million), by Testing Technology 2025 & 2033
- Figure 21: Asia NDT Industry Revenue Share (%), by Testing Technology 2025 & 2033
- Figure 22: Asia NDT Industry Revenue (Million), by End-user Industry 2025 & 2033
- Figure 23: Asia NDT Industry Revenue Share (%), by End-user Industry 2025 & 2033
- Figure 24: Asia NDT Industry Revenue (Million), by Country 2025 & 2033
- Figure 25: Asia NDT Industry Revenue Share (%), by Country 2025 & 2033
- Figure 26: Australia and New Zealand NDT Industry Revenue (Million), by Type 2025 & 2033
- Figure 27: Australia and New Zealand NDT Industry Revenue Share (%), by Type 2025 & 2033
- Figure 28: Australia and New Zealand NDT Industry Revenue (Million), by Testing Technology 2025 & 2033
- Figure 29: Australia and New Zealand NDT Industry Revenue Share (%), by Testing Technology 2025 & 2033
- Figure 30: Australia and New Zealand NDT Industry Revenue (Million), by End-user Industry 2025 & 2033
- Figure 31: Australia and New Zealand NDT Industry Revenue Share (%), by End-user Industry 2025 & 2033
- Figure 32: Australia and New Zealand NDT Industry Revenue (Million), by Country 2025 & 2033
- Figure 33: Australia and New Zealand NDT Industry Revenue Share (%), by Country 2025 & 2033
- Figure 34: Latin America NDT Industry Revenue (Million), by Type 2025 & 2033
- Figure 35: Latin America NDT Industry Revenue Share (%), by Type 2025 & 2033
- Figure 36: Latin America NDT Industry Revenue (Million), by Testing Technology 2025 & 2033
- Figure 37: Latin America NDT Industry Revenue Share (%), by Testing Technology 2025 & 2033
- Figure 38: Latin America NDT Industry Revenue (Million), by End-user Industry 2025 & 2033
- Figure 39: Latin America NDT Industry Revenue Share (%), by End-user Industry 2025 & 2033
- Figure 40: Latin America NDT Industry Revenue (Million), by Country 2025 & 2033
- Figure 41: Latin America NDT Industry Revenue Share (%), by Country 2025 & 2033
- Figure 42: Middle East and Africa NDT Industry Revenue (Million), by Type 2025 & 2033
- Figure 43: Middle East and Africa NDT Industry Revenue Share (%), by Type 2025 & 2033
- Figure 44: Middle East and Africa NDT Industry Revenue (Million), by Testing Technology 2025 & 2033
- Figure 45: Middle East and Africa NDT Industry Revenue Share (%), by Testing Technology 2025 & 2033
- Figure 46: Middle East and Africa NDT Industry Revenue (Million), by End-user Industry 2025 & 2033
- Figure 47: Middle East and Africa NDT Industry Revenue Share (%), by End-user Industry 2025 & 2033
- Figure 48: Middle East and Africa NDT Industry Revenue (Million), by Country 2025 & 2033
- Figure 49: Middle East and Africa NDT Industry Revenue Share (%), by Country 2025 & 2033
List of Tables
- Table 1: Global NDT Industry Revenue Million Forecast, by Type 2020 & 2033
- Table 2: Global NDT Industry Revenue Million Forecast, by Testing Technology 2020 & 2033
- Table 3: Global NDT Industry Revenue Million Forecast, by End-user Industry 2020 & 2033
- Table 4: Global NDT Industry Revenue Million Forecast, by Region 2020 & 2033
- Table 5: Global NDT Industry Revenue Million Forecast, by Type 2020 & 2033
- Table 6: Global NDT Industry Revenue Million Forecast, by Testing Technology 2020 & 2033
- Table 7: Global NDT Industry Revenue Million Forecast, by End-user Industry 2020 & 2033
- Table 8: Global NDT Industry Revenue Million Forecast, by Country 2020 & 2033
- Table 9: United States NDT Industry Revenue (Million) Forecast, by Application 2020 & 2033
- Table 10: Canada NDT Industry Revenue (Million) Forecast, by Application 2020 & 2033
- Table 11: Global NDT Industry Revenue Million Forecast, by Type 2020 & 2033
- Table 12: Global NDT Industry Revenue Million Forecast, by Testing Technology 2020 & 2033
- Table 13: Global NDT Industry Revenue Million Forecast, by End-user Industry 2020 & 2033
- Table 14: Global NDT Industry Revenue Million Forecast, by Country 2020 & 2033
- Table 15: Germany NDT Industry Revenue (Million) Forecast, by Application 2020 & 2033
- Table 16: United Kingdom NDT Industry Revenue (Million) Forecast, by Application 2020 & 2033
- Table 17: France NDT Industry Revenue (Million) Forecast, by Application 2020 & 2033
- Table 18: Global NDT Industry Revenue Million Forecast, by Type 2020 & 2033
- Table 19: Global NDT Industry Revenue Million Forecast, by Testing Technology 2020 & 2033
- Table 20: Global NDT Industry Revenue Million Forecast, by End-user Industry 2020 & 2033
- Table 21: Global NDT Industry Revenue Million Forecast, by Country 2020 & 2033
- Table 22: China NDT Industry Revenue (Million) Forecast, by Application 2020 & 2033
- Table 23: Japan NDT Industry Revenue (Million) Forecast, by Application 2020 & 2033
- Table 24: India NDT Industry Revenue (Million) Forecast, by Application 2020 & 2033
- Table 25: Global NDT Industry Revenue Million Forecast, by Type 2020 & 2033
- Table 26: Global NDT Industry Revenue Million Forecast, by Testing Technology 2020 & 2033
- Table 27: Global NDT Industry Revenue Million Forecast, by End-user Industry 2020 & 2033
- Table 28: Global NDT Industry Revenue Million Forecast, by Country 2020 & 2033
- Table 29: Global NDT Industry Revenue Million Forecast, by Type 2020 & 2033
- Table 30: Global NDT Industry Revenue Million Forecast, by Testing Technology 2020 & 2033
- Table 31: Global NDT Industry Revenue Million Forecast, by End-user Industry 2020 & 2033
- Table 32: Global NDT Industry Revenue Million Forecast, by Country 2020 & 2033
- Table 33: Brazil NDT Industry Revenue (Million) Forecast, by Application 2020 & 2033
- Table 34: Argentina NDT Industry Revenue (Million) Forecast, by Application 2020 & 2033
- Table 35: Mexico NDT Industry Revenue (Million) Forecast, by Application 2020 & 2033
- Table 36: Global NDT Industry Revenue Million Forecast, by Type 2020 & 2033
- Table 37: Global NDT Industry Revenue Million Forecast, by Testing Technology 2020 & 2033
- Table 38: Global NDT Industry Revenue Million Forecast, by End-user Industry 2020 & 2033
- Table 39: Global NDT Industry Revenue Million Forecast, by Country 2020 & 2033
- Table 40: United Arab Emirates NDT Industry Revenue (Million) Forecast, by Application 2020 & 2033
- Table 41: Saudi Arabia NDT Industry Revenue (Million) Forecast, by Application 2020 & 2033
- Table 42: South Africa NDT Industry Revenue (Million) Forecast, by Application 2020 & 2033
Frequently Asked Questions
1. What is the projected Compound Annual Growth Rate (CAGR) of the NDT Industry?
The projected CAGR is approximately 7.35%.
2. Which companies are prominent players in the NDT Industry?
Key companies in the market include Intertek Group Plc, Team Inc, Magnaflux Corp *List Not Exhaustive, SGS Group, Bureau Veritas S A, Nikon Metrology NV, Fujifilm Corporation, TÜV Rheinland AG, Mistras Group Inc, Yxlon International Gmbh (Comet Holding Ag), Applus Services, Olympus Corporation, GE Measurement & Control Solutions.
3. What are the main segments of the NDT Industry?
The market segments include Type, Testing Technology, End-user Industry.
4. Can you provide details about the market size?
The market size is estimated to be USD 2.53 Million as of 2022.
5. What are some drivers contributing to market growth?
; Stringent Regulations Mandating Safety Standards; Increase in Demand for Flaw Detection to Reduce Repair Cost.
6. What are the notable trends driving market growth?
Power and Energy Sector Offers Potential Growth.
7. Are there any restraints impacting market growth?
; Lack of Skilled Workforce and Training Regulations.
8. Can you provide examples of recent developments in the market?
N/A
9. What pricing options are available for accessing the report?
Pricing options include single-user, multi-user, and enterprise licenses priced at USD 4750, USD 5250, and USD 8750 respectively.
10. Is the market size provided in terms of value or volume?
The market size is provided in terms of value, measured in Million.
11. Are there any specific market keywords associated with the report?
Yes, the market keyword associated with the report is "NDT Industry," which aids in identifying and referencing the specific market segment covered.
12. How do I determine which pricing option suits my needs best?
The pricing options vary based on user requirements and access needs. Individual users may opt for single-user licenses, while businesses requiring broader access may choose multi-user or enterprise licenses for cost-effective access to the report.
13. Are there any additional resources or data provided in the NDT Industry report?
While the report offers comprehensive insights, it's advisable to review the specific contents or supplementary materials provided to ascertain if additional resources or data are available.
14. How can I stay updated on further developments or reports in the NDT Industry?
To stay informed about further developments, trends, and reports in the NDT Industry, consider subscribing to industry newsletters, following relevant companies and organizations, or regularly checking reputable industry news sources and publications.
Methodology
Step 1 - Identification of Relevant Samples Size from Population Database


Step 2 - Approaches for Defining Global Market Size (Value, Volume* & Price*)

Note*: In applicable scenarios
Step 3 - Data Sources
Primary Research
- Web Analytics
- Survey Reports
- Research Institute
- Latest Research Reports
- Opinion Leaders
Secondary Research
- Annual Reports
- White Paper
- Latest Press Release
- Industry Association
- Paid Database
- Investor Presentations

Step 4 - Data Triangulation
Involves using different sources of information in order to increase the validity of a study
These sources are likely to be stakeholders in a program - participants, other researchers, program staff, other community members, and so on.
Then we put all data in single framework & apply various statistical tools to find out the dynamic on the market.
During the analysis stage, feedback from the stakeholder groups would be compared to determine areas of agreement as well as areas of divergence