


Key Insights
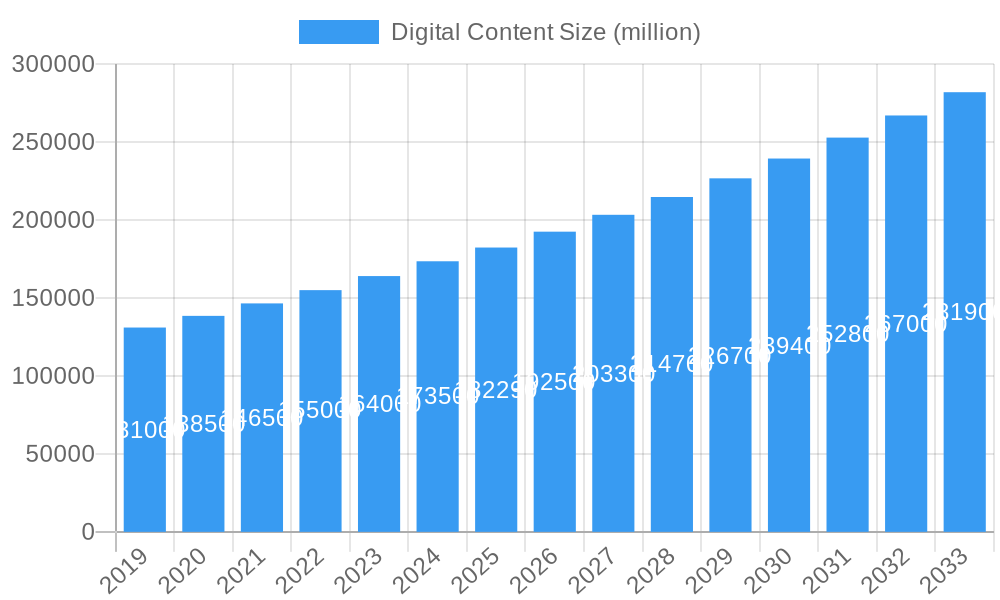
The global digital content market is poised for substantial growth, projected to reach approximately $182,290 million by 2025 and expand at a Compound Annual Growth Rate (CAGR) of 5.9% through 2033. This robust expansion is fueled by a confluence of powerful drivers, including the ever-increasing penetration of smartphones and high-speed internet, which provides a ubiquitous platform for content consumption. The proliferation of smart devices, from smart TVs to wearable technology, further broadens access and diversifies consumption patterns. Content creators are continuously innovating, offering a richer and more immersive user experience across various applications. The market is seeing a significant shift towards on-demand entertainment, interactive gaming, and personalized educational resources, all contributing to sustained user engagement. Emerging economies, particularly in the Asia Pacific region, are becoming critical growth engines, driven by a burgeoning young population with high digital literacy and a growing disposable income.
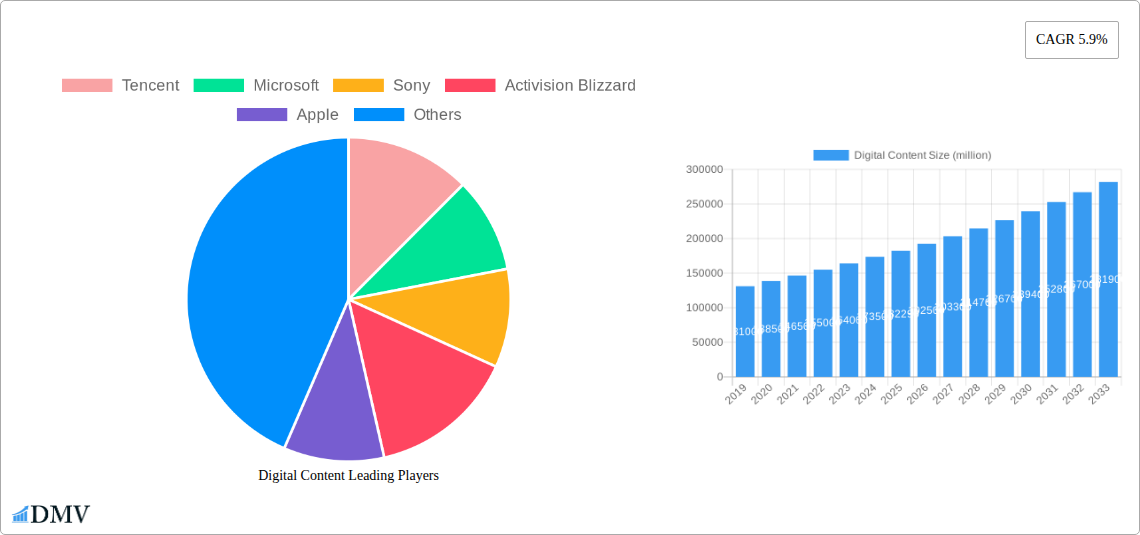
Digital Content Market Size (In Billion)

Key trends shaping the digital content landscape include the rise of short-form video content, the integration of artificial intelligence for personalized recommendations, and the increasing adoption of subscription-based models across all content types. The gaming segment, encompassing both mobile and console gaming, continues to be a dominant force, while the demand for high-quality streaming services for video and music shows no signs of abating. However, the market also faces certain restraints. Intense competition among content providers, coupled with increasing user acquisition costs, poses a challenge. Concerns around data privacy and security, as well as evolving regulatory landscapes in different regions, also necessitate careful navigation by market players. Despite these headwinds, the fundamental appeal of easily accessible, engaging, and diverse digital content, supported by technological advancements and evolving consumer preferences, ensures a promising trajectory for the market in the coming years.
Digital Content Company Market Share
Digital Content Market Insights: 2019-2033 Comprehensive Report
Uncover the dynamic landscape of the global digital content market with this in-depth report. Spanning the historical period of 2019-2024, the base and estimated year of 2025, and a robust forecast period of 2025-2033, this analysis provides unparalleled insights for stakeholders. Discover market concentration, innovation drivers, regulatory influences, and strategic M&A activities shaping the future of digital content consumption and creation.
Digital Content Market Composition & Trends
The global digital content market exhibits a fragmented yet evolving composition, characterized by a continuous influx of innovation and strategic consolidation. Market concentration is a key consideration, with major players like Tencent, Google, and Apple holding significant sway, while smaller, specialized entities carve out niche dominance. Innovation catalysts range from the rapid advancement of AI in content generation and personalization to the widespread adoption of immersive technologies like AR/VR across diverse applications. Regulatory landscapes are increasingly complex, with ongoing debates surrounding data privacy, content moderation, and intellectual property rights influencing market operations. The emergence of sophisticated AI-powered content creation tools is also a significant factor. Substitute products are continuously challenging established models, with user-generated content platforms and decentralized content distribution networks gaining traction. End-user profiles are highly diverse, encompassing gamers, entertainment seekers, students, and professionals, each with distinct consumption habits and preferences across various digital platforms. Merger and acquisition (M&A) activities are a significant indicator of market maturity and strategic intent. For instance, the Activision Blizzard acquisition by Microsoft, valued at approximately $69,000 million, signifies a monumental shift in the gaming content sector. Other notable M&A activities include anticipated deals within the streaming services and digital publishing spaces, with estimated combined deal values in the range of $15,000 million to $30,000 million during the historical period, driven by the pursuit of synergistic growth and expanded user bases. The market share distribution reflects this dynamic, with major tech giants dominating a significant portion of the revenue generated from digital content services, while specialized content providers focus on specific user segments and content types.
Digital Content Industry Evolution
The digital content industry has witnessed a breathtaking evolution driven by relentless technological advancements and a profound shift in consumer behavior. Over the historical period (2019-2024), the industry experienced a Compound Annual Growth Rate (CAGR) of approximately 15%, a testament to its inherent dynamism and adaptability. This growth trajectory was significantly fueled by the widespread proliferation of high-speed internet access, the exponential increase in mobile device penetration, and the subsequent surge in demand for on-demand entertainment and information. Technological advancements have been the bedrock of this evolution. The advent of 5G networks has dramatically enhanced streaming capabilities, enabling higher quality video and more immersive gaming experiences. Cloud computing infrastructure has facilitated the scalability and accessibility of digital content services, allowing companies to reach a global audience seamlessly. The rise of AI and machine learning has revolutionized content personalization, recommendation engines, and even content creation itself. For example, AI algorithms now curate personalized playlists on Spotify and Deezer, analyze viewing patterns on Hulu and Netflix, and are increasingly being utilized in the development of educational content and digital publications. The adoption rate of these technologies has been swift; smartphone penetration, a primary gateway to digital content, reached over 85% globally by the end of 2024, with Smart TV adoption following closely at over 60%. Consumer demand has mirrored these technological leaps. Users now expect instant access to a vast library of video and music content, engaging interactive gaming experiences, and easily digestible digital publications. The shift from ownership to subscription-based models, evident in platforms like Spotify, Deezer, and various streaming services, has redefined content consumption patterns, fostering recurring revenue streams for content providers. The gaming segment, in particular, has seen explosive growth, with the introduction of cloud gaming services and the popularity of mobile games contributing significantly to the industry's expansion. Furthermore, the rise of e-learning platforms and digital publishing services caters to a growing demand for accessible and flexible educational resources. The industry's ability to adapt to these evolving demands, coupled with continuous innovation, has cemented its position as a cornerstone of the modern digital economy, with projections indicating continued robust growth in the forecast period.
Leading Regions, Countries, or Segments in Digital Content
The digital content market's dominance is a multifaceted phenomenon, with specific regions, countries, and application/type segments exhibiting exceptional growth and influence. Globally, Asia-Pacific stands out as a leading region, driven by its massive population, rapidly growing middle class, and increasing digital literacy. Countries like China, with giants such as Tencent and Baidu, and South Korea, home to Nexon and NetEase, are pivotal hubs for gaming and online services. Their significant investments in digital infrastructure and a young, tech-savvy demographic contribute to the region's stronghold.
Within the Application category, Smartphones are unequivocally the dominant platform, serving as the primary access point for a vast majority of digital content consumers worldwide. Their portability, affordability, and ever-increasing processing power make them ideal for consuming video and music, engaging in mobile gaming, and accessing digital publications. The sheer volume of smartphone users, estimated to be over 7 billion globally by 2025, underscores their pervasive influence.
In terms of Type, the Video and Music segment consistently leads the digital content market. The ubiquitous nature of streaming services like Spotify, Deezer, Hulu, and the expansive offerings from companies like Warner Bros. and Square Enix cater to a universal desire for entertainment and information. This segment's dominance is further propelled by continuous innovation in content creation, distribution, and viewing experiences, including the rise of short-form video and high-fidelity audio. The global revenue generated by the Video and Music segment alone is projected to exceed $1,500,000 million by 2025.
Key drivers for this dominance include:
- Massive User Base: The sheer number of smartphone users globally provides an unparalleled audience for digital content.
- Content Accessibility: High-speed internet and affordable data plans enable seamless access to a vast array of digital content across devices.
- Technological Advancements: Continuous improvements in streaming technology, mobile device capabilities, and AI-driven personalization enhance user experience and engagement.
- Content Diversity and Innovation: A constant stream of new and engaging content across video, music, and gaming keeps users hooked and drives consumption.
- Subscription Models: The widespread adoption of subscription services fosters consistent revenue streams and user loyalty.
The Game segment also demonstrates remarkable growth, with major players like Nintendo, EA, Activision Blizzard, and Ubisoft investing heavily in new game development and distribution platforms. The increasing popularity of esports and mobile gaming has further cemented its position.
The dominance of these segments is not static. We are observing significant investment trends and regulatory support aimed at fostering innovation and expanding reach within these key areas. For example, governments in many Asian countries are actively promoting the growth of their domestic digital content industries through favorable policies and funding initiatives, further solidifying Asia-Pacific's leading position. The convergence of these factors creates a powerful ecosystem that drives the continued expansion and evolution of the global digital content market.
Digital Content Product Innovations
The digital content market is characterized by relentless product innovation, with a focus on enhancing user experience and expanding accessibility. Key advancements include the development of hyper-personalized content recommendation engines powered by AI, which analyze user behavior to deliver tailored video, music, and news feeds. Immersive content formats, such as interactive 360-degree videos and augmented reality experiences, are transforming engagement in gaming and educational sectors. Furthermore, the rise of generative AI is enabling the creation of dynamic and unique digital art, music, and even textual content, offering novel creative possibilities. Performance metrics are continuously improving, with lower latency streaming, higher resolution video (8K and beyond), and more responsive gaming environments becoming standard expectations. Unique selling propositions are increasingly tied to exclusivity of content, seamless cross-platform integration, and robust community features that foster user interaction.
Propelling Factors for Digital Content Growth
The digital content market's growth is propelled by a confluence of powerful technological, economic, and societal factors. Technological advancements are paramount, with the widespread rollout of 5G networks significantly enhancing streaming quality and enabling new interactive experiences. The increasing ubiquity of high-powered smartphones and smart TVs provides accessible platforms for content consumption. Economic factors play a crucial role, with a growing global middle class possessing increased disposable income and a higher propensity to spend on digital entertainment and information. The subscription-based model has proven highly effective, fostering recurring revenue and user loyalty, with global subscription revenues projected to surpass $1,200,000 million by 2025. Shifting consumer demands also fuel growth; users increasingly value on-demand access, personalization, and immersive content experiences, driving innovation in video, music, and gaming.
Obstacles in the Digital Content Market
Despite its robust growth, the digital content market faces significant obstacles. Regulatory challenges remain a persistent concern, with evolving data privacy laws (like GDPR and its global counterparts) and content moderation policies impacting how content is collected, used, and distributed. Supply chain disruptions, though less pronounced for purely digital goods, can still affect hardware availability, indirectly impacting content consumption. Competitive pressures are intense, with a crowded marketplace leading to pricing wars and the constant need for differentiation. Piracy and copyright infringement continue to erode potential revenue, with estimated global losses in the hundreds of billions of dollars annually. Furthermore, the digital divide persists, with significant portions of the global population lacking reliable internet access, limiting market reach.
Future Opportunities in Digital Content
Emerging opportunities in the digital content market are abundant, driven by technological breakthroughs and evolving consumer trends. The metaverse, with its potential for immersive virtual experiences, presents a vast new frontier for gaming, social interaction, and digital commerce. AI-driven content personalization will continue to deepen, creating hyper-individualized user journeys across all content types. The growth of esports and live streaming offers significant potential for audience engagement and monetization. Furthermore, the expansion of educational digital content into new markets and specialized niches, alongside the increasing demand for personalized news and information services, represents substantial growth avenues. The development of innovative digital publication formats and interactive storytelling promises to redefine media consumption.
Major Players in the Digital Content Ecosystem
- Tencent
- Microsoft
- Sony
- Activision Blizzard
- Apple
- Amazon
- EA
- NetEase
- Nexon
- Mixi
- Warner Bros
- Square Enix
- DeNA
- Zynga
- NCSoft
- Baidu
- Deezer
- Dish Network
- Giant Interactive Group
- Hulu
- Nintendo
- RELX plc
- Schibsted
- Spotify
- Wolters Kluwer
- KONAMI
- Ubisoft
- Bandai Namco
Key Developments in Digital Content Industry
- 2023: Microsoft completes the acquisition of Activision Blizzard, valued at approximately $69,000 million, significantly bolstering its gaming content portfolio.
- 2023: Apple expands its Arcade subscription service with new exclusive titles, demonstrating a continued commitment to mobile gaming.
- 2023: Google launches new AI tools for content creation and optimization, aiming to enhance its search and advertising services.
- 2024: Tencent reports record revenue from its gaming division, highlighting the sustained global demand for digital entertainment.
- 2024: Spotify introduces advanced AI-powered playlist generation features, further personalizing the music listening experience.
- 2024: Nintendo announces its next-generation console, hinting at enhanced gaming experiences and content delivery.
- 2024: Warner Bros. Discovery focuses on its streaming platforms, releasing a slate of exclusive original content to attract and retain subscribers.
- 2024: Activision Blizzard (under Microsoft) announces significant investments in cloud gaming infrastructure.
- 2024: Amazon invests heavily in original video content and live sports streaming rights to strengthen its Prime Video offering.
- 2024: EA continues to dominate the sports gaming genre with innovative updates to its FIFA/EA Sports FC franchise.
- 2024: NetEase and other Chinese tech giants explore opportunities in the metaverse and Web3 technologies.
- 2024: Deezer enhances its audio streaming features with a focus on hi-fi audio and personalized discovery.
- 2025 (Projected): Expect further consolidation in the digital publishing sector as companies seek scale and diversified revenue streams.
- 2025 (Projected): Major advancements in AI-generated video and music content are anticipated to enter the mainstream market.
- 2025 (Projected): Regulatory frameworks surrounding AI-generated content and data privacy are expected to become more defined globally.
- 2025 (Projected): Increased investment in AR/VR content development for gaming and educational applications.
- 2026 (Projected): The metaverse is expected to see a surge in content creation and user engagement, driving new monetization models.
- 2027 (Projected): Enhanced cross-platform content integration becomes a key differentiator for major digital content providers.
- 2028 (Projected): Decentralized content platforms gain further traction, challenging traditional distribution models.
- 2029 (Projected): The demand for specialized educational content delivered through interactive digital formats continues to grow significantly.
- 2030 (Projected): Immersive storytelling experiences become a standard expectation across video and gaming segments.
- 2031-2033 (Projected): Continued rapid evolution of AI in content creation, personalization, and distribution, shaping the future of the digital content landscape.
Strategic Digital Content Market Forecast
The strategic digital content market is poised for sustained growth, projected to expand at a CAGR of approximately 12% from 2025 to 2033. This expansion will be primarily driven by continued technological innovation, particularly in AI and immersive technologies, which will unlock new content formats and enhance user experiences. The increasing penetration of high-speed internet and mobile devices globally will ensure a growing addressable market. Evolving consumer preferences for personalized, on-demand, and interactive content will fuel demand across all segments, especially video, music, and gaming. Strategic acquisitions and partnerships will continue to shape market dynamics, as companies seek to expand their content libraries, user bases, and technological capabilities. The forecast indicates a robust future characterized by innovation, accessibility, and diverse monetization strategies.
Digital Content Segmentation
-
1. Application
- 1.1. Smartphones
- 1.2. Computers
- 1.3. Smart TV
- 1.4. Others
-
2. Types
- 2.1. Video and Music
- 2.2. Game
- 2.3. Education
- 2.4. Digital Publication
- 2.5. Others
Digital Content Segmentation By Geography
-
1. North America
- 1.1. United States
- 1.2. Canada
- 1.3. Mexico
-
2. South America
- 2.1. Brazil
- 2.2. Argentina
- 2.3. Rest of South America
-
3. Europe
- 3.1. United Kingdom
- 3.2. Germany
- 3.3. France
- 3.4. Italy
- 3.5. Spain
- 3.6. Russia
- 3.7. Benelux
- 3.8. Nordics
- 3.9. Rest of Europe
-
4. Middle East & Africa
- 4.1. Turkey
- 4.2. Israel
- 4.3. GCC
- 4.4. North Africa
- 4.5. South Africa
- 4.6. Rest of Middle East & Africa
-
5. Asia Pacific
- 5.1. China
- 5.2. India
- 5.3. Japan
- 5.4. South Korea
- 5.5. ASEAN
- 5.6. Oceania
- 5.7. Rest of Asia Pacific
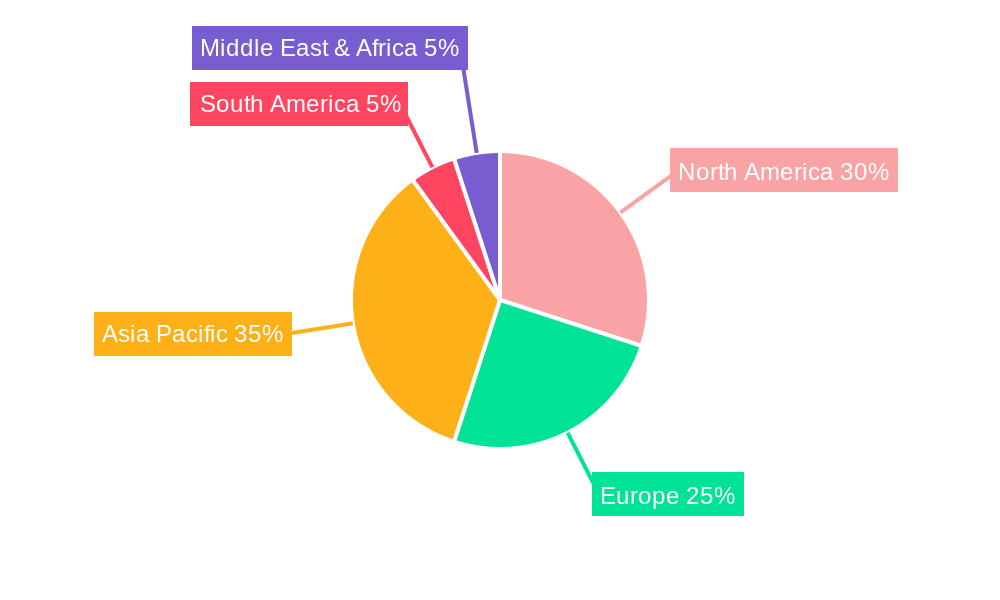
Digital Content Regional Market Share
Geographic Coverage of Digital Content
Digital Content REPORT HIGHLIGHTS
| Aspects | Details |
|---|---|
| Study Period | 2020-2034 |
| Base Year | 2025 |
| Estimated Year | 2026 |
| Forecast Period | 2026-2034 |
| Historical Period | 2020-2025 |
| Growth Rate | CAGR of 5.9% from 2020-2034 |
| Segmentation |
|
Table of Contents
- 1. Introduction
- 1.1. Research Scope
- 1.2. Market Segmentation
- 1.3. Research Objective
- 1.4. Definitions and Assumptions
- 2. Executive Summary
- 2.1. Market Snapshot
- 3. Market Dynamics
- 3.1. Market Drivers
- 3.2. Market Restrains
- 3.3. Market Trends
- 3.4. Market Opportunities
- 4. Market Factor Analysis
- 4.1. Porters Five Forces
- 4.1.1. Bargaining Power of Suppliers
- 4.1.2. Bargaining Power of Buyers
- 4.1.3. Threat of New Entrants
- 4.1.4. Threat of Substitutes
- 4.1.5. Competitive Rivalry
- 4.2. PESTEL analysis
- 4.3. BCG Analysis
- 4.3.1. Stars (High Growth, High Market Share)
- 4.3.2. Cash Cows (Low Growth, High Market Share)
- 4.3.3. Question Mark (High Growth, Low Market Share)
- 4.3.4. Dogs (Low Growth, Low Market Share)
- 4.4. Ansoff Matrix Analysis
- 4.5. Supply Chain Analysis
- 4.6. Regulatory Landscape
- 4.7. Current Market Potential and Opportunity Assessment (TAM–SAM–SOM Framework)
- 4.8. DMV Analyst Note
- 4.1. Porters Five Forces
- 5. Market Analysis, Insights and Forecast 2021-2033
- 5.1. Market Analysis, Insights and Forecast - by Application
- 5.1.1. Smartphones
- 5.1.2. Computers
- 5.1.3. Smart TV
- 5.1.4. Others
- 5.2. Market Analysis, Insights and Forecast - by Types
- 5.2.1. Video and Music
- 5.2.2. Game
- 5.2.3. Education
- 5.2.4. Digital Publication
- 5.2.5. Others
- 5.3. Market Analysis, Insights and Forecast - by Region
- 5.3.1. North America
- 5.3.2. South America
- 5.3.3. Europe
- 5.3.4. Middle East & Africa
- 5.3.5. Asia Pacific
- 5.1. Market Analysis, Insights and Forecast - by Application
- 6. Global Digital Content Analysis, Insights and Forecast, 2021-2033
- 6.1. Market Analysis, Insights and Forecast - by Application
- 6.1.1. Smartphones
- 6.1.2. Computers
- 6.1.3. Smart TV
- 6.1.4. Others
- 6.2. Market Analysis, Insights and Forecast - by Types
- 6.2.1. Video and Music
- 6.2.2. Game
- 6.2.3. Education
- 6.2.4. Digital Publication
- 6.2.5. Others
- 6.1. Market Analysis, Insights and Forecast - by Application
- 7. North America Digital Content Analysis, Insights and Forecast, 2020-2032
- 7.1. Market Analysis, Insights and Forecast - by Application
- 7.1.1. Smartphones
- 7.1.2. Computers
- 7.1.3. Smart TV
- 7.1.4. Others
- 7.2. Market Analysis, Insights and Forecast - by Types
- 7.2.1. Video and Music
- 7.2.2. Game
- 7.2.3. Education
- 7.2.4. Digital Publication
- 7.2.5. Others
- 7.1. Market Analysis, Insights and Forecast - by Application
- 8. South America Digital Content Analysis, Insights and Forecast, 2020-2032
- 8.1. Market Analysis, Insights and Forecast - by Application
- 8.1.1. Smartphones
- 8.1.2. Computers
- 8.1.3. Smart TV
- 8.1.4. Others
- 8.2. Market Analysis, Insights and Forecast - by Types
- 8.2.1. Video and Music
- 8.2.2. Game
- 8.2.3. Education
- 8.2.4. Digital Publication
- 8.2.5. Others
- 8.1. Market Analysis, Insights and Forecast - by Application
- 9. Europe Digital Content Analysis, Insights and Forecast, 2020-2032
- 9.1. Market Analysis, Insights and Forecast - by Application
- 9.1.1. Smartphones
- 9.1.2. Computers
- 9.1.3. Smart TV
- 9.1.4. Others
- 9.2. Market Analysis, Insights and Forecast - by Types
- 9.2.1. Video and Music
- 9.2.2. Game
- 9.2.3. Education
- 9.2.4. Digital Publication
- 9.2.5. Others
- 9.1. Market Analysis, Insights and Forecast - by Application
- 10. Middle East & Africa Digital Content Analysis, Insights and Forecast, 2020-2032
- 10.1. Market Analysis, Insights and Forecast - by Application
- 10.1.1. Smartphones
- 10.1.2. Computers
- 10.1.3. Smart TV
- 10.1.4. Others
- 10.2. Market Analysis, Insights and Forecast - by Types
- 10.2.1. Video and Music
- 10.2.2. Game
- 10.2.3. Education
- 10.2.4. Digital Publication
- 10.2.5. Others
- 10.1. Market Analysis, Insights and Forecast - by Application
- 11. Asia Pacific Digital Content Analysis, Insights and Forecast, 2020-2032
- 11.1. Market Analysis, Insights and Forecast - by Application
- 11.1.1. Smartphones
- 11.1.2. Computers
- 11.1.3. Smart TV
- 11.1.4. Others
- 11.2. Market Analysis, Insights and Forecast - by Types
- 11.2.1. Video and Music
- 11.2.2. Game
- 11.2.3. Education
- 11.2.4. Digital Publication
- 11.2.5. Others
- 11.1. Market Analysis, Insights and Forecast - by Application
- 12. Competitive Analysis
- 12.1. Company Profiles
- 12.1.1 Tencent
- 12.1.1.1. Company Overview
- 12.1.1.2. Products
- 12.1.1.3. Company Financials
- 12.1.1.4. SWOT Analysis
- 12.1.2 Microsoft
- 12.1.2.1. Company Overview
- 12.1.2.2. Products
- 12.1.2.3. Company Financials
- 12.1.2.4. SWOT Analysis
- 12.1.3 Sony
- 12.1.3.1. Company Overview
- 12.1.3.2. Products
- 12.1.3.3. Company Financials
- 12.1.3.4. SWOT Analysis
- 12.1.4 Activision Blizzard
- 12.1.4.1. Company Overview
- 12.1.4.2. Products
- 12.1.4.3. Company Financials
- 12.1.4.4. SWOT Analysis
- 12.1.5 Apple
- 12.1.5.1. Company Overview
- 12.1.5.2. Products
- 12.1.5.3. Company Financials
- 12.1.5.4. SWOT Analysis
- 12.1.6 Google
- 12.1.6.1. Company Overview
- 12.1.6.2. Products
- 12.1.6.3. Company Financials
- 12.1.6.4. SWOT Analysis
- 12.1.7 Amazon
- 12.1.7.1. Company Overview
- 12.1.7.2. Products
- 12.1.7.3. Company Financials
- 12.1.7.4. SWOT Analysis
- 12.1.8 Facebook
- 12.1.8.1. Company Overview
- 12.1.8.2. Products
- 12.1.8.3. Company Financials
- 12.1.8.4. SWOT Analysis
- 12.1.9 EA
- 12.1.9.1. Company Overview
- 12.1.9.2. Products
- 12.1.9.3. Company Financials
- 12.1.9.4. SWOT Analysis
- 12.1.10 NetEase
- 12.1.10.1. Company Overview
- 12.1.10.2. Products
- 12.1.10.3. Company Financials
- 12.1.10.4. SWOT Analysis
- 12.1.11 Nexon
- 12.1.11.1. Company Overview
- 12.1.11.2. Products
- 12.1.11.3. Company Financials
- 12.1.11.4. SWOT Analysis
- 12.1.12 Mixi
- 12.1.12.1. Company Overview
- 12.1.12.2. Products
- 12.1.12.3. Company Financials
- 12.1.12.4. SWOT Analysis
- 12.1.13 Warner Bros
- 12.1.13.1. Company Overview
- 12.1.13.2. Products
- 12.1.13.3. Company Financials
- 12.1.13.4. SWOT Analysis
- 12.1.14 Square Enix
- 12.1.14.1. Company Overview
- 12.1.14.2. Products
- 12.1.14.3. Company Financials
- 12.1.14.4. SWOT Analysis
- 12.1.15 DeNA
- 12.1.15.1. Company Overview
- 12.1.15.2. Products
- 12.1.15.3. Company Financials
- 12.1.15.4. SWOT Analysis
- 12.1.16 Zynga
- 12.1.16.1. Company Overview
- 12.1.16.2. Products
- 12.1.16.3. Company Financials
- 12.1.16.4. SWOT Analysis
- 12.1.17 NCSoft
- 12.1.17.1. Company Overview
- 12.1.17.2. Products
- 12.1.17.3. Company Financials
- 12.1.17.4. SWOT Analysis
- 12.1.18 Baidu
- 12.1.18.1. Company Overview
- 12.1.18.2. Products
- 12.1.18.3. Company Financials
- 12.1.18.4. SWOT Analysis
- 12.1.19 Deezer
- 12.1.19.1. Company Overview
- 12.1.19.2. Products
- 12.1.19.3. Company Financials
- 12.1.19.4. SWOT Analysis
- 12.1.20 Dish Network
- 12.1.20.1. Company Overview
- 12.1.20.2. Products
- 12.1.20.3. Company Financials
- 12.1.20.4. SWOT Analysis
- 12.1.21 Giant Interactive Group
- 12.1.21.1. Company Overview
- 12.1.21.2. Products
- 12.1.21.3. Company Financials
- 12.1.21.4. SWOT Analysis
- 12.1.22 Hulu
- 12.1.22.1. Company Overview
- 12.1.22.2. Products
- 12.1.22.3. Company Financials
- 12.1.22.4. SWOT Analysis
- 12.1.23 Nintendo
- 12.1.23.1. Company Overview
- 12.1.23.2. Products
- 12.1.23.3. Company Financials
- 12.1.23.4. SWOT Analysis
- 12.1.24 RELX plc
- 12.1.24.1. Company Overview
- 12.1.24.2. Products
- 12.1.24.3. Company Financials
- 12.1.24.4. SWOT Analysis
- 12.1.25 Schibsted
- 12.1.25.1. Company Overview
- 12.1.25.2. Products
- 12.1.25.3. Company Financials
- 12.1.25.4. SWOT Analysis
- 12.1.26 Spotify
- 12.1.26.1. Company Overview
- 12.1.26.2. Products
- 12.1.26.3. Company Financials
- 12.1.26.4. SWOT Analysis
- 12.1.27 Wolters Kluwer
- 12.1.27.1. Company Overview
- 12.1.27.2. Products
- 12.1.27.3. Company Financials
- 12.1.27.4. SWOT Analysis
- 12.1.28 KONAMI
- 12.1.28.1. Company Overview
- 12.1.28.2. Products
- 12.1.28.3. Company Financials
- 12.1.28.4. SWOT Analysis
- 12.1.29 Ubisoft
- 12.1.29.1. Company Overview
- 12.1.29.2. Products
- 12.1.29.3. Company Financials
- 12.1.29.4. SWOT Analysis
- 12.1.30 Bandai Namco
- 12.1.30.1. Company Overview
- 12.1.30.2. Products
- 12.1.30.3. Company Financials
- 12.1.30.4. SWOT Analysis
- 12.1.1 Tencent
- 12.2. Market Entropy
- 12.2.1 Company's Key Areas Served
- 12.2.2 Recent Developments
- 12.3. Company Market Share Analysis 2025
- 12.3.1 Top 5 Companies Market Share Analysis
- 12.3.2 Top 3 Companies Market Share Analysis
- 12.4. List of Potential Customers
- 13. Research Methodology
List of Figures
- Figure 1: Global Digital Content Revenue Breakdown (million, %) by Region 2025 & 2033
- Figure 2: North America Digital Content Revenue (million), by Application 2025 & 2033
- Figure 3: North America Digital Content Revenue Share (%), by Application 2025 & 2033
- Figure 4: North America Digital Content Revenue (million), by Types 2025 & 2033
- Figure 5: North America Digital Content Revenue Share (%), by Types 2025 & 2033
- Figure 6: North America Digital Content Revenue (million), by Country 2025 & 2033
- Figure 7: North America Digital Content Revenue Share (%), by Country 2025 & 2033
- Figure 8: South America Digital Content Revenue (million), by Application 2025 & 2033
- Figure 9: South America Digital Content Revenue Share (%), by Application 2025 & 2033
- Figure 10: South America Digital Content Revenue (million), by Types 2025 & 2033
- Figure 11: South America Digital Content Revenue Share (%), by Types 2025 & 2033
- Figure 12: South America Digital Content Revenue (million), by Country 2025 & 2033
- Figure 13: South America Digital Content Revenue Share (%), by Country 2025 & 2033
- Figure 14: Europe Digital Content Revenue (million), by Application 2025 & 2033
- Figure 15: Europe Digital Content Revenue Share (%), by Application 2025 & 2033
- Figure 16: Europe Digital Content Revenue (million), by Types 2025 & 2033
- Figure 17: Europe Digital Content Revenue Share (%), by Types 2025 & 2033
- Figure 18: Europe Digital Content Revenue (million), by Country 2025 & 2033
- Figure 19: Europe Digital Content Revenue Share (%), by Country 2025 & 2033
- Figure 20: Middle East & Africa Digital Content Revenue (million), by Application 2025 & 2033
- Figure 21: Middle East & Africa Digital Content Revenue Share (%), by Application 2025 & 2033
- Figure 22: Middle East & Africa Digital Content Revenue (million), by Types 2025 & 2033
- Figure 23: Middle East & Africa Digital Content Revenue Share (%), by Types 2025 & 2033
- Figure 24: Middle East & Africa Digital Content Revenue (million), by Country 2025 & 2033
- Figure 25: Middle East & Africa Digital Content Revenue Share (%), by Country 2025 & 2033
- Figure 26: Asia Pacific Digital Content Revenue (million), by Application 2025 & 2033
- Figure 27: Asia Pacific Digital Content Revenue Share (%), by Application 2025 & 2033
- Figure 28: Asia Pacific Digital Content Revenue (million), by Types 2025 & 2033
- Figure 29: Asia Pacific Digital Content Revenue Share (%), by Types 2025 & 2033
- Figure 30: Asia Pacific Digital Content Revenue (million), by Country 2025 & 2033
- Figure 31: Asia Pacific Digital Content Revenue Share (%), by Country 2025 & 2033
List of Tables
- Table 1: Global Digital Content Revenue million Forecast, by Application 2020 & 2033
- Table 2: Global Digital Content Revenue million Forecast, by Types 2020 & 2033
- Table 3: Global Digital Content Revenue million Forecast, by Region 2020 & 2033
- Table 4: Global Digital Content Revenue million Forecast, by Application 2020 & 2033
- Table 5: Global Digital Content Revenue million Forecast, by Types 2020 & 2033
- Table 6: Global Digital Content Revenue million Forecast, by Country 2020 & 2033
- Table 7: United States Digital Content Revenue (million) Forecast, by Application 2020 & 2033
- Table 8: Canada Digital Content Revenue (million) Forecast, by Application 2020 & 2033
- Table 9: Mexico Digital Content Revenue (million) Forecast, by Application 2020 & 2033
- Table 10: Global Digital Content Revenue million Forecast, by Application 2020 & 2033
- Table 11: Global Digital Content Revenue million Forecast, by Types 2020 & 2033
- Table 12: Global Digital Content Revenue million Forecast, by Country 2020 & 2033
- Table 13: Brazil Digital Content Revenue (million) Forecast, by Application 2020 & 2033
- Table 14: Argentina Digital Content Revenue (million) Forecast, by Application 2020 & 2033
- Table 15: Rest of South America Digital Content Revenue (million) Forecast, by Application 2020 & 2033
- Table 16: Global Digital Content Revenue million Forecast, by Application 2020 & 2033
- Table 17: Global Digital Content Revenue million Forecast, by Types 2020 & 2033
- Table 18: Global Digital Content Revenue million Forecast, by Country 2020 & 2033
- Table 19: United Kingdom Digital Content Revenue (million) Forecast, by Application 2020 & 2033
- Table 20: Germany Digital Content Revenue (million) Forecast, by Application 2020 & 2033
- Table 21: France Digital Content Revenue (million) Forecast, by Application 2020 & 2033
- Table 22: Italy Digital Content Revenue (million) Forecast, by Application 2020 & 2033
- Table 23: Spain Digital Content Revenue (million) Forecast, by Application 2020 & 2033
- Table 24: Russia Digital Content Revenue (million) Forecast, by Application 2020 & 2033
- Table 25: Benelux Digital Content Revenue (million) Forecast, by Application 2020 & 2033
- Table 26: Nordics Digital Content Revenue (million) Forecast, by Application 2020 & 2033
- Table 27: Rest of Europe Digital Content Revenue (million) Forecast, by Application 2020 & 2033
- Table 28: Global Digital Content Revenue million Forecast, by Application 2020 & 2033
- Table 29: Global Digital Content Revenue million Forecast, by Types 2020 & 2033
- Table 30: Global Digital Content Revenue million Forecast, by Country 2020 & 2033
- Table 31: Turkey Digital Content Revenue (million) Forecast, by Application 2020 & 2033
- Table 32: Israel Digital Content Revenue (million) Forecast, by Application 2020 & 2033
- Table 33: GCC Digital Content Revenue (million) Forecast, by Application 2020 & 2033
- Table 34: North Africa Digital Content Revenue (million) Forecast, by Application 2020 & 2033
- Table 35: South Africa Digital Content Revenue (million) Forecast, by Application 2020 & 2033
- Table 36: Rest of Middle East & Africa Digital Content Revenue (million) Forecast, by Application 2020 & 2033
- Table 37: Global Digital Content Revenue million Forecast, by Application 2020 & 2033
- Table 38: Global Digital Content Revenue million Forecast, by Types 2020 & 2033
- Table 39: Global Digital Content Revenue million Forecast, by Country 2020 & 2033
- Table 40: China Digital Content Revenue (million) Forecast, by Application 2020 & 2033
- Table 41: India Digital Content Revenue (million) Forecast, by Application 2020 & 2033
- Table 42: Japan Digital Content Revenue (million) Forecast, by Application 2020 & 2033
- Table 43: South Korea Digital Content Revenue (million) Forecast, by Application 2020 & 2033
- Table 44: ASEAN Digital Content Revenue (million) Forecast, by Application 2020 & 2033
- Table 45: Oceania Digital Content Revenue (million) Forecast, by Application 2020 & 2033
- Table 46: Rest of Asia Pacific Digital Content Revenue (million) Forecast, by Application 2020 & 2033
Frequently Asked Questions
1. What is the projected Compound Annual Growth Rate (CAGR) of the Digital Content?
The projected CAGR is approximately 5.9%.
2. Which companies are prominent players in the Digital Content?
Key companies in the market include Tencent, Microsoft, Sony, Activision Blizzard, Apple, Google, Amazon, Facebook, EA, NetEase, Nexon, Mixi, Warner Bros, Square Enix, DeNA, Zynga, NCSoft, Baidu, Deezer, Dish Network, Giant Interactive Group, Hulu, Nintendo, RELX plc, Schibsted, Spotify, Wolters Kluwer, KONAMI, Ubisoft, Bandai Namco.
3. What are the main segments of the Digital Content?
The market segments include Application, Types.
4. Can you provide details about the market size?
The market size is estimated to be USD 182290 million as of 2022.
5. What are some drivers contributing to market growth?
N/A
6. What are the notable trends driving market growth?
N/A
7. Are there any restraints impacting market growth?
N/A
8. Can you provide examples of recent developments in the market?
N/A
9. What pricing options are available for accessing the report?
Pricing options include single-user, multi-user, and enterprise licenses priced at USD 4900.00, USD 7350.00, and USD 9800.00 respectively.
10. Is the market size provided in terms of value or volume?
The market size is provided in terms of value, measured in million.
11. Are there any specific market keywords associated with the report?
Yes, the market keyword associated with the report is "Digital Content," which aids in identifying and referencing the specific market segment covered.
12. How do I determine which pricing option suits my needs best?
The pricing options vary based on user requirements and access needs. Individual users may opt for single-user licenses, while businesses requiring broader access may choose multi-user or enterprise licenses for cost-effective access to the report.
13. Are there any additional resources or data provided in the Digital Content report?
While the report offers comprehensive insights, it's advisable to review the specific contents or supplementary materials provided to ascertain if additional resources or data are available.
14. How can I stay updated on further developments or reports in the Digital Content?
To stay informed about further developments, trends, and reports in the Digital Content, consider subscribing to industry newsletters, following relevant companies and organizations, or regularly checking reputable industry news sources and publications.
Methodology
Step 1 - Identification of Relevant Samples Size from Population Database



Step 2 - Approaches for Defining Global Market Size (Value, Volume* & Price*)

Note*: In applicable scenarios
Step 3 - Data Sources
Primary Research
- Web Analytics
- Survey Reports
- Research Institute
- Latest Research Reports
- Opinion Leaders
Secondary Research
- Annual Reports
- White Paper
- Latest Press Release
- Industry Association
- Paid Database
- Investor Presentations

Step 4 - Data Triangulation
Involves using different sources of information in order to increase the validity of a study
These sources are likely to be stakeholders in a program - participants, other researchers, program staff, other community members, and so on.
Then we put all data in single framework & apply various statistical tools to find out the dynamic on the market.
During the analysis stage, feedback from the stakeholder groups would be compared to determine areas of agreement as well as areas of divergence