

Key Insights
The global casting devices market is projected for substantial growth, anticipating a market size of $295.51 million by 2033, at a Compound Annual Growth Rate (CAGR) of 16.40% from 2025 to 2033. This expansion is primarily driven by the increasing integration of smart TVs and streaming services, catering to consumer demand for seamless mobile-to-large screen content sharing. The surge in online and cloud gaming further fuels demand for high-performance casting devices. Advancements in wireless technologies (Wi-Fi 6, Bluetooth 5) and the availability of affordable, user-friendly devices are enhancing market accessibility. The market is segmented by type (game consoles, media streamers, smart TVs) and end-user (commercial, residential), with the residential sector currently leading market share.
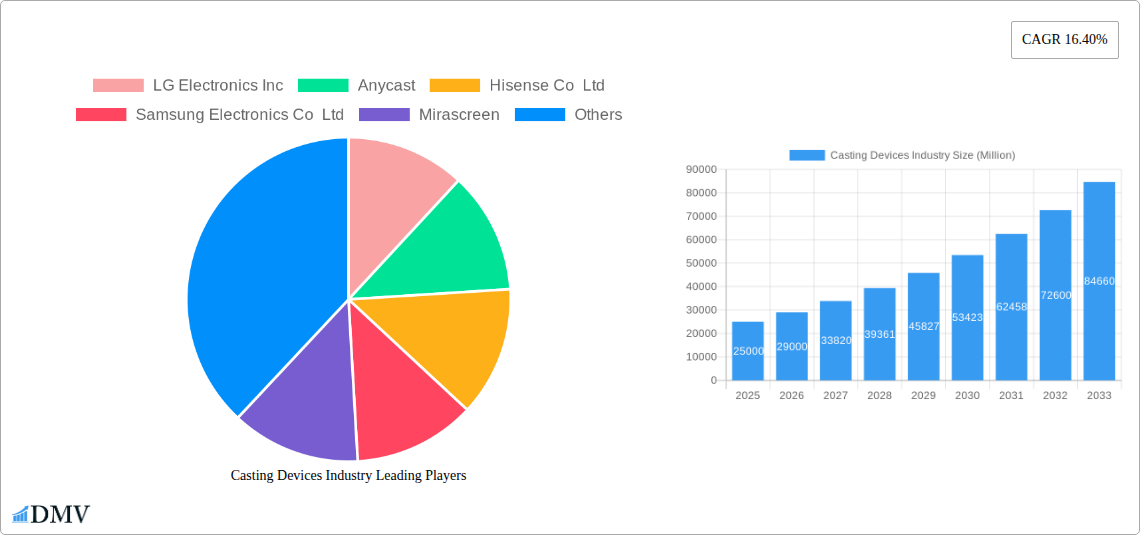
Casting Devices Industry Market Size (In Million)
Key market restraints include potential device and OS compatibility issues and data security concerns. However, ongoing technological advancements are expected to address these challenges. The competitive landscape features major players such as Google, Apple, Amazon, and Samsung, alongside specialized manufacturers. North America and Asia-Pacific are anticipated to remain dominant regions due to high technology adoption and consumer spending power. Future growth will be shaped by continuous innovation, the expansion of streaming services, and the integration of casting capabilities into a wider array of smart home devices.

Casting Devices Industry Company Market Share
Casting Devices Industry: A Comprehensive Market Report (2019-2033)
This insightful report provides a detailed analysis of the global Casting Devices market, offering a comprehensive overview of its current state, future trajectory, and key players. Covering the period from 2019 to 2033, with a focus on 2025, this report is essential for stakeholders seeking to understand and capitalize on opportunities within this dynamic industry. The study encompasses a market valuation exceeding $XX Million in 2025, projected to reach $XX Million by 2033, demonstrating significant growth potential.
Casting Devices Industry Market Composition & Trends
This section delves into the competitive landscape of the casting devices market, analyzing market concentration, innovation drivers, regulatory influences, and the impact of substitute products. We examine end-user profiles (commercial vs. residential) and significant M&A activities, providing a granular understanding of the industry's structure and dynamics.
Market Share Distribution (2025):
- Samsung Electronics Co Ltd: xx%
- Google Inc: xx%
- Amazon com Inc: xx%
- Apple Inc: xx%
- Others: xx%
M&A Activity: The casting devices market has witnessed significant consolidation in recent years, with several notable mergers and acquisitions exceeding $XX Million in deal value. These transactions reflect the strategic importance of securing market share and technological advancements. A detailed analysis of key M&A deals and their impact on market dynamics is provided within the full report.
Innovation Catalysts: Continuous advancements in streaming technology, improved Wi-Fi capabilities, and the rise of 4K and 8K resolution are key drivers of innovation. The integration of AI and IoT capabilities further enhances the functionality and user experience of casting devices.
Regulatory Landscape: Government regulations concerning data privacy, cybersecurity, and broadcasting standards influence the development and deployment of casting devices. The report analyzes the impact of these regulations across major global markets.
Substitute Products: The increasing capabilities of smart TVs and integrated streaming platforms present competitive challenges to standalone casting devices. However, the versatility and affordability of many casting devices continue to drive adoption.
Casting Devices Industry Industry Evolution
This section meticulously analyzes the evolution of the casting devices market from 2019 to 2033, focusing on growth trajectories, technological leaps, and evolving consumer preferences. Detailed examination includes:
- Market Growth Trajectories (CAGR): The global casting devices market experienced a CAGR of xx% during the historical period (2019-2024), and is expected to exhibit a CAGR of xx% during the forecast period (2025-2033). This growth is driven by factors including rising internet penetration, increasing disposable incomes, and growing adoption of smart home technologies.
- Technological Advancements: The transition from low-resolution streaming to high-definition (4K, 8K) streaming, the integration of voice control and AI features, and the increasing adoption of wireless technologies have all played pivotal roles in market development.
- Shifting Consumer Demands: Consumers increasingly demand seamless integration with smart home ecosystems, improved user interfaces, and superior streaming quality. This report analyzes the changing consumer landscape and its impact on product development and market segmentation.
Leading Regions, Countries, or Segments in Casting Devices Industry
This section identifies the leading regions, countries, and segments within the casting devices market, providing a deep dive into the factors driving their dominance.
Dominant Segment: The Smart TVs segment holds the largest market share, driven by increased affordability and widespread adoption of smart TV technology. The Residential end-user segment also displays significant growth, propelled by rising household incomes and the increasing popularity of home entertainment.
Key Drivers for Dominant Regions/Segments:
- North America: High internet penetration, strong consumer spending, and early adoption of smart technologies.
- Asia-Pacific: Rapidly expanding internet access, growing middle class, and increasing demand for affordable entertainment options.
- Europe: Steady growth driven by increasing adoption of smart home devices and government support for digital infrastructure development.
Casting Devices Industry Product Innovations
Recent years have witnessed significant innovations in casting devices, with manufacturers focusing on improved user interfaces, enhanced streaming capabilities (including support for 4K and 8K resolution), and better integration with smart home ecosystems. Integration of AI and voice assistants like Alexa and Google Assistant has added significant value, enhancing user experience and driving market growth. Companies are also focusing on miniaturization and improved energy efficiency, offering more compact and power-saving devices. These innovations continue to fuel market expansion and appeal to a wider range of consumers.
Propelling Factors for Casting Devices Industry Growth
Several factors fuel the growth of the casting devices market:
- Technological Advancements: The ongoing development of higher-resolution streaming technologies, improved wireless connectivity (Wi-Fi 6E and beyond), and the rise of AI-powered features contribute significantly to market expansion.
- Economic Factors: Rising disposable incomes, especially in emerging markets, fuel consumer demand for home entertainment and streaming services.
- Regulatory Support: Government initiatives aimed at fostering digital infrastructure and promoting broadband access create a favorable environment for the industry's growth. For example, government subsidies for internet access in certain regions are driving adoption.
Obstacles in the Casting Devices Industry Market
Despite strong growth prospects, the casting devices market faces several challenges:
- Intense Competition: The market is highly competitive, with established players and emerging companies vying for market share. This intense rivalry can lead to price wars and margin compression.
- Supply Chain Disruptions: Global supply chain disruptions can impact the availability of components and increase production costs, affecting profitability and product availability. This was especially evident during the recent global chip shortage.
- Regulatory Hurdles: Data privacy regulations and content licensing agreements can hinder market expansion in certain regions and impact product development.
Future Opportunities in Casting Devices Industry
Significant opportunities exist for growth in the casting devices market:
- Expansion into Emerging Markets: Untapped potential exists in developing countries with rising internet penetration and growing demand for affordable entertainment options.
- New Technologies: The integration of next-generation wireless technologies (like Li-Fi), advancements in VR/AR integration, and the incorporation of advanced security features offer substantial growth avenues.
- Increased Adoption in Commercial Settings: Casting devices offer opportunities in commercial spaces, such as schools, businesses, and conference rooms for improved presentations and collaboration.
Major Players in the Casting Devices Industry Ecosystem
- LG Electronics Inc
- Anycast
- Hisense Co Ltd
- Samsung Electronics Co Ltd
- Mirascreen
- Microsoft Corporation
- Amazon com Inc
- Airtame ApS
- Roku Inc
- Nvidia Corporation
- Google Inc
- Apple Inc
- EZCast
Key Developments in Casting Devices Industry Industry
- 2023-Q3: Samsung launched its new SmartThings hub with improved casting capabilities.
- 2022-Q4: Google announced a new Chromecast with enhanced HDR support.
- 2021-Q2: Amazon integrated its Fire TV Stick with improved Alexa functionality. (Further key developments are detailed within the full report)
Strategic Casting Devices Industry Market Forecast
The casting devices market is poised for robust growth in the coming years, driven by technological innovations, rising consumer demand, and expansion into new markets. The integration of AI, improved streaming quality, and the expanding adoption of smart home devices will continue to fuel market expansion. Furthermore, the growing need for seamless connectivity and versatile entertainment solutions across various sectors promises significant opportunities for market participants. The report concludes with a detailed forecast outlining the market's trajectory and potential growth areas.
Casting Devices Industry Segmentation
-
1. Type
- 1.1. Game Consoles
- 1.2. Media Streamers
- 1.3. Smart TVs
-
2. End-User
- 2.1. Commercial
- 2.2. Residential
Casting Devices Industry Segmentation By Geography
- 1. North America
- 2. Europe
- 3. Asia Pacific
- 4. Rest of the World
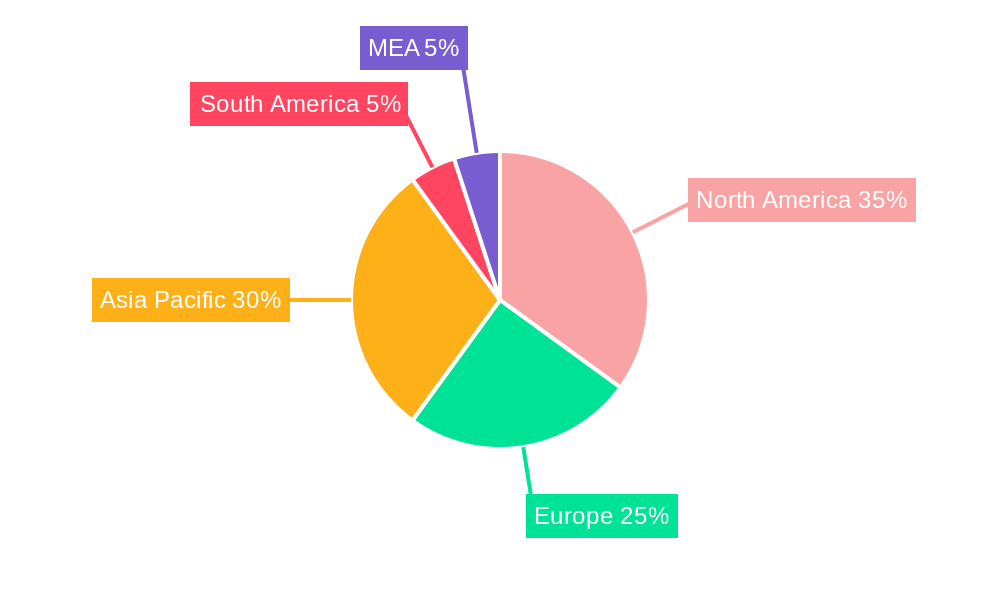
Casting Devices Industry Regional Market Share
Geographic Coverage of Casting Devices Industry
Casting Devices Industry REPORT HIGHLIGHTS
| Aspects | Details |
|---|---|
| Study Period | 2020-2034 |
| Base Year | 2025 |
| Estimated Year | 2026 |
| Forecast Period | 2026-2034 |
| Historical Period | 2020-2025 |
| Growth Rate | CAGR of 7.56% from 2020-2034 |
| Segmentation |
|
Table of Contents
- 1. Introduction
- 1.1. Research Scope
- 1.2. Market Segmentation
- 1.3. Research Objective
- 1.4. Definitions and Assumptions
- 2. Executive Summary
- 2.1. Market Snapshot
- 3. Market Dynamics
- 3.1. Market Drivers
- 3.2. Market Restrains
- 3.3. Market Trends
- 3.4. Market Opportunities
- 4. Market Factor Analysis
- 4.1. Porters Five Forces
- 4.1.1. Bargaining Power of Suppliers
- 4.1.2. Bargaining Power of Buyers
- 4.1.3. Threat of New Entrants
- 4.1.4. Threat of Substitutes
- 4.1.5. Competitive Rivalry
- 4.2. PESTEL analysis
- 4.3. BCG Analysis
- 4.3.1. Stars (High Growth, High Market Share)
- 4.3.2. Cash Cows (Low Growth, High Market Share)
- 4.3.3. Question Mark (High Growth, Low Market Share)
- 4.3.4. Dogs (Low Growth, Low Market Share)
- 4.4. Ansoff Matrix Analysis
- 4.5. Supply Chain Analysis
- 4.6. Regulatory Landscape
- 4.7. Current Market Potential and Opportunity Assessment (TAM–SAM–SOM Framework)
- 4.8. DMV Analyst Note
- 4.1. Porters Five Forces
- 5. Market Analysis, Insights and Forecast 2021-2033
- 5.1. Market Analysis, Insights and Forecast - by Type
- 5.1.1. Game Consoles
- 5.1.2. Media Streamers
- 5.1.3. Smart TVs
- 5.2. Market Analysis, Insights and Forecast - by End-User
- 5.2.1. Commercial
- 5.2.2. Residential
- 5.3. Market Analysis, Insights and Forecast - by Region
- 5.3.1. North America
- 5.3.2. Europe
- 5.3.3. Asia Pacific
- 5.3.4. Rest of the World
- 5.1. Market Analysis, Insights and Forecast - by Type
- 6. Global Casting Devices Industry Analysis, Insights and Forecast, 2021-2033
- 6.1. Market Analysis, Insights and Forecast - by Type
- 6.1.1. Game Consoles
- 6.1.2. Media Streamers
- 6.1.3. Smart TVs
- 6.2. Market Analysis, Insights and Forecast - by End-User
- 6.2.1. Commercial
- 6.2.2. Residential
- 6.1. Market Analysis, Insights and Forecast - by Type
- 7. North America Casting Devices Industry Analysis, Insights and Forecast, 2020-2032
- 7.1. Market Analysis, Insights and Forecast - by Type
- 7.1.1. Game Consoles
- 7.1.2. Media Streamers
- 7.1.3. Smart TVs
- 7.2. Market Analysis, Insights and Forecast - by End-User
- 7.2.1. Commercial
- 7.2.2. Residential
- 7.1. Market Analysis, Insights and Forecast - by Type
- 8. Europe Casting Devices Industry Analysis, Insights and Forecast, 2020-2032
- 8.1. Market Analysis, Insights and Forecast - by Type
- 8.1.1. Game Consoles
- 8.1.2. Media Streamers
- 8.1.3. Smart TVs
- 8.2. Market Analysis, Insights and Forecast - by End-User
- 8.2.1. Commercial
- 8.2.2. Residential
- 8.1. Market Analysis, Insights and Forecast - by Type
- 9. Asia Pacific Casting Devices Industry Analysis, Insights and Forecast, 2020-2032
- 9.1. Market Analysis, Insights and Forecast - by Type
- 9.1.1. Game Consoles
- 9.1.2. Media Streamers
- 9.1.3. Smart TVs
- 9.2. Market Analysis, Insights and Forecast - by End-User
- 9.2.1. Commercial
- 9.2.2. Residential
- 9.1. Market Analysis, Insights and Forecast - by Type
- 10. Rest of the World Casting Devices Industry Analysis, Insights and Forecast, 2020-2032
- 10.1. Market Analysis, Insights and Forecast - by Type
- 10.1.1. Game Consoles
- 10.1.2. Media Streamers
- 10.1.3. Smart TVs
- 10.2. Market Analysis, Insights and Forecast - by End-User
- 10.2.1. Commercial
- 10.2.2. Residential
- 10.1. Market Analysis, Insights and Forecast - by Type
- 11. Competitive Analysis
- 11.1. Company Profiles
- 11.1.1 LG Electronics Inc
- 11.1.1.1. Company Overview
- 11.1.1.2. Products
- 11.1.1.3. Company Financials
- 11.1.1.4. SWOT Analysis
- 11.1.2 Anycast
- 11.1.2.1. Company Overview
- 11.1.2.2. Products
- 11.1.2.3. Company Financials
- 11.1.2.4. SWOT Analysis
- 11.1.3 Hisense Co Ltd
- 11.1.3.1. Company Overview
- 11.1.3.2. Products
- 11.1.3.3. Company Financials
- 11.1.3.4. SWOT Analysis
- 11.1.4 Samsung Electronics Co Ltd
- 11.1.4.1. Company Overview
- 11.1.4.2. Products
- 11.1.4.3. Company Financials
- 11.1.4.4. SWOT Analysis
- 11.1.5 Mirascreen
- 11.1.5.1. Company Overview
- 11.1.5.2. Products
- 11.1.5.3. Company Financials
- 11.1.5.4. SWOT Analysis
- 11.1.6 Microsoft Corporation
- 11.1.6.1. Company Overview
- 11.1.6.2. Products
- 11.1.6.3. Company Financials
- 11.1.6.4. SWOT Analysis
- 11.1.7 Amazon com Inc
- 11.1.7.1. Company Overview
- 11.1.7.2. Products
- 11.1.7.3. Company Financials
- 11.1.7.4. SWOT Analysis
- 11.1.8 Airtame ApS
- 11.1.8.1. Company Overview
- 11.1.8.2. Products
- 11.1.8.3. Company Financials
- 11.1.8.4. SWOT Analysis
- 11.1.9 Roku Inc
- 11.1.9.1. Company Overview
- 11.1.9.2. Products
- 11.1.9.3. Company Financials
- 11.1.9.4. SWOT Analysis
- 11.1.10 Nvidia Corporation
- 11.1.10.1. Company Overview
- 11.1.10.2. Products
- 11.1.10.3. Company Financials
- 11.1.10.4. SWOT Analysis
- 11.1.11 Google Inc
- 11.1.11.1. Company Overview
- 11.1.11.2. Products
- 11.1.11.3. Company Financials
- 11.1.11.4. SWOT Analysis
- 11.1.12 Apple Inc
- 11.1.12.1. Company Overview
- 11.1.12.2. Products
- 11.1.12.3. Company Financials
- 11.1.12.4. SWOT Analysis
- 11.1.13 EZCast
- 11.1.13.1. Company Overview
- 11.1.13.2. Products
- 11.1.13.3. Company Financials
- 11.1.13.4. SWOT Analysis
- 11.1.1 LG Electronics Inc
- 11.2. Market Entropy
- 11.2.1 Company's Key Areas Served
- 11.2.2 Recent Developments
- 11.3. Company Market Share Analysis 2025
- 11.3.1 Top 5 Companies Market Share Analysis
- 11.3.2 Top 3 Companies Market Share Analysis
- 11.4. List of Potential Customers
- 12. Research Methodology
List of Figures
- Figure 1: Global Casting Devices Industry Revenue Breakdown (million, %) by Region 2025 & 2033
- Figure 2: Global Casting Devices Industry Volume Breakdown (K Unit, %) by Region 2025 & 2033
- Figure 3: North America Casting Devices Industry Revenue (million), by Type 2025 & 2033
- Figure 4: North America Casting Devices Industry Volume (K Unit), by Type 2025 & 2033
- Figure 5: North America Casting Devices Industry Revenue Share (%), by Type 2025 & 2033
- Figure 6: North America Casting Devices Industry Volume Share (%), by Type 2025 & 2033
- Figure 7: North America Casting Devices Industry Revenue (million), by End-User 2025 & 2033
- Figure 8: North America Casting Devices Industry Volume (K Unit), by End-User 2025 & 2033
- Figure 9: North America Casting Devices Industry Revenue Share (%), by End-User 2025 & 2033
- Figure 10: North America Casting Devices Industry Volume Share (%), by End-User 2025 & 2033
- Figure 11: North America Casting Devices Industry Revenue (million), by Country 2025 & 2033
- Figure 12: North America Casting Devices Industry Volume (K Unit), by Country 2025 & 2033
- Figure 13: North America Casting Devices Industry Revenue Share (%), by Country 2025 & 2033
- Figure 14: North America Casting Devices Industry Volume Share (%), by Country 2025 & 2033
- Figure 15: Europe Casting Devices Industry Revenue (million), by Type 2025 & 2033
- Figure 16: Europe Casting Devices Industry Volume (K Unit), by Type 2025 & 2033
- Figure 17: Europe Casting Devices Industry Revenue Share (%), by Type 2025 & 2033
- Figure 18: Europe Casting Devices Industry Volume Share (%), by Type 2025 & 2033
- Figure 19: Europe Casting Devices Industry Revenue (million), by End-User 2025 & 2033
- Figure 20: Europe Casting Devices Industry Volume (K Unit), by End-User 2025 & 2033
- Figure 21: Europe Casting Devices Industry Revenue Share (%), by End-User 2025 & 2033
- Figure 22: Europe Casting Devices Industry Volume Share (%), by End-User 2025 & 2033
- Figure 23: Europe Casting Devices Industry Revenue (million), by Country 2025 & 2033
- Figure 24: Europe Casting Devices Industry Volume (K Unit), by Country 2025 & 2033
- Figure 25: Europe Casting Devices Industry Revenue Share (%), by Country 2025 & 2033
- Figure 26: Europe Casting Devices Industry Volume Share (%), by Country 2025 & 2033
- Figure 27: Asia Pacific Casting Devices Industry Revenue (million), by Type 2025 & 2033
- Figure 28: Asia Pacific Casting Devices Industry Volume (K Unit), by Type 2025 & 2033
- Figure 29: Asia Pacific Casting Devices Industry Revenue Share (%), by Type 2025 & 2033
- Figure 30: Asia Pacific Casting Devices Industry Volume Share (%), by Type 2025 & 2033
- Figure 31: Asia Pacific Casting Devices Industry Revenue (million), by End-User 2025 & 2033
- Figure 32: Asia Pacific Casting Devices Industry Volume (K Unit), by End-User 2025 & 2033
- Figure 33: Asia Pacific Casting Devices Industry Revenue Share (%), by End-User 2025 & 2033
- Figure 34: Asia Pacific Casting Devices Industry Volume Share (%), by End-User 2025 & 2033
- Figure 35: Asia Pacific Casting Devices Industry Revenue (million), by Country 2025 & 2033
- Figure 36: Asia Pacific Casting Devices Industry Volume (K Unit), by Country 2025 & 2033
- Figure 37: Asia Pacific Casting Devices Industry Revenue Share (%), by Country 2025 & 2033
- Figure 38: Asia Pacific Casting Devices Industry Volume Share (%), by Country 2025 & 2033
- Figure 39: Rest of the World Casting Devices Industry Revenue (million), by Type 2025 & 2033
- Figure 40: Rest of the World Casting Devices Industry Volume (K Unit), by Type 2025 & 2033
- Figure 41: Rest of the World Casting Devices Industry Revenue Share (%), by Type 2025 & 2033
- Figure 42: Rest of the World Casting Devices Industry Volume Share (%), by Type 2025 & 2033
- Figure 43: Rest of the World Casting Devices Industry Revenue (million), by End-User 2025 & 2033
- Figure 44: Rest of the World Casting Devices Industry Volume (K Unit), by End-User 2025 & 2033
- Figure 45: Rest of the World Casting Devices Industry Revenue Share (%), by End-User 2025 & 2033
- Figure 46: Rest of the World Casting Devices Industry Volume Share (%), by End-User 2025 & 2033
- Figure 47: Rest of the World Casting Devices Industry Revenue (million), by Country 2025 & 2033
- Figure 48: Rest of the World Casting Devices Industry Volume (K Unit), by Country 2025 & 2033
- Figure 49: Rest of the World Casting Devices Industry Revenue Share (%), by Country 2025 & 2033
- Figure 50: Rest of the World Casting Devices Industry Volume Share (%), by Country 2025 & 2033
List of Tables
- Table 1: Global Casting Devices Industry Revenue million Forecast, by Type 2020 & 2033
- Table 2: Global Casting Devices Industry Volume K Unit Forecast, by Type 2020 & 2033
- Table 3: Global Casting Devices Industry Revenue million Forecast, by End-User 2020 & 2033
- Table 4: Global Casting Devices Industry Volume K Unit Forecast, by End-User 2020 & 2033
- Table 5: Global Casting Devices Industry Revenue million Forecast, by Region 2020 & 2033
- Table 6: Global Casting Devices Industry Volume K Unit Forecast, by Region 2020 & 2033
- Table 7: Global Casting Devices Industry Revenue million Forecast, by Type 2020 & 2033
- Table 8: Global Casting Devices Industry Volume K Unit Forecast, by Type 2020 & 2033
- Table 9: Global Casting Devices Industry Revenue million Forecast, by End-User 2020 & 2033
- Table 10: Global Casting Devices Industry Volume K Unit Forecast, by End-User 2020 & 2033
- Table 11: Global Casting Devices Industry Revenue million Forecast, by Country 2020 & 2033
- Table 12: Global Casting Devices Industry Volume K Unit Forecast, by Country 2020 & 2033
- Table 13: Global Casting Devices Industry Revenue million Forecast, by Type 2020 & 2033
- Table 14: Global Casting Devices Industry Volume K Unit Forecast, by Type 2020 & 2033
- Table 15: Global Casting Devices Industry Revenue million Forecast, by End-User 2020 & 2033
- Table 16: Global Casting Devices Industry Volume K Unit Forecast, by End-User 2020 & 2033
- Table 17: Global Casting Devices Industry Revenue million Forecast, by Country 2020 & 2033
- Table 18: Global Casting Devices Industry Volume K Unit Forecast, by Country 2020 & 2033
- Table 19: Global Casting Devices Industry Revenue million Forecast, by Type 2020 & 2033
- Table 20: Global Casting Devices Industry Volume K Unit Forecast, by Type 2020 & 2033
- Table 21: Global Casting Devices Industry Revenue million Forecast, by End-User 2020 & 2033
- Table 22: Global Casting Devices Industry Volume K Unit Forecast, by End-User 2020 & 2033
- Table 23: Global Casting Devices Industry Revenue million Forecast, by Country 2020 & 2033
- Table 24: Global Casting Devices Industry Volume K Unit Forecast, by Country 2020 & 2033
- Table 25: Global Casting Devices Industry Revenue million Forecast, by Type 2020 & 2033
- Table 26: Global Casting Devices Industry Volume K Unit Forecast, by Type 2020 & 2033
- Table 27: Global Casting Devices Industry Revenue million Forecast, by End-User 2020 & 2033
- Table 28: Global Casting Devices Industry Volume K Unit Forecast, by End-User 2020 & 2033
- Table 29: Global Casting Devices Industry Revenue million Forecast, by Country 2020 & 2033
- Table 30: Global Casting Devices Industry Volume K Unit Forecast, by Country 2020 & 2033
Frequently Asked Questions
1. What is the projected Compound Annual Growth Rate (CAGR) of the Casting Devices Industry?
The projected CAGR is approximately 7.56%.
2. Which companies are prominent players in the Casting Devices Industry?
Key companies in the market include LG Electronics Inc, Anycast, Hisense Co Ltd, Samsung Electronics Co Ltd, Mirascreen, Microsoft Corporation, Amazon com Inc , Airtame ApS, Roku Inc, Nvidia Corporation, Google Inc, Apple Inc, EZCast.
3. What are the main segments of the Casting Devices Industry?
The market segments include Type, End-User.
4. Can you provide details about the market size?
The market size is estimated to be USD 295.51 million as of 2022.
5. What are some drivers contributing to market growth?
; Growing Consumption of Video-on-Demand (VoD) Services; Increasing Adoption of Casting Devices with Changing Consumer Behavior.
6. What are the notable trends driving market growth?
Smart TV Segment is expected to occupy a Significant Market Share during the Forecast Period.
7. Are there any restraints impacting market growth?
; Increasing Availability of Native Smart TV Apps.
8. Can you provide examples of recent developments in the market?
N/A
9. What pricing options are available for accessing the report?
Pricing options include single-user, multi-user, and enterprise licenses priced at USD 4750, USD 5250, and USD 8750 respectively.
10. Is the market size provided in terms of value or volume?
The market size is provided in terms of value, measured in million and volume, measured in K Unit.
11. Are there any specific market keywords associated with the report?
Yes, the market keyword associated with the report is "Casting Devices Industry," which aids in identifying and referencing the specific market segment covered.
12. How do I determine which pricing option suits my needs best?
The pricing options vary based on user requirements and access needs. Individual users may opt for single-user licenses, while businesses requiring broader access may choose multi-user or enterprise licenses for cost-effective access to the report.
13. Are there any additional resources or data provided in the Casting Devices Industry report?
While the report offers comprehensive insights, it's advisable to review the specific contents or supplementary materials provided to ascertain if additional resources or data are available.
14. How can I stay updated on further developments or reports in the Casting Devices Industry?
To stay informed about further developments, trends, and reports in the Casting Devices Industry, consider subscribing to industry newsletters, following relevant companies and organizations, or regularly checking reputable industry news sources and publications.
Methodology
Step 1 - Identification of Relevant Samples Size from Population Database


Step 2 - Approaches for Defining Global Market Size (Value, Volume* & Price*)

Note*: In applicable scenarios
Step 3 - Data Sources
Primary Research
- Web Analytics
- Survey Reports
- Research Institute
- Latest Research Reports
- Opinion Leaders
Secondary Research
- Annual Reports
- White Paper
- Latest Press Release
- Industry Association
- Paid Database
- Investor Presentations

Step 4 - Data Triangulation
Involves using different sources of information in order to increase the validity of a study
These sources are likely to be stakeholders in a program - participants, other researchers, program staff, other community members, and so on.
Then we put all data in single framework & apply various statistical tools to find out the dynamic on the market.
During the analysis stage, feedback from the stakeholder groups would be compared to determine areas of agreement as well as areas of divergence