

Key Insights for 3D Sensing Technology Market
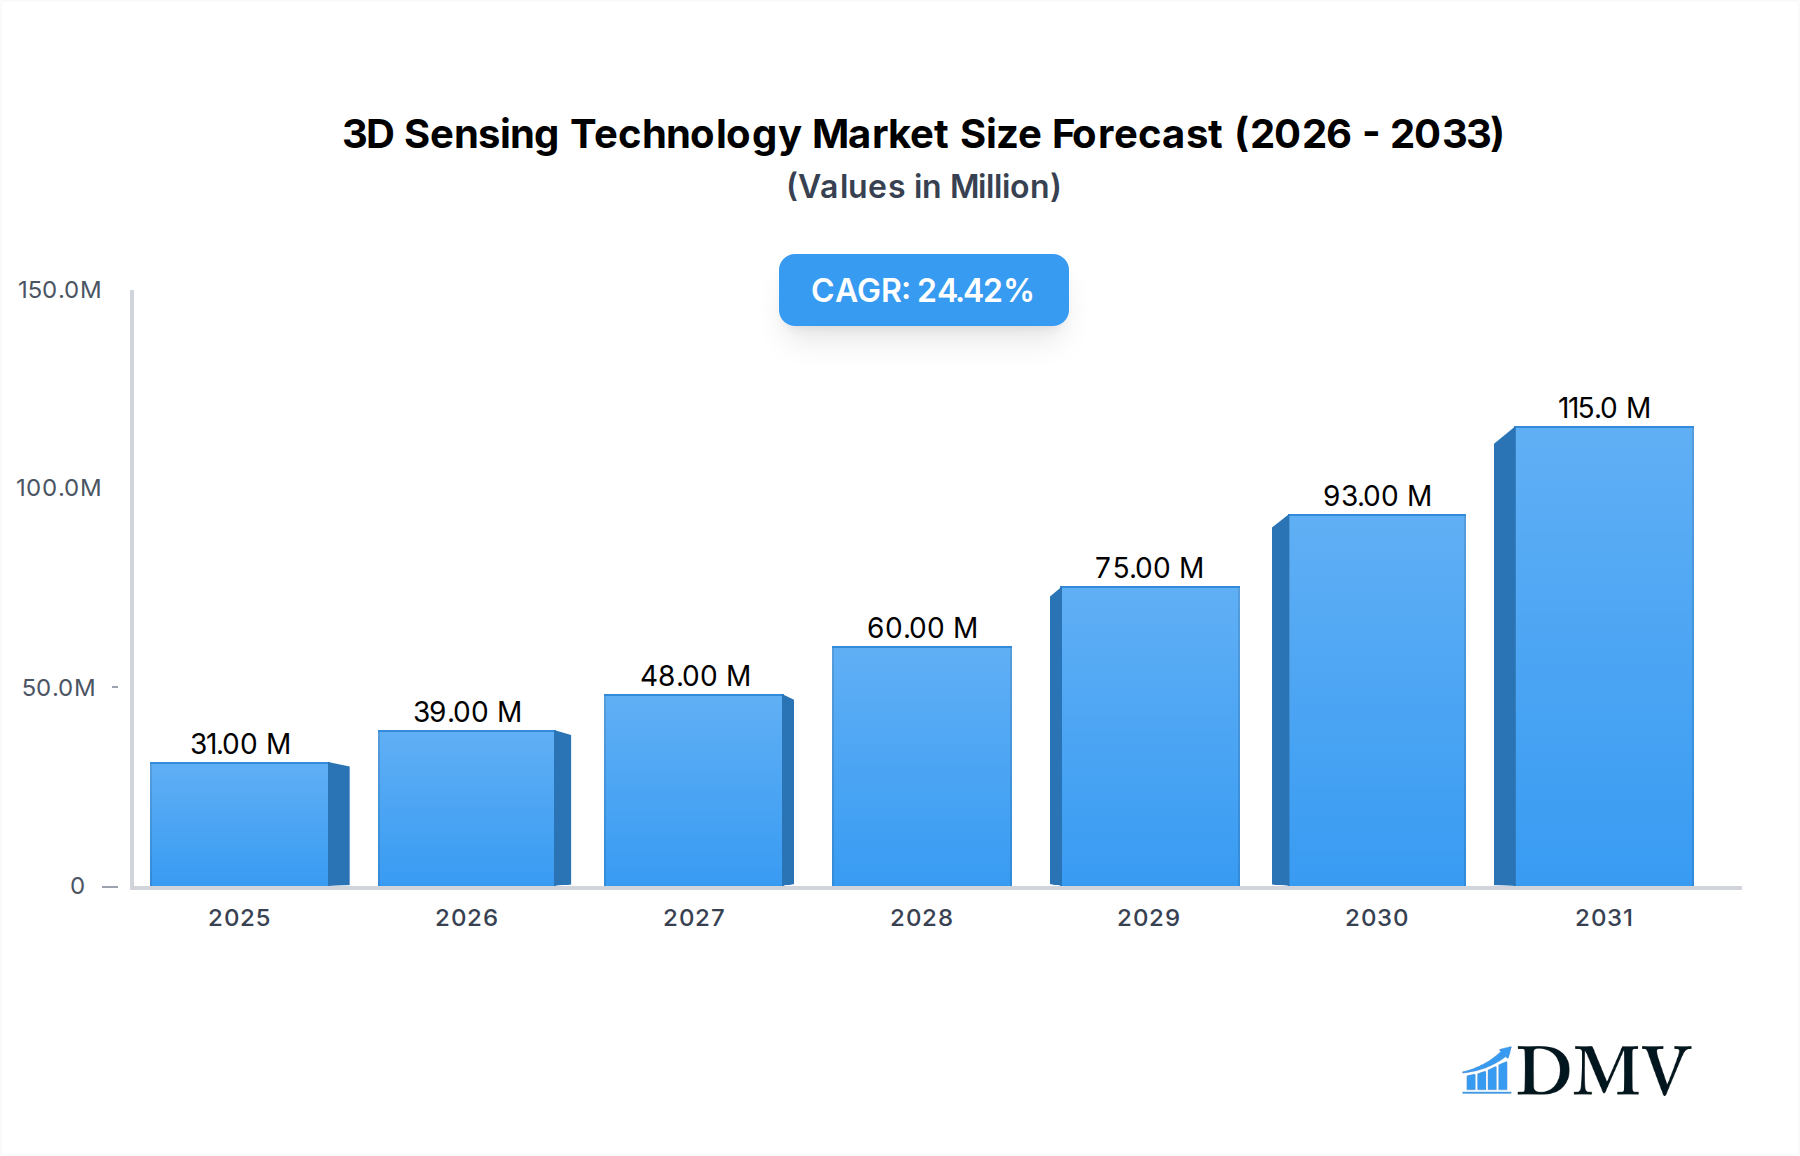
The Global 3D Sensing Technology Market was valued at a substantial $25.3 billion in 2023, setting the stage for an extraordinary expansion over the next decade. Propelled by escalating demand for sophisticated spatial data acquisition and interpretation, the market is poised to demonstrate a remarkable Compound Annual Growth Rate (CAGR) of 24.2% from 2023 to 2034. This aggressive growth trajectory is projected to culminate in a market valuation reaching approximately $256.77 billion by the conclusion of the forecast period. The fundamental impetus behind this robust expansion stems from the pervasive integration of 3D sensing modules across an ever-widening spectrum of applications. In the realm of consumer electronics, the proliferation of smartphones, tablets, and extended reality (XR) devices serves as a significant demand generator, with 3D sensing enabling advanced facial recognition for secure authentication, intuitive gesture recognition, and highly immersive augmented reality (AR) experiences. This drives substantial growth in the Consumer Electronics Market.

3D Sensing Technology Market Size (In Million)
Beyond personal devices, the automotive sector is undergoing a profound transformation, with 3D sensing becoming an indispensable component of Advanced Driver-Assistance Systems (ADAS) and the broader autonomous driving paradigm. These systems rely on accurate real-time environmental mapping and object detection to ensure safety and performance, directly impacting the expansion of the Automotive Sensors Market. Industrially, the adoption of 3D sensing in robotics and automation is revolutionizing manufacturing processes, quality inspection, and logistics. The precision and reliability offered by 3D sensors are critical for tasks ranging from pick-and-place operations to dimensional metrology, reinforcing growth in the Industrial Automation Market.
3D Sensing Technology Company Market Share
Macroeconomic tailwinds further accelerate market momentum. These include the relentless miniaturization of sensor components, making them suitable for integration into compact devices, alongside significant advancements in artificial intelligence and machine learning algorithms that enhance the processing and interpretation of complex 3D data. The growing societal preference for touchless interfaces and immersive digital interactions is also a powerful underlying driver. Technological innovations, particularly within the Time-of-Flight Sensor Market and the Structured Light Market, are continuously improving sensor accuracy, range, and cost-efficiency. Additionally, the increasing sophistication and accessibility of solutions within the LiDAR Technology Market are opening new avenues for large-scale mapping and autonomous navigation. Strategic investments in research and development aimed at overcoming technical challenges such as ambient light interference and power consumption are pivotal to sustaining this growth trajectory, ensuring 3D sensing capabilities become ubiquitous across critical applications globally. The fundamental role of the Semiconductor Sensor Market in providing the underlying components for these advanced systems also cannot be overstated, as continuous innovation in this space enables the next generation of 3D sensing capabilities.
Dominant End-User Segment in 3D Sensing Technology Market
The "Consumer Electronics" segment stands out as the single largest revenue contributor within the Global 3D Sensing Technology Market, consistently capturing the dominant share. This segment's preeminence is primarily attributable to the widespread integration of 3D sensing capabilities into mass-market consumer devices, particularly smartphones and tablets. The initial major impetus came from Apple Inc.'s introduction of Face ID, utilizing structured light technology for secure facial authentication, which rapidly became a benchmark feature. This move catalyzed other smartphone manufacturers to incorporate similar or alternative 3D sensing technologies, such as Time-of-Flight (ToF) sensors, for features like enhanced photography, augmented reality (AR) applications, and gesture recognition. The sheer volume of smartphone shipments globally ensures that this application alone provides a massive installed base and continuous demand for 3D sensing modules. The Consumer Electronics Market continues to be a fertile ground for innovation in 3D sensing.
Beyond smartphones, 3D sensing is increasingly finding its way into other consumer electronic products. This includes virtual reality (VR) and augmented reality (AR) headsets, where precise hand tracking, room mapping, and object interaction are crucial for immersive user experiences. Gaming consoles and accessories also utilize 3D sensing for motion tracking and interactive gameplay. Smart home devices, from security cameras offering advanced presence detection to robots for navigation and interaction, are further expanding the reach of 3D sensing within the consumer sphere. The robust infrastructure for manufacturing and distribution of consumer electronics, coupled with rapid product cycles, allows for quick adoption and iteration of 3D sensing technologies, thereby solidifying this segment's leading position.
Key players contributing to this segment's dominance include component suppliers like Sony Group Corporation, STMicroelectronics, and Infineon Technologies AG, which provide critical sensor arrays and associated hardware. Apple Inc. remains a significant driver through its internal development and strategic sourcing. These companies continuously innovate to offer smaller, more power-efficient, and higher-resolution sensors that meet the stringent demands of consumer applications, especially within the fiercely competitive smartphone industry.
While other segments like automotive and industrial are demonstrating faster growth rates on a percentage basis due to lower initial adoption, the absolute revenue generated by the consumer electronics segment is substantially higher, cementing its status as the foundational pillar of the 3D Sensing Technology Market. Its market share is expected to remain dominant throughout the forecast period, albeit with a gradual increase in the proportional contributions from other high-growth segments. The continuous push for novel user interfaces, more immersive digital experiences, and advanced security features in personal devices ensures sustained innovation and adoption of 3D sensing solutions, driving consistent revenue generation and maintaining the segment's stronghold. The ongoing evolution of the Augmented Reality Market is also intrinsically linked to the advancements in consumer 3D sensing, promising continued expansion.
Key Market Drivers & Constraints in 3D Sensing Technology Market
The Global 3D Sensing Technology Market is propelled by several high-impact drivers, while also navigating specific constraints. A primary driver is the pervasive integration of 3D sensing modules into consumer electronics. The proliferation of smartphones featuring advanced facial recognition and augmented reality capabilities has significantly boosted demand. The adoption of structured light technology for secure authentication and Time-of-Flight (ToF) sensors for enhanced photography and gesture recognition has created a massive addressable market. This trend is amplified by the growth in the Augmented Reality Market, where 3D sensing is fundamental for accurate spatial mapping and object interaction, leading to more immersive user experiences.
Another pivotal driver is the escalating demand from the automotive sector for Advanced Driver-Assistance Systems (ADAS) and autonomous driving functionalities. 3D sensing technologies, including LiDAR and advanced stereoscopic vision systems, are critical for real-time environmental perception and obstacle avoidance. The Automotive Sensors Market is rapidly integrating these technologies to enhance vehicle safety and pave the way for fully autonomous vehicles. For example, the incorporation of LiDAR Technology Market solutions for high-resolution mapping and navigation is becoming standard in next-generation electric and self-driving cars.
Furthermore, the expansion of industrial automation and robotics significantly contributes to market growth. 3D sensing provides robots with enhanced perception for tasks requiring high precision, such as pick-and-place operations and quality inspection. The Industrial Automation Market leverages these sensors to improve operational efficiency, reduce errors, and ensure worker safety. The underlying innovation in the Semiconductor Sensor Market directly supports the development of more robust industrial 3D sensing solutions.
Despite these drivers, the 3D Sensing Technology Market faces notable constraints. The high manufacturing costs associated with specialized components, such as vertical-cavity surface-emitting lasers (VCSELs) for structured light and ToF systems, can limit broader adoption. Additionally, the complexity of integrating 3D sensing hardware and software into diverse platforms, particularly in compact form factors or systems with strict power consumption requirements, poses technical challenges. Finally, data privacy concerns, particularly regarding facial and gesture recognition technologies, can lead to regulatory scrutiny and public apprehension, potentially impacting consumer adoption rates. Addressing these constraints through technological innovation and robust policy frameworks will be crucial.
Competitive Ecosystem of 3D Sensing Technology Market
- Sony Group Corporation: A leading player in the Image Sensors Market, Sony is a key supplier of advanced 3D sensing modules, particularly Time-of-Flight (ToF) sensors, widely adopted in consumer electronics for mobile and gaming applications.
- Apple Inc.: As a major innovator and adopter of 3D sensing, Apple has driven market demand through the integration of structured light technology for Face ID and AR applications in its iPhones and iPads, setting industry benchmarks.
- Intel Corporation: Known for its RealSense depth-sensing cameras, Intel provides a range of 3D sensing solutions for applications across robotics, drones, and virtual reality, focusing on developer accessibility and robust performance.
- Infineon Technologies AG: A significant contributor to the 3D Sensing Technology Market, Infineon specializes in Time-of-Flight (ToF) sensors and chipsets, offering solutions for automotive, industrial, and consumer applications with high accuracy and low power consumption.
- STMicroelectronics: A dominant semiconductor manufacturer, STMicroelectronics is a crucial supplier of advanced 3D sensing solutions, including Time-of-Flight (ToF) and global shutter image sensors, catering to consumer, industrial, and automotive segments.
- Texas Instruments Incorporated: Texas Instruments offers a broad portfolio of semiconductor components vital for 3D sensing systems, including DLP technology for structured light and various analog and embedded processing solutions for data interpretation.
- Microsoft Corporation: Through its Azure Kinect platform and HoloLens mixed reality headsets, Microsoft leverages and develops sophisticated 3D sensing technologies for enterprise applications, cloud integration, and immersive computing.
- OmniVision Technologies, Inc.: OmniVision specializes in advanced digital imaging solutions, including various Image Sensors Market components essential for 3D sensing, serving automotive, medical, and consumer electronics markets with compact and high-performance designs.
- Lumentum Holdings Inc.: A leading provider of optical components, Lumentum is critical for the 3D Sensing Technology Market, supplying VCSEL arrays that are fundamental for structured light and Time-of-Flight (ToF) systems in consumer and automotive applications.
- Basler AG: Basler is a major manufacturer of industrial cameras, including 3D vision systems that utilize various sensing principles for demanding applications in factory automation, quality control, and logistics within the Industrial Automation Market.
- Cognex Corporation: Specializing in machine vision systems, Cognex offers advanced 3D vision sensors and software for high-precision quality inspection, robot guidance, and measurement tasks across various industrial sectors.
- Teledyne Technologies Incorporated: Through its subsidiaries, Teledyne provides a comprehensive range of sophisticated imaging solutions, including high-performance 3D sensors and cameras for aerospace, defense, industrial, and scientific applications.
- Others: This category encompasses a diverse array of niche players, startups, and specialized component manufacturers contributing to specific sub-segments and emerging applications within the evolving 3D Sensing Technology Market.
Recent Developments & Milestones in 3D Sensing Technology Market
- October 2024: Leading semiconductor manufacturers announced the release of next-generation Time-of-Flight (ToF) sensor modules, offering enhanced resolution and reduced power consumption, primarily targeting the burgeoning Augmented Reality Market and compact consumer devices.
- August 2024: A major automotive Tier-1 supplier forged a strategic partnership with a LiDAR Technology Market specialist to integrate advanced 3D perception systems into upcoming electric vehicle platforms, aiming for Level 3 autonomous driving capabilities.
- May 2024: Innovations in structured light projection technology enabled the development of smaller, more robust 3D sensing units, facilitating their adoption in compact industrial quality inspection systems and accelerating growth in the Industrial Automation Market.
- February 2024: A consortium of universities and industry partners secured significant funding for R&D into quantum-dot based Image Sensors Market, promising breakthroughs in sensitivity and signal-to-noise ratio for low-light 3D sensing applications.
- November 2023: A prominent consumer electronics firm launched a new range of smart home devices featuring integrated 3D proximity sensors, enhancing user interaction and security by accurately mapping indoor environments without privacy concerns.
- September 2023: Advancements in the Semiconductor Sensor Market led to the commercial availability of more cost-effective and miniaturized 3D sensor arrays, making sophisticated 3D sensing capabilities accessible to a broader range of mid-tier consumer electronics products.
- July 2023: A significant breakthrough in computational 3D imaging allowed for higher accuracy and faster processing of point cloud data from existing 3D sensors, boosting their performance without requiring extensive hardware upgrades.
- April 2023: Several startups in the 3D Sensing Technology Market secured venture capital funding rounds, with investments largely focused on developing novel Time-of-Flight Sensor Market solutions for industrial robotics and healthcare applications.
Regional Market Breakdown for 3D Sensing Technology Market
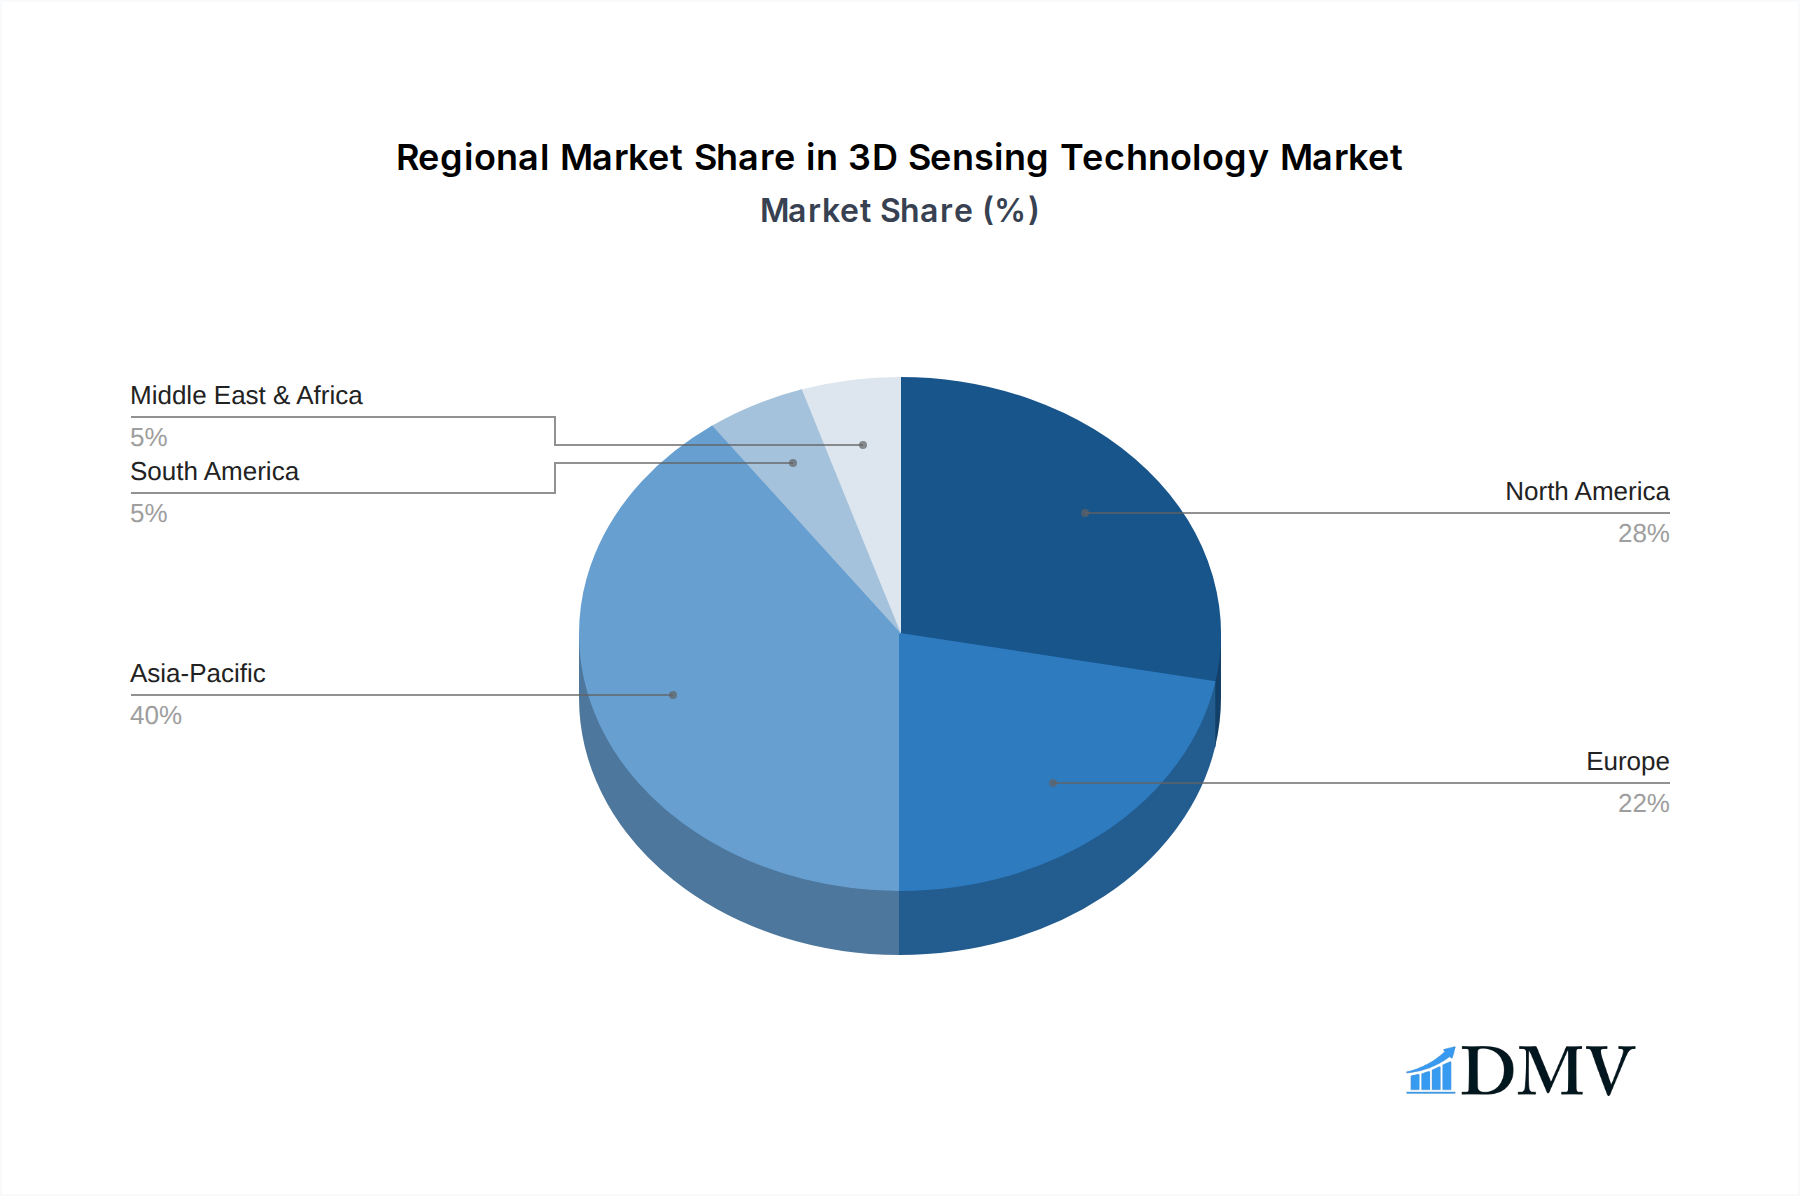
The Global 3D Sensing Technology Market exhibits diverse growth patterns and adoption rates across key regions.
Asia Pacific is anticipated to be the fastest-growing region, projected to register a CAGR exceeding 28.0% over the forecast period. This rapid expansion is primarily driven by the region's dominant position in consumer electronics manufacturing and high demand for smartphones, augmented reality devices, and gaming consoles. Countries like China, Japan, and South Korea are at the forefront of adopting and developing 3D sensing technologies, fueled by a large population base and rapid industrialization. The robust expansion of the Consumer Electronics Market and increasing integration of 3D vision in smart cities and industrial automation are key demand drivers.
North America currently holds the largest revenue share in the 3D Sensing Technology Market, attributed to early and extensive adoption across key industries. The region is characterized by significant R&D investments, a strong presence of technology giants, and high penetration of advanced automotive safety systems. Demand is particularly strong from the Automotive Sensors Market for ADAS and autonomous vehicle development, alongside a thriving Augmented Reality Market and burgeoning applications in healthcare and industrial robotics. North America is considered a mature market but continues to innovate.
Europe represents a significant market, driven by its robust industrial sector and advanced automotive manufacturing capabilities. The region is witnessing increasing adoption of 3D sensing in factory automation, quality control, and logistics, bolstering the Industrial Automation Market. European initiatives in smart manufacturing and Industry 4.0 provide a strong foundation for the integration of 3D vision systems. Growth here is steady, focusing on precision and reliability.
Middle East & Africa and South America are emerging markets for 3D sensing technology, currently holding smaller shares but demonstrating promising growth potential. In the Middle East & Africa, investment in smart city projects and digitalization initiatives, particularly in the GCC countries, is gradually driving demand. In South America, nascent industrialization and increasing smartphone penetration are creating opportunities. Growth in these regions is primarily driven by expanding consumer electronics and foundational industrial upgrades. Overall, Asia Pacific will be the primary engine of growth, influencing global trends in the Time-of-Flight Sensor Market and Structured Light Market alike.
3D Sensing Technology Regional Market Share
Investment & Funding Activity in 3D Sensing Technology Market
The 3D Sensing Technology Market has witnessed substantial investment and funding activity over the past 2-3 years, reflecting growing confidence in its transformative potential across various sectors. Venture capital (VC) funding rounds have primarily targeted startups innovating in novel sensor designs and advanced algorithms. For instance, companies specializing in compact and high-resolution Time-of-Flight (ToF) sensors have attracted significant capital, aiming to improve performance for mobile devices and extended reality (XR) applications. The Augmented Reality Market, in particular, has seen considerable investment, with funding channeled into firms developing precise 3D mapping and interaction technologies crucial for next-generation AR glasses and platforms.
Mergers and acquisitions (M&A) have also been a notable feature, with larger technology conglomerates acquiring smaller, specialized firms to bolster their intellectual property portfolios and gain market share in specific niches. This trend is particularly evident in the Automotive Sensors Market, where major Tier-1 suppliers and automotive OEMs have acquired LiDAR Technology Market developers to integrate advanced perception capabilities directly into their autonomous driving platforms. These strategic acquisitions aim to secure supply chains and accelerate the development of ADAS functionalities.
Furthermore, strategic partnerships between hardware manufacturers and software developers have become crucial. Semiconductor Sensor Market leaders are collaborating with AI and machine learning specialists to enhance the processing and interpretation of 3D data, leading to more intelligent and efficient sensing solutions. Partnerships between industrial automation integrators and 3D vision system providers are also common, aiming to deploy advanced solutions for robotics, quality inspection, and logistics, thereby strengthening the Industrial Automation Market. These collaborative efforts underscore a concerted push to mature the technology, reduce costs, and expand its applicability across new and existing end-user segments, signaling a healthy, albeit consolidating, investment landscape.
Technology Innovation Trajectory in 3D Sensing Technology Market
The 3D Sensing Technology Market is characterized by a dynamic innovation trajectory, with several disruptive technologies continually pushing the boundaries of spatial perception. Among the most prominent are Time-of-Flight (ToF) sensors, Structured Light systems, and LiDAR (Light Detection and Ranging).
Time-of-Flight (ToF) sensors represent a significant area of innovation. These sensors measure the time it takes for a light signal (typically infrared) to travel from the sensor to an object and back, thereby calculating distance. Recent R&D efforts in the Time-of-Flight Sensor Market are focused on improving resolution, increasing frame rates, and enhancing ambient light immunity, making them more robust for outdoor and challenging indoor environments. Adoption timelines are accelerating, particularly in consumer electronics for facial recognition, gesture control, and compact AR/VR devices, as well as in industrial automation for basic object detection and volume measurement. They reinforce incumbent business models by offering a cost-effective and compact 3D sensing solution that can be integrated into high-volume products.
Structured Light systems, widely adopted for highly accurate close-range applications, project a known pattern of light onto a scene and analyze the deformation of that pattern to infer depth. Innovations in the Structured Light Market are centered on miniaturization of projectors (like VCSEL arrays), improved processing algorithms, and enhanced robustness to varying surface textures. While widely utilized in devices for secure facial authentication, their adoption is also expanding into high-precision industrial inspection and medical imaging. These systems reinforce business models requiring extreme precision over short distances, though their outdoor performance can be limited.
LiDAR Technology Market is a third disruptive force, especially for long-range and high-resolution mapping. LiDAR systems emit pulsed lasers and measure the time for the reflected light to return, creating detailed 3D point clouds. R&D in LiDAR is heavily driven by the Automotive Sensors Market, aiming to reduce costs, shrink form factors (e.g., solid-state LiDAR), and improve reliability for autonomous driving applications. Adoption timelines are rapid in automotive, robotics, and mapping industries. While initially high-cost, advancements in the Semiconductor Sensor Market are enabling more affordable and compact LiDAR solutions, threatening traditional radar and camera-only perception systems by offering superior depth accuracy and environmental understanding, thereby reinforcing new business models centered on advanced autonomy. These innovations collectively define the future landscape of the 3D Sensing Technology Market.
3D Sensing Technology Segmentation
-
1. Technology
- 1.1. Time-of-Flight (ToF)
- 1.2. Structured Light
- 1.3. Stereoscopic Vision
- 1.4. Ultrasound
- 1.5. Others
-
2. Sensor Type
- 2.1. Image Sensors
- 2.2. Position Sensors
- 2.3. Proximity Sensors
- 2.4. Acoustic Sensors
- 2.5. Accelerometers/Gyroscopes
- 2.6. Others
-
3. Connectivity
- 3.1. Wired
- 3.2. Wireless
-
4. Application
- 4.1. Facial Recognition
- 4.2. Gesture Recognition
- 4.3. Object Detection
- 4.4. Quality Inspection
- 4.5. Mapping & Navigation
- 4.6. Others
-
5. End User
- 5.1. Consumer Electronics
- 5.2. Automotive
- 5.3. Industrial
- 5.4. Healthcare
- 5.5. Aerospace & Defense
- 5.6. Others
3D Sensing Technology Segmentation By Geography
-
1. North America
- 1.1. United States
- 1.2. Canada
- 1.3. Mexico
-
2. South America
- 2.1. Brazil
- 2.2. Argentina
- 2.3. Rest of South America
-
3. Europe
- 3.1. United Kingdom
- 3.2. Germany
- 3.3. France
- 3.4. Italy
- 3.5. Spain
- 3.6. Russia
- 3.7. Benelux
- 3.8. Nordics
- 3.9. Rest of Europe
-
4. Middle East & Africa
- 4.1. Turkey
- 4.2. Israel
- 4.3. GCC
- 4.4. North Africa
- 4.5. South Africa
- 4.6. Rest of Middle East & Africa
-
5. Asia Pacific
- 5.1. China
- 5.2. India
- 5.3. Japan
- 5.4. South Korea
- 5.5. ASEAN
- 5.6. Oceania
- 5.7. Rest of Asia Pacific
3D Sensing Technology Regional Market Share
Geographic Coverage of 3D Sensing Technology
3D Sensing Technology REPORT HIGHLIGHTS
| Aspects | Details |
|---|---|
| Study Period | 2020-2034 |
| Base Year | 2025 |
| Estimated Year | 2026 |
| Forecast Period | 2026-2034 |
| Historical Period | 2020-2025 |
| Growth Rate | CAGR of 24.2% from 2020-2034 |
| Segmentation |
|
Table of Contents
- 1. Introduction
- 1.1. Research Scope
- 1.2. Market Segmentation
- 1.3. Research Objective
- 1.4. Definitions and Assumptions
- 2. Executive Summary
- 2.1. Market Snapshot
- 3. Market Dynamics
- 3.1. Market Drivers
- 3.2. Market Restrains
- 3.3. Market Trends
- 3.4. Market Opportunities
- 4. Market Factor Analysis
- 4.1. Porters Five Forces
- 4.1.1. Bargaining Power of Suppliers
- 4.1.2. Bargaining Power of Buyers
- 4.1.3. Threat of New Entrants
- 4.1.4. Threat of Substitutes
- 4.1.5. Competitive Rivalry
- 4.2. PESTEL analysis
- 4.3. BCG Analysis
- 4.3.1. Stars (High Growth, High Market Share)
- 4.3.2. Cash Cows (Low Growth, High Market Share)
- 4.3.3. Question Mark (High Growth, Low Market Share)
- 4.3.4. Dogs (Low Growth, Low Market Share)
- 4.4. Ansoff Matrix Analysis
- 4.5. Supply Chain Analysis
- 4.6. Regulatory Landscape
- 4.7. Current Market Potential and Opportunity Assessment (TAM–SAM–SOM Framework)
- 4.8. DMV Analyst Note
- 4.1. Porters Five Forces
- 5. Market Analysis, Insights and Forecast 2021-2033
- 5.1. Market Analysis, Insights and Forecast - by Technology
- 5.1.1. Time-of-Flight (ToF)
- 5.1.2. Structured Light
- 5.1.3. Stereoscopic Vision
- 5.1.4. Ultrasound
- 5.1.5. Others
- 5.2. Market Analysis, Insights and Forecast - by Sensor Type
- 5.2.1. Image Sensors
- 5.2.2. Position Sensors
- 5.2.3. Proximity Sensors
- 5.2.4. Acoustic Sensors
- 5.2.5. Accelerometers/Gyroscopes
- 5.2.6. Others
- 5.3. Market Analysis, Insights and Forecast - by Connectivity
- 5.3.1. Wired
- 5.3.2. Wireless
- 5.4. Market Analysis, Insights and Forecast - by Application
- 5.4.1. Facial Recognition
- 5.4.2. Gesture Recognition
- 5.4.3. Object Detection
- 5.4.4. Quality Inspection
- 5.4.5. Mapping & Navigation
- 5.4.6. Others
- 5.5. Market Analysis, Insights and Forecast - by End User
- 5.5.1. Consumer Electronics
- 5.5.2. Automotive
- 5.5.3. Industrial
- 5.5.4. Healthcare
- 5.5.5. Aerospace & Defense
- 5.5.6. Others
- 5.6. Market Analysis, Insights and Forecast - by Region
- 5.6.1. North America
- 5.6.2. South America
- 5.6.3. Europe
- 5.6.4. Middle East & Africa
- 5.6.5. Asia Pacific
- 5.1. Market Analysis, Insights and Forecast - by Technology
- 6. Global 3D Sensing Technology Analysis, Insights and Forecast, 2021-2033
- 6.1. Market Analysis, Insights and Forecast - by Technology
- 6.1.1. Time-of-Flight (ToF)
- 6.1.2. Structured Light
- 6.1.3. Stereoscopic Vision
- 6.1.4. Ultrasound
- 6.1.5. Others
- 6.2. Market Analysis, Insights and Forecast - by Sensor Type
- 6.2.1. Image Sensors
- 6.2.2. Position Sensors
- 6.2.3. Proximity Sensors
- 6.2.4. Acoustic Sensors
- 6.2.5. Accelerometers/Gyroscopes
- 6.2.6. Others
- 6.3. Market Analysis, Insights and Forecast - by Connectivity
- 6.3.1. Wired
- 6.3.2. Wireless
- 6.4. Market Analysis, Insights and Forecast - by Application
- 6.4.1. Facial Recognition
- 6.4.2. Gesture Recognition
- 6.4.3. Object Detection
- 6.4.4. Quality Inspection
- 6.4.5. Mapping & Navigation
- 6.4.6. Others
- 6.5. Market Analysis, Insights and Forecast - by End User
- 6.5.1. Consumer Electronics
- 6.5.2. Automotive
- 6.5.3. Industrial
- 6.5.4. Healthcare
- 6.5.5. Aerospace & Defense
- 6.5.6. Others
- 6.1. Market Analysis, Insights and Forecast - by Technology
- 7. North America 3D Sensing Technology Analysis, Insights and Forecast, 2020-2032
- 7.1. Market Analysis, Insights and Forecast - by Technology
- 7.1.1. Time-of-Flight (ToF)
- 7.1.2. Structured Light
- 7.1.3. Stereoscopic Vision
- 7.1.4. Ultrasound
- 7.1.5. Others
- 7.2. Market Analysis, Insights and Forecast - by Sensor Type
- 7.2.1. Image Sensors
- 7.2.2. Position Sensors
- 7.2.3. Proximity Sensors
- 7.2.4. Acoustic Sensors
- 7.2.5. Accelerometers/Gyroscopes
- 7.2.6. Others
- 7.3. Market Analysis, Insights and Forecast - by Connectivity
- 7.3.1. Wired
- 7.3.2. Wireless
- 7.4. Market Analysis, Insights and Forecast - by Application
- 7.4.1. Facial Recognition
- 7.4.2. Gesture Recognition
- 7.4.3. Object Detection
- 7.4.4. Quality Inspection
- 7.4.5. Mapping & Navigation
- 7.4.6. Others
- 7.5. Market Analysis, Insights and Forecast - by End User
- 7.5.1. Consumer Electronics
- 7.5.2. Automotive
- 7.5.3. Industrial
- 7.5.4. Healthcare
- 7.5.5. Aerospace & Defense
- 7.5.6. Others
- 7.1. Market Analysis, Insights and Forecast - by Technology
- 8. South America 3D Sensing Technology Analysis, Insights and Forecast, 2020-2032
- 8.1. Market Analysis, Insights and Forecast - by Technology
- 8.1.1. Time-of-Flight (ToF)
- 8.1.2. Structured Light
- 8.1.3. Stereoscopic Vision
- 8.1.4. Ultrasound
- 8.1.5. Others
- 8.2. Market Analysis, Insights and Forecast - by Sensor Type
- 8.2.1. Image Sensors
- 8.2.2. Position Sensors
- 8.2.3. Proximity Sensors
- 8.2.4. Acoustic Sensors
- 8.2.5. Accelerometers/Gyroscopes
- 8.2.6. Others
- 8.3. Market Analysis, Insights and Forecast - by Connectivity
- 8.3.1. Wired
- 8.3.2. Wireless
- 8.4. Market Analysis, Insights and Forecast - by Application
- 8.4.1. Facial Recognition
- 8.4.2. Gesture Recognition
- 8.4.3. Object Detection
- 8.4.4. Quality Inspection
- 8.4.5. Mapping & Navigation
- 8.4.6. Others
- 8.5. Market Analysis, Insights and Forecast - by End User
- 8.5.1. Consumer Electronics
- 8.5.2. Automotive
- 8.5.3. Industrial
- 8.5.4. Healthcare
- 8.5.5. Aerospace & Defense
- 8.5.6. Others
- 8.1. Market Analysis, Insights and Forecast - by Technology
- 9. Europe 3D Sensing Technology Analysis, Insights and Forecast, 2020-2032
- 9.1. Market Analysis, Insights and Forecast - by Technology
- 9.1.1. Time-of-Flight (ToF)
- 9.1.2. Structured Light
- 9.1.3. Stereoscopic Vision
- 9.1.4. Ultrasound
- 9.1.5. Others
- 9.2. Market Analysis, Insights and Forecast - by Sensor Type
- 9.2.1. Image Sensors
- 9.2.2. Position Sensors
- 9.2.3. Proximity Sensors
- 9.2.4. Acoustic Sensors
- 9.2.5. Accelerometers/Gyroscopes
- 9.2.6. Others
- 9.3. Market Analysis, Insights and Forecast - by Connectivity
- 9.3.1. Wired
- 9.3.2. Wireless
- 9.4. Market Analysis, Insights and Forecast - by Application
- 9.4.1. Facial Recognition
- 9.4.2. Gesture Recognition
- 9.4.3. Object Detection
- 9.4.4. Quality Inspection
- 9.4.5. Mapping & Navigation
- 9.4.6. Others
- 9.5. Market Analysis, Insights and Forecast - by End User
- 9.5.1. Consumer Electronics
- 9.5.2. Automotive
- 9.5.3. Industrial
- 9.5.4. Healthcare
- 9.5.5. Aerospace & Defense
- 9.5.6. Others
- 9.1. Market Analysis, Insights and Forecast - by Technology
- 10. Middle East & Africa 3D Sensing Technology Analysis, Insights and Forecast, 2020-2032
- 10.1. Market Analysis, Insights and Forecast - by Technology
- 10.1.1. Time-of-Flight (ToF)
- 10.1.2. Structured Light
- 10.1.3. Stereoscopic Vision
- 10.1.4. Ultrasound
- 10.1.5. Others
- 10.2. Market Analysis, Insights and Forecast - by Sensor Type
- 10.2.1. Image Sensors
- 10.2.2. Position Sensors
- 10.2.3. Proximity Sensors
- 10.2.4. Acoustic Sensors
- 10.2.5. Accelerometers/Gyroscopes
- 10.2.6. Others
- 10.3. Market Analysis, Insights and Forecast - by Connectivity
- 10.3.1. Wired
- 10.3.2. Wireless
- 10.4. Market Analysis, Insights and Forecast - by Application
- 10.4.1. Facial Recognition
- 10.4.2. Gesture Recognition
- 10.4.3. Object Detection
- 10.4.4. Quality Inspection
- 10.4.5. Mapping & Navigation
- 10.4.6. Others
- 10.5. Market Analysis, Insights and Forecast - by End User
- 10.5.1. Consumer Electronics
- 10.5.2. Automotive
- 10.5.3. Industrial
- 10.5.4. Healthcare
- 10.5.5. Aerospace & Defense
- 10.5.6. Others
- 10.1. Market Analysis, Insights and Forecast - by Technology
- 11. Asia Pacific 3D Sensing Technology Analysis, Insights and Forecast, 2020-2032
- 11.1. Market Analysis, Insights and Forecast - by Technology
- 11.1.1. Time-of-Flight (ToF)
- 11.1.2. Structured Light
- 11.1.3. Stereoscopic Vision
- 11.1.4. Ultrasound
- 11.1.5. Others
- 11.2. Market Analysis, Insights and Forecast - by Sensor Type
- 11.2.1. Image Sensors
- 11.2.2. Position Sensors
- 11.2.3. Proximity Sensors
- 11.2.4. Acoustic Sensors
- 11.2.5. Accelerometers/Gyroscopes
- 11.2.6. Others
- 11.3. Market Analysis, Insights and Forecast - by Connectivity
- 11.3.1. Wired
- 11.3.2. Wireless
- 11.4. Market Analysis, Insights and Forecast - by Application
- 11.4.1. Facial Recognition
- 11.4.2. Gesture Recognition
- 11.4.3. Object Detection
- 11.4.4. Quality Inspection
- 11.4.5. Mapping & Navigation
- 11.4.6. Others
- 11.5. Market Analysis, Insights and Forecast - by End User
- 11.5.1. Consumer Electronics
- 11.5.2. Automotive
- 11.5.3. Industrial
- 11.5.4. Healthcare
- 11.5.5. Aerospace & Defense
- 11.5.6. Others
- 11.1. Market Analysis, Insights and Forecast - by Technology
- 12. Competitive Analysis
- 12.1. Company Profiles
- 12.1.1 Sony Group Corporation
- 12.1.1.1. Company Overview
- 12.1.1.2. Products
- 12.1.1.3. Company Financials
- 12.1.1.4. SWOT Analysis
- 12.1.2 Apple Inc.
- 12.1.2.1. Company Overview
- 12.1.2.2. Products
- 12.1.2.3. Company Financials
- 12.1.2.4. SWOT Analysis
- 12.1.3 Intel Corporation
- 12.1.3.1. Company Overview
- 12.1.3.2. Products
- 12.1.3.3. Company Financials
- 12.1.3.4. SWOT Analysis
- 12.1.4 Infineon Technologies AG
- 12.1.4.1. Company Overview
- 12.1.4.2. Products
- 12.1.4.3. Company Financials
- 12.1.4.4. SWOT Analysis
- 12.1.5 STMicroelectronics
- 12.1.5.1. Company Overview
- 12.1.5.2. Products
- 12.1.5.3. Company Financials
- 12.1.5.4. SWOT Analysis
- 12.1.6 Texas Instruments Incorporated
- 12.1.6.1. Company Overview
- 12.1.6.2. Products
- 12.1.6.3. Company Financials
- 12.1.6.4. SWOT Analysis
- 12.1.7 Microsoft Corporation
- 12.1.7.1. Company Overview
- 12.1.7.2. Products
- 12.1.7.3. Company Financials
- 12.1.7.4. SWOT Analysis
- 12.1.8 OmniVision Technologies Inc.
- 12.1.8.1. Company Overview
- 12.1.8.2. Products
- 12.1.8.3. Company Financials
- 12.1.8.4. SWOT Analysis
- 12.1.9 Lumentum Holdings Inc.
- 12.1.9.1. Company Overview
- 12.1.9.2. Products
- 12.1.9.3. Company Financials
- 12.1.9.4. SWOT Analysis
- 12.1.10 Basler AG
- 12.1.10.1. Company Overview
- 12.1.10.2. Products
- 12.1.10.3. Company Financials
- 12.1.10.4. SWOT Analysis
- 12.1.11 Cognex Corporation
- 12.1.11.1. Company Overview
- 12.1.11.2. Products
- 12.1.11.3. Company Financials
- 12.1.11.4. SWOT Analysis
- 12.1.12 Teledyne Technologies Incorporated
- 12.1.12.1. Company Overview
- 12.1.12.2. Products
- 12.1.12.3. Company Financials
- 12.1.12.4. SWOT Analysis
- 12.1.13 Others
- 12.1.13.1. Company Overview
- 12.1.13.2. Products
- 12.1.13.3. Company Financials
- 12.1.13.4. SWOT Analysis
- 12.1.1 Sony Group Corporation
- 12.2. Market Entropy
- 12.2.1 Company's Key Areas Served
- 12.2.2 Recent Developments
- 12.3. Company Market Share Analysis 2025
- 12.3.1 Top 5 Companies Market Share Analysis
- 12.3.2 Top 3 Companies Market Share Analysis
- 12.4. List of Potential Customers
- 13. Research Methodology
List of Figures
- Figure 1: Global 3D Sensing Technology Revenue Breakdown (billion, %) by Region 2025 & 2033
- Figure 2: North America 3D Sensing Technology Revenue (billion), by Technology 2025 & 2033
- Figure 3: North America 3D Sensing Technology Revenue Share (%), by Technology 2025 & 2033
- Figure 4: North America 3D Sensing Technology Revenue (billion), by Sensor Type 2025 & 2033
- Figure 5: North America 3D Sensing Technology Revenue Share (%), by Sensor Type 2025 & 2033
- Figure 6: North America 3D Sensing Technology Revenue (billion), by Connectivity 2025 & 2033
- Figure 7: North America 3D Sensing Technology Revenue Share (%), by Connectivity 2025 & 2033
- Figure 8: North America 3D Sensing Technology Revenue (billion), by Application 2025 & 2033
- Figure 9: North America 3D Sensing Technology Revenue Share (%), by Application 2025 & 2033
- Figure 10: North America 3D Sensing Technology Revenue (billion), by End User 2025 & 2033
- Figure 11: North America 3D Sensing Technology Revenue Share (%), by End User 2025 & 2033
- Figure 12: North America 3D Sensing Technology Revenue (billion), by Country 2025 & 2033
- Figure 13: North America 3D Sensing Technology Revenue Share (%), by Country 2025 & 2033
- Figure 14: South America 3D Sensing Technology Revenue (billion), by Technology 2025 & 2033
- Figure 15: South America 3D Sensing Technology Revenue Share (%), by Technology 2025 & 2033
- Figure 16: South America 3D Sensing Technology Revenue (billion), by Sensor Type 2025 & 2033
- Figure 17: South America 3D Sensing Technology Revenue Share (%), by Sensor Type 2025 & 2033
- Figure 18: South America 3D Sensing Technology Revenue (billion), by Connectivity 2025 & 2033
- Figure 19: South America 3D Sensing Technology Revenue Share (%), by Connectivity 2025 & 2033
- Figure 20: South America 3D Sensing Technology Revenue (billion), by Application 2025 & 2033
- Figure 21: South America 3D Sensing Technology Revenue Share (%), by Application 2025 & 2033
- Figure 22: South America 3D Sensing Technology Revenue (billion), by End User 2025 & 2033
- Figure 23: South America 3D Sensing Technology Revenue Share (%), by End User 2025 & 2033
- Figure 24: South America 3D Sensing Technology Revenue (billion), by Country 2025 & 2033
- Figure 25: South America 3D Sensing Technology Revenue Share (%), by Country 2025 & 2033
- Figure 26: Europe 3D Sensing Technology Revenue (billion), by Technology 2025 & 2033
- Figure 27: Europe 3D Sensing Technology Revenue Share (%), by Technology 2025 & 2033
- Figure 28: Europe 3D Sensing Technology Revenue (billion), by Sensor Type 2025 & 2033
- Figure 29: Europe 3D Sensing Technology Revenue Share (%), by Sensor Type 2025 & 2033
- Figure 30: Europe 3D Sensing Technology Revenue (billion), by Connectivity 2025 & 2033
- Figure 31: Europe 3D Sensing Technology Revenue Share (%), by Connectivity 2025 & 2033
- Figure 32: Europe 3D Sensing Technology Revenue (billion), by Application 2025 & 2033
- Figure 33: Europe 3D Sensing Technology Revenue Share (%), by Application 2025 & 2033
- Figure 34: Europe 3D Sensing Technology Revenue (billion), by End User 2025 & 2033
- Figure 35: Europe 3D Sensing Technology Revenue Share (%), by End User 2025 & 2033
- Figure 36: Europe 3D Sensing Technology Revenue (billion), by Country 2025 & 2033
- Figure 37: Europe 3D Sensing Technology Revenue Share (%), by Country 2025 & 2033
- Figure 38: Middle East & Africa 3D Sensing Technology Revenue (billion), by Technology 2025 & 2033
- Figure 39: Middle East & Africa 3D Sensing Technology Revenue Share (%), by Technology 2025 & 2033
- Figure 40: Middle East & Africa 3D Sensing Technology Revenue (billion), by Sensor Type 2025 & 2033
- Figure 41: Middle East & Africa 3D Sensing Technology Revenue Share (%), by Sensor Type 2025 & 2033
- Figure 42: Middle East & Africa 3D Sensing Technology Revenue (billion), by Connectivity 2025 & 2033
- Figure 43: Middle East & Africa 3D Sensing Technology Revenue Share (%), by Connectivity 2025 & 2033
- Figure 44: Middle East & Africa 3D Sensing Technology Revenue (billion), by Application 2025 & 2033
- Figure 45: Middle East & Africa 3D Sensing Technology Revenue Share (%), by Application 2025 & 2033
- Figure 46: Middle East & Africa 3D Sensing Technology Revenue (billion), by End User 2025 & 2033
- Figure 47: Middle East & Africa 3D Sensing Technology Revenue Share (%), by End User 2025 & 2033
- Figure 48: Middle East & Africa 3D Sensing Technology Revenue (billion), by Country 2025 & 2033
- Figure 49: Middle East & Africa 3D Sensing Technology Revenue Share (%), by Country 2025 & 2033
- Figure 50: Asia Pacific 3D Sensing Technology Revenue (billion), by Technology 2025 & 2033
- Figure 51: Asia Pacific 3D Sensing Technology Revenue Share (%), by Technology 2025 & 2033
- Figure 52: Asia Pacific 3D Sensing Technology Revenue (billion), by Sensor Type 2025 & 2033
- Figure 53: Asia Pacific 3D Sensing Technology Revenue Share (%), by Sensor Type 2025 & 2033
- Figure 54: Asia Pacific 3D Sensing Technology Revenue (billion), by Connectivity 2025 & 2033
- Figure 55: Asia Pacific 3D Sensing Technology Revenue Share (%), by Connectivity 2025 & 2033
- Figure 56: Asia Pacific 3D Sensing Technology Revenue (billion), by Application 2025 & 2033
- Figure 57: Asia Pacific 3D Sensing Technology Revenue Share (%), by Application 2025 & 2033
- Figure 58: Asia Pacific 3D Sensing Technology Revenue (billion), by End User 2025 & 2033
- Figure 59: Asia Pacific 3D Sensing Technology Revenue Share (%), by End User 2025 & 2033
- Figure 60: Asia Pacific 3D Sensing Technology Revenue (billion), by Country 2025 & 2033
- Figure 61: Asia Pacific 3D Sensing Technology Revenue Share (%), by Country 2025 & 2033
List of Tables
- Table 1: Global 3D Sensing Technology Revenue billion Forecast, by Technology 2020 & 2033
- Table 2: Global 3D Sensing Technology Revenue billion Forecast, by Sensor Type 2020 & 2033
- Table 3: Global 3D Sensing Technology Revenue billion Forecast, by Connectivity 2020 & 2033
- Table 4: Global 3D Sensing Technology Revenue billion Forecast, by Application 2020 & 2033
- Table 5: Global 3D Sensing Technology Revenue billion Forecast, by End User 2020 & 2033
- Table 6: Global 3D Sensing Technology Revenue billion Forecast, by Region 2020 & 2033
- Table 7: Global 3D Sensing Technology Revenue billion Forecast, by Technology 2020 & 2033
- Table 8: Global 3D Sensing Technology Revenue billion Forecast, by Sensor Type 2020 & 2033
- Table 9: Global 3D Sensing Technology Revenue billion Forecast, by Connectivity 2020 & 2033
- Table 10: Global 3D Sensing Technology Revenue billion Forecast, by Application 2020 & 2033
- Table 11: Global 3D Sensing Technology Revenue billion Forecast, by End User 2020 & 2033
- Table 12: Global 3D Sensing Technology Revenue billion Forecast, by Country 2020 & 2033
- Table 13: United States 3D Sensing Technology Revenue (billion) Forecast, by Application 2020 & 2033
- Table 14: Canada 3D Sensing Technology Revenue (billion) Forecast, by Application 2020 & 2033
- Table 15: Mexico 3D Sensing Technology Revenue (billion) Forecast, by Application 2020 & 2033
- Table 16: Global 3D Sensing Technology Revenue billion Forecast, by Technology 2020 & 2033
- Table 17: Global 3D Sensing Technology Revenue billion Forecast, by Sensor Type 2020 & 2033
- Table 18: Global 3D Sensing Technology Revenue billion Forecast, by Connectivity 2020 & 2033
- Table 19: Global 3D Sensing Technology Revenue billion Forecast, by Application 2020 & 2033
- Table 20: Global 3D Sensing Technology Revenue billion Forecast, by End User 2020 & 2033
- Table 21: Global 3D Sensing Technology Revenue billion Forecast, by Country 2020 & 2033
- Table 22: Brazil 3D Sensing Technology Revenue (billion) Forecast, by Application 2020 & 2033
- Table 23: Argentina 3D Sensing Technology Revenue (billion) Forecast, by Application 2020 & 2033
- Table 24: Rest of South America 3D Sensing Technology Revenue (billion) Forecast, by Application 2020 & 2033
- Table 25: Global 3D Sensing Technology Revenue billion Forecast, by Technology 2020 & 2033
- Table 26: Global 3D Sensing Technology Revenue billion Forecast, by Sensor Type 2020 & 2033
- Table 27: Global 3D Sensing Technology Revenue billion Forecast, by Connectivity 2020 & 2033
- Table 28: Global 3D Sensing Technology Revenue billion Forecast, by Application 2020 & 2033
- Table 29: Global 3D Sensing Technology Revenue billion Forecast, by End User 2020 & 2033
- Table 30: Global 3D Sensing Technology Revenue billion Forecast, by Country 2020 & 2033
- Table 31: United Kingdom 3D Sensing Technology Revenue (billion) Forecast, by Application 2020 & 2033
- Table 32: Germany 3D Sensing Technology Revenue (billion) Forecast, by Application 2020 & 2033
- Table 33: France 3D Sensing Technology Revenue (billion) Forecast, by Application 2020 & 2033
- Table 34: Italy 3D Sensing Technology Revenue (billion) Forecast, by Application 2020 & 2033
- Table 35: Spain 3D Sensing Technology Revenue (billion) Forecast, by Application 2020 & 2033
- Table 36: Russia 3D Sensing Technology Revenue (billion) Forecast, by Application 2020 & 2033
- Table 37: Benelux 3D Sensing Technology Revenue (billion) Forecast, by Application 2020 & 2033
- Table 38: Nordics 3D Sensing Technology Revenue (billion) Forecast, by Application 2020 & 2033
- Table 39: Rest of Europe 3D Sensing Technology Revenue (billion) Forecast, by Application 2020 & 2033
- Table 40: Global 3D Sensing Technology Revenue billion Forecast, by Technology 2020 & 2033
- Table 41: Global 3D Sensing Technology Revenue billion Forecast, by Sensor Type 2020 & 2033
- Table 42: Global 3D Sensing Technology Revenue billion Forecast, by Connectivity 2020 & 2033
- Table 43: Global 3D Sensing Technology Revenue billion Forecast, by Application 2020 & 2033
- Table 44: Global 3D Sensing Technology Revenue billion Forecast, by End User 2020 & 2033
- Table 45: Global 3D Sensing Technology Revenue billion Forecast, by Country 2020 & 2033
- Table 46: Turkey 3D Sensing Technology Revenue (billion) Forecast, by Application 2020 & 2033
- Table 47: Israel 3D Sensing Technology Revenue (billion) Forecast, by Application 2020 & 2033
- Table 48: GCC 3D Sensing Technology Revenue (billion) Forecast, by Application 2020 & 2033
- Table 49: North Africa 3D Sensing Technology Revenue (billion) Forecast, by Application 2020 & 2033
- Table 50: South Africa 3D Sensing Technology Revenue (billion) Forecast, by Application 2020 & 2033
- Table 51: Rest of Middle East & Africa 3D Sensing Technology Revenue (billion) Forecast, by Application 2020 & 2033
- Table 52: Global 3D Sensing Technology Revenue billion Forecast, by Technology 2020 & 2033
- Table 53: Global 3D Sensing Technology Revenue billion Forecast, by Sensor Type 2020 & 2033
- Table 54: Global 3D Sensing Technology Revenue billion Forecast, by Connectivity 2020 & 2033
- Table 55: Global 3D Sensing Technology Revenue billion Forecast, by Application 2020 & 2033
- Table 56: Global 3D Sensing Technology Revenue billion Forecast, by End User 2020 & 2033
- Table 57: Global 3D Sensing Technology Revenue billion Forecast, by Country 2020 & 2033
- Table 58: China 3D Sensing Technology Revenue (billion) Forecast, by Application 2020 & 2033
- Table 59: India 3D Sensing Technology Revenue (billion) Forecast, by Application 2020 & 2033
- Table 60: Japan 3D Sensing Technology Revenue (billion) Forecast, by Application 2020 & 2033
- Table 61: South Korea 3D Sensing Technology Revenue (billion) Forecast, by Application 2020 & 2033
- Table 62: ASEAN 3D Sensing Technology Revenue (billion) Forecast, by Application 2020 & 2033
- Table 63: Oceania 3D Sensing Technology Revenue (billion) Forecast, by Application 2020 & 2033
- Table 64: Rest of Asia Pacific 3D Sensing Technology Revenue (billion) Forecast, by Application 2020 & 2033
Frequently Asked Questions
1. What is the projected Compound Annual Growth Rate (CAGR) of the 3D Sensing Technology?
The projected CAGR is approximately 24.2%.
2. Which companies are prominent players in the 3D Sensing Technology?
Key companies in the market include Sony Group Corporation, Apple Inc., Intel Corporation, Infineon Technologies AG, STMicroelectronics, Texas Instruments Incorporated, Microsoft Corporation, OmniVision Technologies, Inc., Lumentum Holdings Inc., Basler AG, Cognex Corporation, Teledyne Technologies Incorporated, Others.
3. What are the main segments of the 3D Sensing Technology?
The market segments include Technology, Sensor Type, Connectivity, Application, End User.
4. Can you provide details about the market size?
The market size is estimated to be USD 25.3 billion as of 2022.
5. What are some drivers contributing to market growth?
N/A
6. What are the notable trends driving market growth?
N/A
7. Are there any restraints impacting market growth?
N/A
8. Can you provide examples of recent developments in the market?
N/A
9. What pricing options are available for accessing the report?
Pricing options include single-user, multi-user, and enterprise licenses priced at USD 3350.00, USD 5025.00, and USD 6700.00 respectively.
10. Is the market size provided in terms of value or volume?
The market size is provided in terms of value, measured in billion.
11. Are there any specific market keywords associated with the report?
Yes, the market keyword associated with the report is "3D Sensing Technology," which aids in identifying and referencing the specific market segment covered.
12. How do I determine which pricing option suits my needs best?
The pricing options vary based on user requirements and access needs. Individual users may opt for single-user licenses, while businesses requiring broader access may choose multi-user or enterprise licenses for cost-effective access to the report.
13. Are there any additional resources or data provided in the 3D Sensing Technology report?
While the report offers comprehensive insights, it's advisable to review the specific contents or supplementary materials provided to ascertain if additional resources or data are available.
14. How can I stay updated on further developments or reports in the 3D Sensing Technology?
To stay informed about further developments, trends, and reports in the 3D Sensing Technology, consider subscribing to industry newsletters, following relevant companies and organizations, or regularly checking reputable industry news sources and publications.
Methodology
Step 1 - Identification of Relevant Samples Size from Population Database


Step 2 - Approaches for Defining Global Market Size (Value, Volume* & Price*)

Note*: In applicable scenarios
Step 3 - Data Sources
Primary Research
- Web Analytics
- Survey Reports
- Research Institute
- Latest Research Reports
- Opinion Leaders
Secondary Research
- Annual Reports
- White Paper
- Latest Press Release
- Industry Association
- Paid Database
- Investor Presentations

Step 4 - Data Triangulation
Involves using different sources of information in order to increase the validity of a study
These sources are likely to be stakeholders in a program - participants, other researchers, program staff, other community members, and so on.
Then we put all data in single framework & apply various statistical tools to find out the dynamic on the market.
During the analysis stage, feedback from the stakeholder groups would be compared to determine areas of agreement as well as areas of divergence