

Key Insights
The global 3D image sensor market is poised for robust expansion, projected to reach USD 4852 million by 2025, demonstrating a compelling compound annual growth rate (CAGR) of 5.4% during the forecast period of 2025-2033. This significant growth is propelled by an increasing demand for advanced imaging capabilities across a multitude of sectors. Key drivers include the burgeoning adoption of 3D sensing in consumer electronics, particularly in smartphones for facial recognition and augmented reality applications, and the growing utilization in medical care for enhanced diagnostic imaging and surgical guidance. Furthermore, the aerospace and defense industry's need for sophisticated surveillance and navigation systems, alongside the burgeoning integration of industrial robots with advanced perception for automation, are substantial growth catalysts. The automobile sector's push towards autonomous driving, relying heavily on 3D vision for obstacle detection and environmental mapping, represents another critical growth avenue. The market is witnessing continuous innovation, with advancements in CMOS sensor technology enabling higher resolution, faster frame rates, and improved low-light performance, thereby addressing existing market restraints such as high implementation costs and power consumption concerns in certain applications.
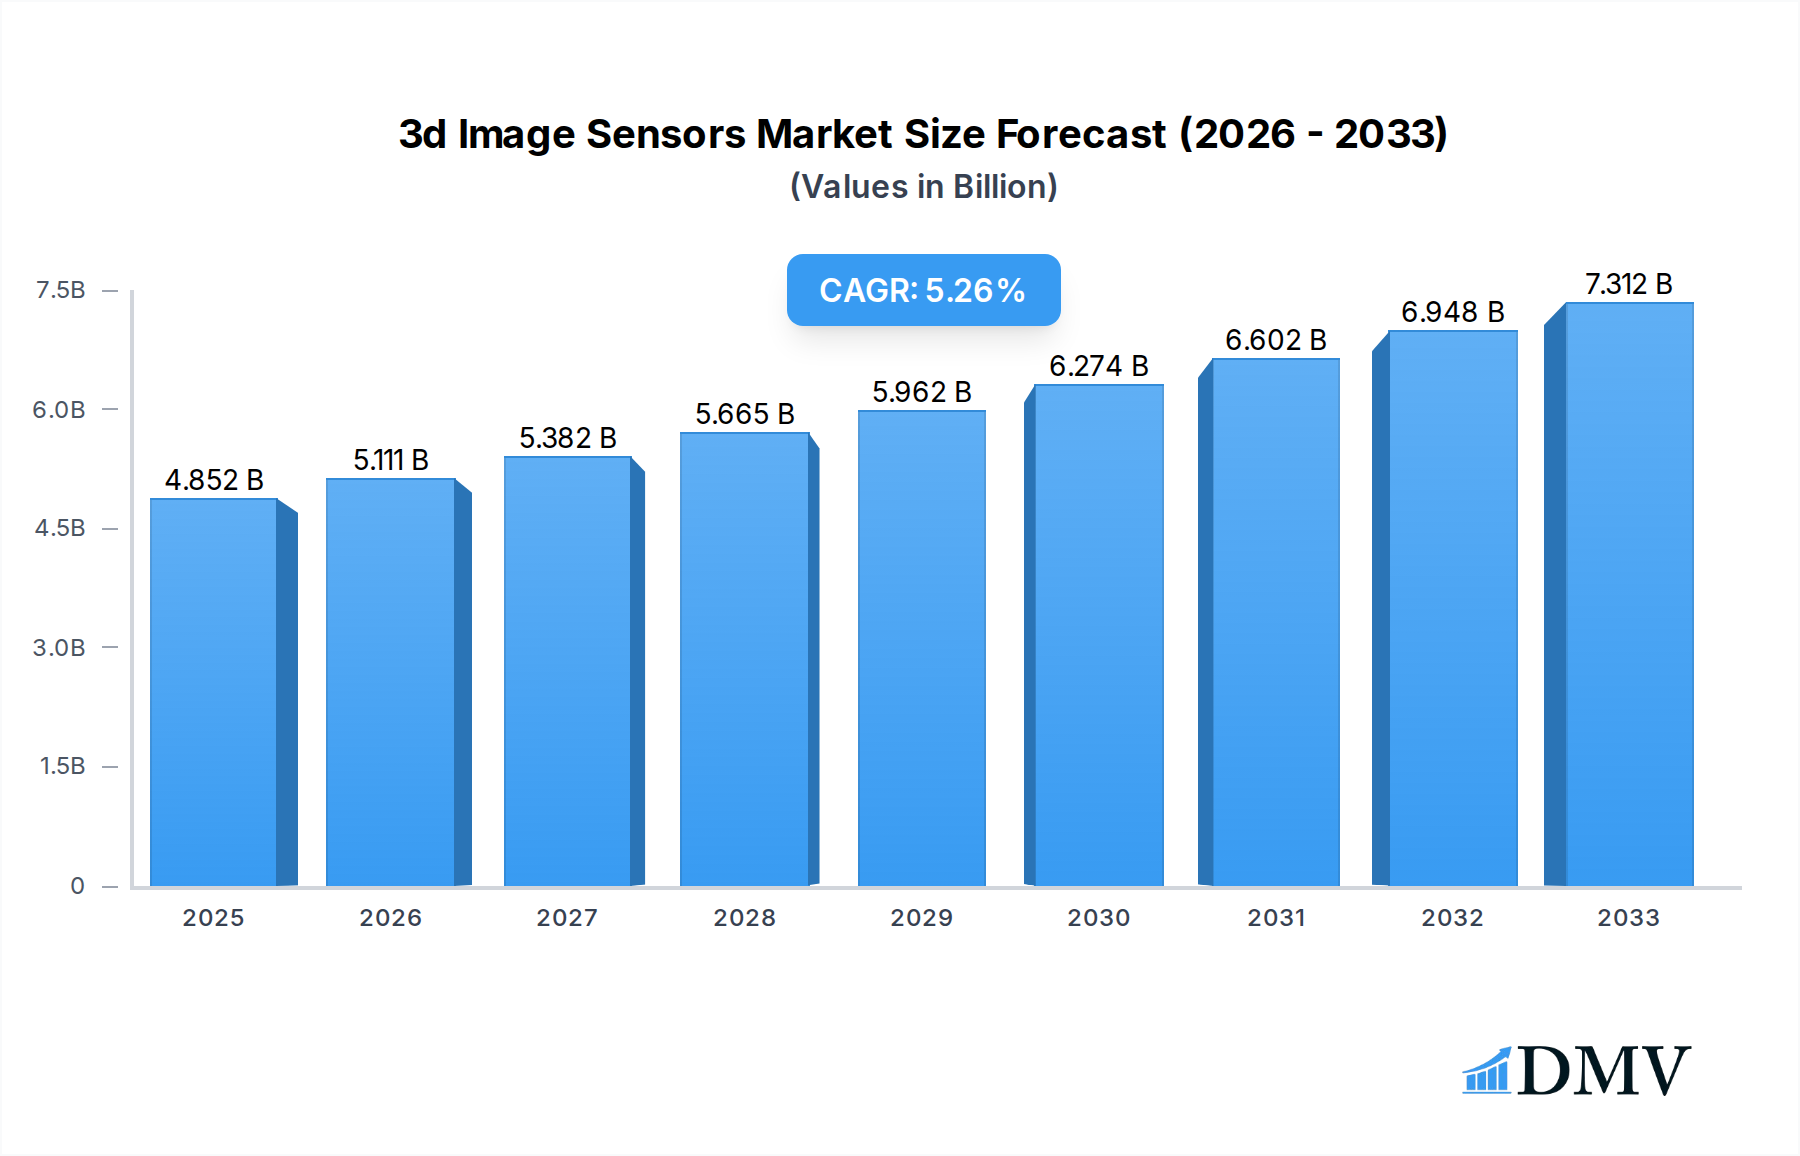
3d Image Sensors Market Size (In Billion)
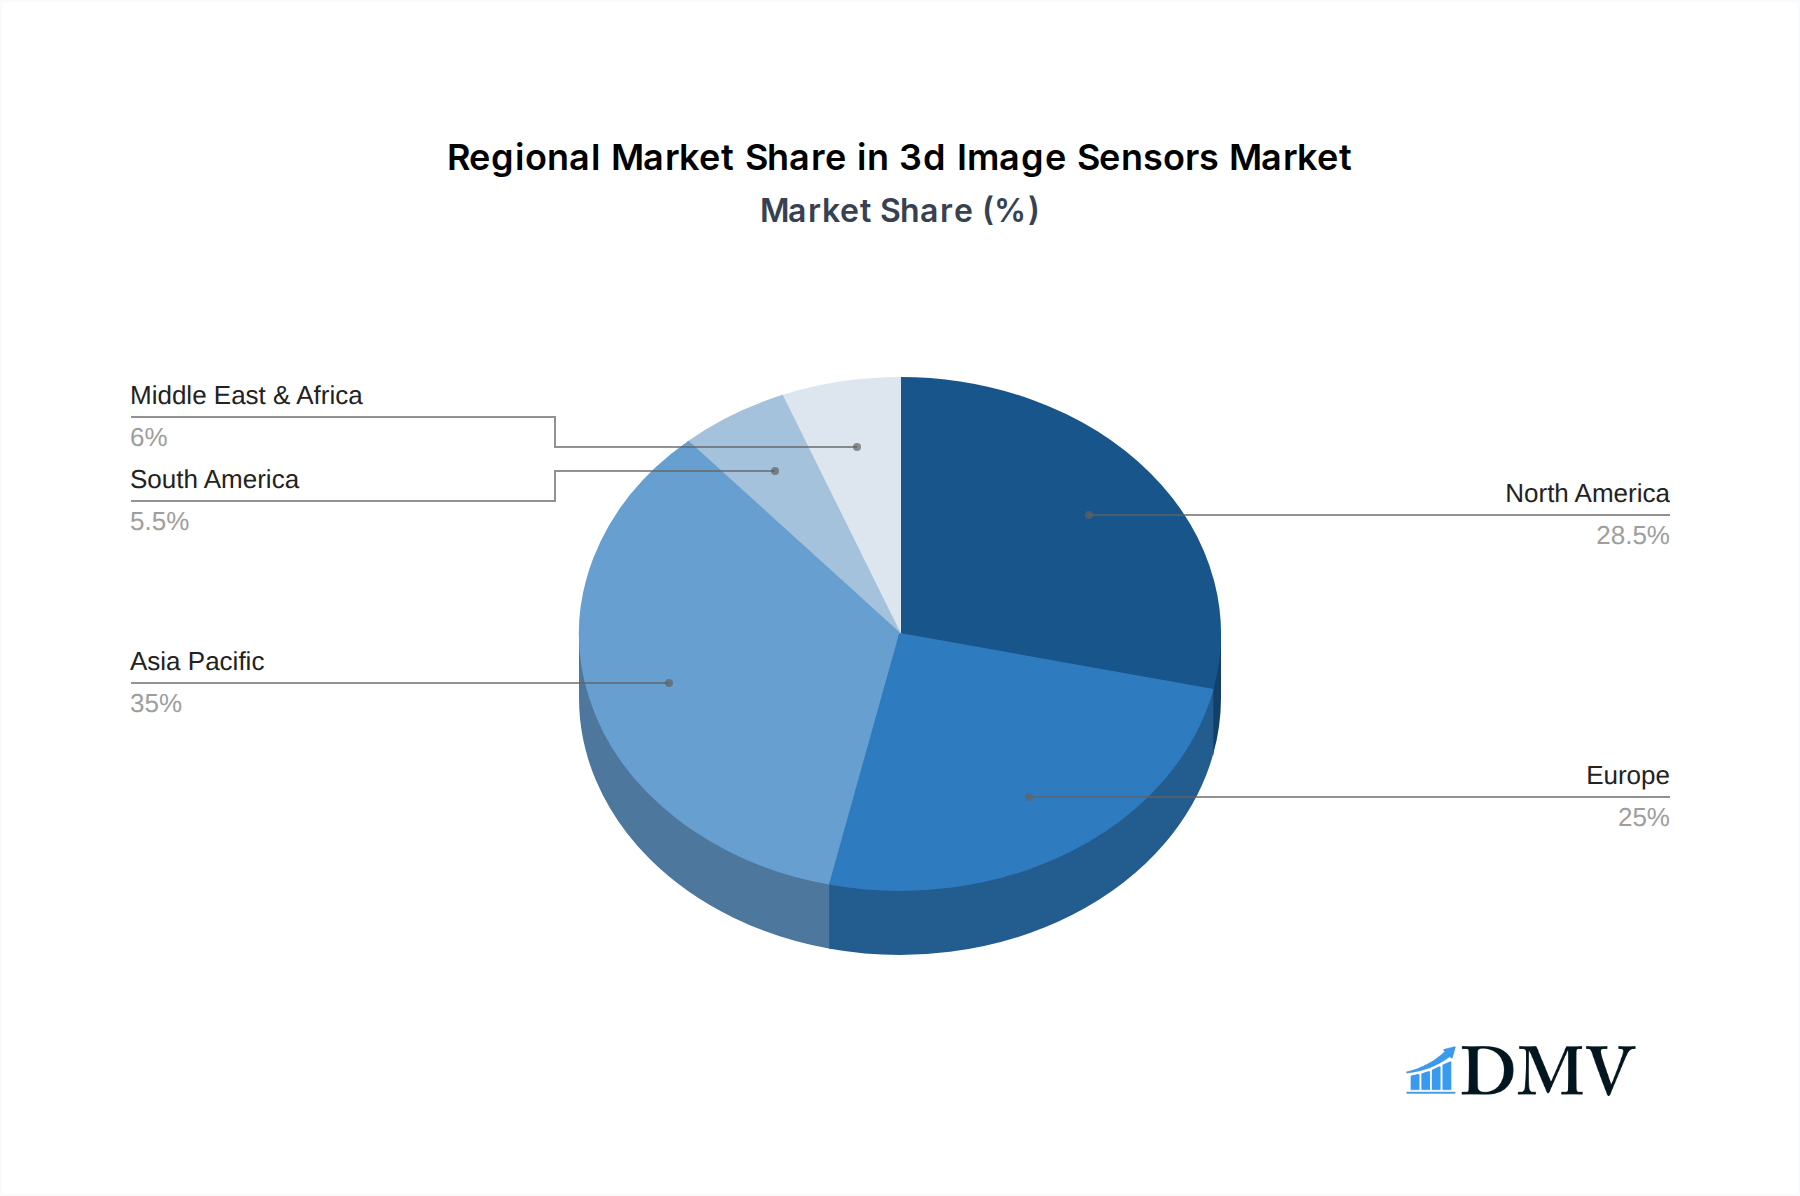
The competitive landscape for 3D image sensors is characterized by the presence of established technology giants and specialized innovators. Companies like Infineon Technologies, Microchip Technology, Intel Corporation, and Microsoft Corporation are actively investing in research and development, focusing on miniaturization, cost reduction, and enhanced accuracy of their sensor offerings. The market's segmentation by type highlights the dominance of CMOS sensors, which offer superior performance and cost-effectiveness compared to CCD, though CCD sensors continue to find niche applications. Geographically, the Asia Pacific region, led by China and Japan, is anticipated to be a significant market due to its vast manufacturing base for consumer electronics and rapid technological adoption. North America, driven by the United States' innovation ecosystem and robust demand from the automotive and defense sectors, will also maintain a strong market presence. Europe, with its strong automotive and industrial automation sectors, alongside growing healthcare applications, presents a substantial opportunity. The ongoing integration of 3D sensing into diverse applications is expected to overcome early-stage adoption challenges, further solidifying the market's upward trajectory.

3d Image Sensors Company Market Share
3d Image Sensors Market Composition & Trends
This comprehensive report dives deep into the dynamic 3D image sensor market, a critical component driving advancements across numerous industries. We meticulously analyze the market's concentration, identifying key players and their strategic maneuvers within a competitive landscape. Innovation catalysts, from emerging technologies like LiDAR sensors and ToF (Time-of-Flight) sensors to advancements in AI-powered image processing, are thoroughly examined. The report also scrutinizes the evolving regulatory landscapes impacting the adoption and development of 3D imaging solutions. Understanding substitute products and their market penetration, such as traditional 2D cameras and stereoscopic vision systems, is crucial for forecasting future trajectories.
The report profiles key end-user segments, including the rapidly expanding consumer electronics sector (smartphones, AR/VR headsets), the burgeoning automotive industry (ADAS, autonomous driving), industrial robotics, medical care, and aerospace and defense. We assess the impact of Mergers & Acquisitions (M&A) on market consolidation and technological integration, providing estimated deal values in the millions of dollars.
- Market Share Distribution: Analysis of leading companies' market share, with projected figures for 2025.
- M&A Deal Values: Insights into strategic acquisitions and their financial implications, with recent deals valued in the tens of millions.
- Innovation Focus Areas: Identification of R&D investments in areas such as miniaturization, power efficiency, and enhanced depth accuracy.
- Regulatory Impact: Evaluation of data privacy regulations and safety standards influencing 3D sensor deployment.
- Substitute Product Threat: Assessment of the competitive pressure from advanced 2D imaging and other depth-sensing technologies.
3d Image Sensors Industry Evolution
The 3D image sensor industry has witnessed remarkable growth and transformation, driven by an insatiable demand for enhanced spatial understanding and immersive experiences. This report meticulously traces the market growth trajectories from the historical period (2019-2024), through the base year (2025), and projects future expansion into the forecast period (2025-2033). We delve into the core of technological advancements, examining the evolution from early depth perception methods to the sophisticated CMOS image sensors and the emergence of specialized technologies like Time-of-Flight (ToF) and structured light sensors.
The report highlights the profound impact of shifting consumer demands, particularly the increasing appetite for augmented reality (AR), virtual reality (VR), and sophisticated mobile photography. Furthermore, we analyze the accelerating adoption of 3D sensing in industrial automation and robotics, where precise object recognition and manipulation are paramount. Data points such as compound annual growth rates (CAGR) of xx% and adoption metrics in key segments like automotive and consumer electronics are provided, underscoring the industry's robust upward momentum. The continuous pursuit of higher resolution, faster frame rates, improved low-light performance, and reduced power consumption by leading manufacturers like Infineon Technologies, Microchip Technology, and Omnivision Technologies fuels this ongoing evolution.
Leading Regions, Countries, or Segments in 3d Image Sensors
The 3D image sensor market is characterized by dynamic regional dominance and segment-specific growth. This analysis identifies the leading geographical hubs and application sectors that are shaping the industry's future. Asia-Pacific, particularly China and South Korea, emerges as a powerhouse, driven by its massive manufacturing capabilities in consumer electronics and a rapidly growing automotive sector. North America, with its strong R&D infrastructure and significant investments in aerospace and defense and medical care, also holds a pivotal position. Europe's commitment to industrial automation and automotive innovation further solidifies its importance.
Within the application segments, Consumer Electronics is currently the largest and fastest-growing, fueled by the integration of 3D sensors in smartphones for facial recognition, AR applications, and advanced photography. The Automobile segment is poised for exponential growth due to the increasing adoption of Advanced Driver-Assistance Systems (ADAS) and the eventual rise of autonomous vehicles, necessitating robust 3D perception systems. Industrial Robot applications are also witnessing significant expansion, with 3D sensors enabling sophisticated pick-and-place operations, quality control, and collaborative robotics.
Key Drivers:
- Technological Advancements: The continuous innovation in CMOS and ToF sensor technologies, offering enhanced accuracy, speed, and reduced power consumption.
- Smart Device Proliferation: The integration of 3D sensors in smartphones, tablets, and smart home devices for immersive experiences and enhanced functionality.
- Automotive Safety Regulations: Stricter safety mandates driving the adoption of ADAS features reliant on 3D imaging.
- Industrial Automation Boom: The growing need for precision in manufacturing, logistics, and warehousing operations.
- Healthcare Innovations: Applications in medical imaging, surgical robotics, and patient monitoring requiring detailed 3D data.
Dominance Factors:
- Manufacturing Prowess: Asia-Pacific's established electronics manufacturing ecosystem provides a cost-effective and scalable production base.
- R&D Investment: Significant capital allocation by companies like Intel Corporation and Microsoft Corporation in developing next-generation 3D imaging solutions.
- Government Initiatives: Supportive policies and funding for advanced technology adoption in sectors like automotive and aerospace.
- Consumer Demand: A strong and growing consumer appetite for devices and experiences that leverage 3D sensing capabilities.
- Ecosystem Development: The collaborative efforts between sensor manufacturers, system integrators, and software developers to create comprehensive 3D solutions.
3d Image Sensors Product Innovations
The 3D image sensor market is abuzz with groundbreaking product innovations that are redefining spatial sensing capabilities. Manufacturers are pushing the boundaries of performance, focusing on enhanced accuracy, faster data acquisition, and improved energy efficiency. Novel approaches in Time-of-Flight (ToF) technology are enabling higher resolutions and greater depth precision, crucial for demanding applications like autonomous driving and advanced robotics. Similarly, advancements in Stereo Vision are yielding more robust and cost-effective solutions for depth perception. Innovations in miniaturization are allowing the seamless integration of 3D sensors into an ever-wider array of devices, from compact consumer gadgets to sophisticated industrial equipment. These advancements promise to unlock new frontiers in virtual and augmented reality, intelligent automation, and detailed environmental mapping, with performance metrics like depth accuracy reaching sub-millimeter levels and frame rates exceeding xx frames per second.
Propelling Factors for 3d Image Sensors Growth
The 3D image sensor market is propelled by a confluence of powerful drivers, creating a fertile ground for sustained growth. The relentless advancement in CMOS sensor technology continues to offer higher resolution, faster frame rates, and improved power efficiency, making 3D sensing more accessible and versatile. The burgeoning demand for immersive experiences in consumer electronics, particularly in AR/VR applications, is a significant catalyst. Furthermore, the automotive industry's escalating need for advanced driver-assistance systems (ADAS) and the eventual realization of autonomous driving are creating immense opportunities for 3D imaging solutions. Economic factors such as increasing disposable incomes in developing nations also contribute by driving demand for smart devices equipped with advanced features. Regulatory push for enhanced safety and automation across various sectors further fuels market expansion.
Obstacles in the 3d Image Sensors Market
Despite the promising growth trajectory, the 3D image sensor market faces several significant obstacles that could temper its expansion. High development costs associated with cutting-edge technologies like LiDAR and advanced ToF systems can be a barrier for smaller companies and limit widespread adoption in cost-sensitive applications. Supply chain disruptions, exacerbated by geopolitical events and the ongoing semiconductor shortage, can impact production volumes and lead times. Regulatory hurdles, particularly concerning data privacy and security for facial recognition and surveillance applications, can slow down deployment. Furthermore, the competitive pressure from rapidly evolving alternative technologies, such as enhanced 2D vision systems and sophisticated ultrasonic sensors, poses a constant challenge, potentially impacting market share for certain 3D sensor types. The complexity of integration and the need for specialized software expertise can also present adoption challenges for some end-users.
Future Opportunities in 3d Image Sensors
The 3D image sensor market is brimming with exciting future opportunities that promise to reshape industries and enhance human-computer interaction. The continued evolution of augmented reality (AR) and virtual reality (VR) technologies will drive demand for higher fidelity 3D sensing for more immersive and interactive experiences. The automotive sector's unstoppable march towards autonomous driving will necessitate increasingly sophisticated and reliable 3D perception systems, creating a massive market for advanced LiDAR and ToF sensors. The medical care sector presents a vast untapped potential, with opportunities in advanced surgical robotics, patient monitoring, and 3D diagnostic imaging. The expansion of the Internet of Things (IoT) will see 3D sensors integrated into smart home devices, industrial equipment, and robotics for enhanced environmental awareness and intelligent decision-making. Emerging markets in logistics and warehousing for automated inventory management and fulfillment also represent significant growth avenues.
Major Players in the 3d Image Sensors Ecosystem
- Infineon Technologies
- Microchip Technology
- Omnivision Technologies
- PMD Technologies
- Softkinetic
- Asustek Computer
- Cognex Corporation
- IFM Electronic GmbH
- Intel Corporation
- LMI Technologies
- Microsoft Corporation
Key Developments in 3d Image Sensors Industry
- 2023: Introduction of next-generation ToF sensors with increased resolution and reduced power consumption by several leading manufacturers.
- 2023: Significant advancements in AI-driven 3D scene understanding and object recognition algorithms.
- 2024: Increased adoption of 3D imaging in industrial robotics for enhanced pick-and-place accuracy and quality control.
- 2024: Growing integration of 3D sensors in smartphones for improved AR experiences and advanced camera functionalities.
- 2024: Major automotive suppliers showcasing advanced ADAS systems leveraging integrated 3D LiDAR and camera fusion.
- 2025: Expected launch of more compact and cost-effective LiDAR solutions for broader automotive and consumer applications.
- 2025: Expansion of 3D sensing applications in medical imaging and surgical robotics.
- 2026: Continued focus on improving the performance of 3D sensors in challenging lighting conditions and adverse weather.
- 2027: Emergence of new form factors and integration methods for 3D sensors in wearable technology.
- 2028: Increased standardization efforts for 3D data formats and protocols across different industries.
Strategic 3d Image Sensors Market Forecast
The strategic 3D image sensors market forecast predicts robust and sustained growth, driven by accelerating technological innovation and escalating demand across key sectors. The continuous evolution of CMOS and ToF sensor technologies, coupled with significant R&D investments, will fuel breakthroughs in performance and affordability, unlocking new application frontiers. The automotive industry, particularly the pursuit of autonomous driving, will remain a primary growth engine, demanding sophisticated and reliable 3D perception systems. The consumer electronics sector will continue its expansion, with 3D sensing becoming a standard feature for immersive AR/VR experiences and enhanced device functionality. Furthermore, the growing adoption in industrial automation, robotics, and healthcare will contribute substantially to market expansion. Emerging markets and novel applications are expected to create significant untapped potential, positioning the 3D image sensor market for a dynamic and prosperous future, with market value projected to reach hundreds of millions of dollars by 2033.
3d Image Sensors Segmentation
-
1. Application
- 1.1. Consumer Electronics
- 1.2. Medical Care
- 1.3. Aerospace and Defense
- 1.4. Industrial Robot
- 1.5. Automobile
- 1.6. Others
-
2. Type
- 2.1. CCD
- 2.2. CMOS(Complementary Metal-Oxide Semiconductor)
- 2.3. Others
3d Image Sensors Segmentation By Geography
-
1. North America
- 1.1. United States
- 1.2. Canada
- 1.3. Mexico
-
2. South America
- 2.1. Brazil
- 2.2. Argentina
- 2.3. Rest of South America
-
3. Europe
- 3.1. United Kingdom
- 3.2. Germany
- 3.3. France
- 3.4. Italy
- 3.5. Spain
- 3.6. Russia
- 3.7. Benelux
- 3.8. Nordics
- 3.9. Rest of Europe
-
4. Middle East & Africa
- 4.1. Turkey
- 4.2. Israel
- 4.3. GCC
- 4.4. North Africa
- 4.5. South Africa
- 4.6. Rest of Middle East & Africa
-
5. Asia Pacific
- 5.1. China
- 5.2. India
- 5.3. Japan
- 5.4. South Korea
- 5.5. ASEAN
- 5.6. Oceania
- 5.7. Rest of Asia Pacific
3d Image Sensors Regional Market Share
Geographic Coverage of 3d Image Sensors
3d Image Sensors REPORT HIGHLIGHTS
| Aspects | Details |
|---|---|
| Study Period | 2020-2034 |
| Base Year | 2025 |
| Estimated Year | 2026 |
| Forecast Period | 2026-2034 |
| Historical Period | 2020-2025 |
| Growth Rate | CAGR of 5.4% from 2020-2034 |
| Segmentation |
|
Table of Contents
- 1. Introduction
- 1.1. Research Scope
- 1.2. Market Segmentation
- 1.3. Research Objective
- 1.4. Definitions and Assumptions
- 2. Executive Summary
- 2.1. Market Snapshot
- 3. Market Dynamics
- 3.1. Market Drivers
- 3.2. Market Restrains
- 3.3. Market Trends
- 3.4. Market Opportunities
- 4. Market Factor Analysis
- 4.1. Porters Five Forces
- 4.1.1. Bargaining Power of Suppliers
- 4.1.2. Bargaining Power of Buyers
- 4.1.3. Threat of New Entrants
- 4.1.4. Threat of Substitutes
- 4.1.5. Competitive Rivalry
- 4.2. PESTEL analysis
- 4.3. BCG Analysis
- 4.3.1. Stars (High Growth, High Market Share)
- 4.3.2. Cash Cows (Low Growth, High Market Share)
- 4.3.3. Question Mark (High Growth, Low Market Share)
- 4.3.4. Dogs (Low Growth, Low Market Share)
- 4.4. Ansoff Matrix Analysis
- 4.5. Supply Chain Analysis
- 4.6. Regulatory Landscape
- 4.7. Current Market Potential and Opportunity Assessment (TAM–SAM–SOM Framework)
- 4.8. DMV Analyst Note
- 4.1. Porters Five Forces
- 5. Market Analysis, Insights and Forecast 2021-2033
- 5.1. Market Analysis, Insights and Forecast - by Application
- 5.1.1. Consumer Electronics
- 5.1.2. Medical Care
- 5.1.3. Aerospace and Defense
- 5.1.4. Industrial Robot
- 5.1.5. Automobile
- 5.1.6. Others
- 5.2. Market Analysis, Insights and Forecast - by Type
- 5.2.1. CCD
- 5.2.2. CMOS(Complementary Metal-Oxide Semiconductor)
- 5.2.3. Others
- 5.3. Market Analysis, Insights and Forecast - by Region
- 5.3.1. North America
- 5.3.2. South America
- 5.3.3. Europe
- 5.3.4. Middle East & Africa
- 5.3.5. Asia Pacific
- 5.1. Market Analysis, Insights and Forecast - by Application
- 6. Global 3d Image Sensors Analysis, Insights and Forecast, 2021-2033
- 6.1. Market Analysis, Insights and Forecast - by Application
- 6.1.1. Consumer Electronics
- 6.1.2. Medical Care
- 6.1.3. Aerospace and Defense
- 6.1.4. Industrial Robot
- 6.1.5. Automobile
- 6.1.6. Others
- 6.2. Market Analysis, Insights and Forecast - by Type
- 6.2.1. CCD
- 6.2.2. CMOS(Complementary Metal-Oxide Semiconductor)
- 6.2.3. Others
- 6.1. Market Analysis, Insights and Forecast - by Application
- 7. North America 3d Image Sensors Analysis, Insights and Forecast, 2020-2032
- 7.1. Market Analysis, Insights and Forecast - by Application
- 7.1.1. Consumer Electronics
- 7.1.2. Medical Care
- 7.1.3. Aerospace and Defense
- 7.1.4. Industrial Robot
- 7.1.5. Automobile
- 7.1.6. Others
- 7.2. Market Analysis, Insights and Forecast - by Type
- 7.2.1. CCD
- 7.2.2. CMOS(Complementary Metal-Oxide Semiconductor)
- 7.2.3. Others
- 7.1. Market Analysis, Insights and Forecast - by Application
- 8. South America 3d Image Sensors Analysis, Insights and Forecast, 2020-2032
- 8.1. Market Analysis, Insights and Forecast - by Application
- 8.1.1. Consumer Electronics
- 8.1.2. Medical Care
- 8.1.3. Aerospace and Defense
- 8.1.4. Industrial Robot
- 8.1.5. Automobile
- 8.1.6. Others
- 8.2. Market Analysis, Insights and Forecast - by Type
- 8.2.1. CCD
- 8.2.2. CMOS(Complementary Metal-Oxide Semiconductor)
- 8.2.3. Others
- 8.1. Market Analysis, Insights and Forecast - by Application
- 9. Europe 3d Image Sensors Analysis, Insights and Forecast, 2020-2032
- 9.1. Market Analysis, Insights and Forecast - by Application
- 9.1.1. Consumer Electronics
- 9.1.2. Medical Care
- 9.1.3. Aerospace and Defense
- 9.1.4. Industrial Robot
- 9.1.5. Automobile
- 9.1.6. Others
- 9.2. Market Analysis, Insights and Forecast - by Type
- 9.2.1. CCD
- 9.2.2. CMOS(Complementary Metal-Oxide Semiconductor)
- 9.2.3. Others
- 9.1. Market Analysis, Insights and Forecast - by Application
- 10. Middle East & Africa 3d Image Sensors Analysis, Insights and Forecast, 2020-2032
- 10.1. Market Analysis, Insights and Forecast - by Application
- 10.1.1. Consumer Electronics
- 10.1.2. Medical Care
- 10.1.3. Aerospace and Defense
- 10.1.4. Industrial Robot
- 10.1.5. Automobile
- 10.1.6. Others
- 10.2. Market Analysis, Insights and Forecast - by Type
- 10.2.1. CCD
- 10.2.2. CMOS(Complementary Metal-Oxide Semiconductor)
- 10.2.3. Others
- 10.1. Market Analysis, Insights and Forecast - by Application
- 11. Asia Pacific 3d Image Sensors Analysis, Insights and Forecast, 2020-2032
- 11.1. Market Analysis, Insights and Forecast - by Application
- 11.1.1. Consumer Electronics
- 11.1.2. Medical Care
- 11.1.3. Aerospace and Defense
- 11.1.4. Industrial Robot
- 11.1.5. Automobile
- 11.1.6. Others
- 11.2. Market Analysis, Insights and Forecast - by Type
- 11.2.1. CCD
- 11.2.2. CMOS(Complementary Metal-Oxide Semiconductor)
- 11.2.3. Others
- 11.1. Market Analysis, Insights and Forecast - by Application
- 12. Competitive Analysis
- 12.1. Company Profiles
- 12.1.1 Infineon Technologies
- 12.1.1.1. Company Overview
- 12.1.1.2. Products
- 12.1.1.3. Company Financials
- 12.1.1.4. SWOT Analysis
- 12.1.2 Microchip Technology
- 12.1.2.1. Company Overview
- 12.1.2.2. Products
- 12.1.2.3. Company Financials
- 12.1.2.4. SWOT Analysis
- 12.1.3 Omnivision Technologies
- 12.1.3.1. Company Overview
- 12.1.3.2. Products
- 12.1.3.3. Company Financials
- 12.1.3.4. SWOT Analysis
- 12.1.4 PMD Technologies
- 12.1.4.1. Company Overview
- 12.1.4.2. Products
- 12.1.4.3. Company Financials
- 12.1.4.4. SWOT Analysis
- 12.1.5 Softkinetic
- 12.1.5.1. Company Overview
- 12.1.5.2. Products
- 12.1.5.3. Company Financials
- 12.1.5.4. SWOT Analysis
- 12.1.6 Asustek Computer
- 12.1.6.1. Company Overview
- 12.1.6.2. Products
- 12.1.6.3. Company Financials
- 12.1.6.4. SWOT Analysis
- 12.1.7 Cognex Corporation
- 12.1.7.1. Company Overview
- 12.1.7.2. Products
- 12.1.7.3. Company Financials
- 12.1.7.4. SWOT Analysis
- 12.1.8 IFM Electronic GmbH
- 12.1.8.1. Company Overview
- 12.1.8.2. Products
- 12.1.8.3. Company Financials
- 12.1.8.4. SWOT Analysis
- 12.1.9 Intel Corporation
- 12.1.9.1. Company Overview
- 12.1.9.2. Products
- 12.1.9.3. Company Financials
- 12.1.9.4. SWOT Analysis
- 12.1.10 LMI Technologies
- 12.1.10.1. Company Overview
- 12.1.10.2. Products
- 12.1.10.3. Company Financials
- 12.1.10.4. SWOT Analysis
- 12.1.11 Microsoft Corporation
- 12.1.11.1. Company Overview
- 12.1.11.2. Products
- 12.1.11.3. Company Financials
- 12.1.11.4. SWOT Analysis
- 12.1.1 Infineon Technologies
- 12.2. Market Entropy
- 12.2.1 Company's Key Areas Served
- 12.2.2 Recent Developments
- 12.3. Company Market Share Analysis 2025
- 12.3.1 Top 5 Companies Market Share Analysis
- 12.3.2 Top 3 Companies Market Share Analysis
- 12.4. List of Potential Customers
- 13. Research Methodology
List of Figures
- Figure 1: Global 3d Image Sensors Revenue Breakdown (million, %) by Region 2025 & 2033
- Figure 2: Global 3d Image Sensors Volume Breakdown (K, %) by Region 2025 & 2033
- Figure 3: North America 3d Image Sensors Revenue (million), by Application 2025 & 2033
- Figure 4: North America 3d Image Sensors Volume (K), by Application 2025 & 2033
- Figure 5: North America 3d Image Sensors Revenue Share (%), by Application 2025 & 2033
- Figure 6: North America 3d Image Sensors Volume Share (%), by Application 2025 & 2033
- Figure 7: North America 3d Image Sensors Revenue (million), by Type 2025 & 2033
- Figure 8: North America 3d Image Sensors Volume (K), by Type 2025 & 2033
- Figure 9: North America 3d Image Sensors Revenue Share (%), by Type 2025 & 2033
- Figure 10: North America 3d Image Sensors Volume Share (%), by Type 2025 & 2033
- Figure 11: North America 3d Image Sensors Revenue (million), by Country 2025 & 2033
- Figure 12: North America 3d Image Sensors Volume (K), by Country 2025 & 2033
- Figure 13: North America 3d Image Sensors Revenue Share (%), by Country 2025 & 2033
- Figure 14: North America 3d Image Sensors Volume Share (%), by Country 2025 & 2033
- Figure 15: South America 3d Image Sensors Revenue (million), by Application 2025 & 2033
- Figure 16: South America 3d Image Sensors Volume (K), by Application 2025 & 2033
- Figure 17: South America 3d Image Sensors Revenue Share (%), by Application 2025 & 2033
- Figure 18: South America 3d Image Sensors Volume Share (%), by Application 2025 & 2033
- Figure 19: South America 3d Image Sensors Revenue (million), by Type 2025 & 2033
- Figure 20: South America 3d Image Sensors Volume (K), by Type 2025 & 2033
- Figure 21: South America 3d Image Sensors Revenue Share (%), by Type 2025 & 2033
- Figure 22: South America 3d Image Sensors Volume Share (%), by Type 2025 & 2033
- Figure 23: South America 3d Image Sensors Revenue (million), by Country 2025 & 2033
- Figure 24: South America 3d Image Sensors Volume (K), by Country 2025 & 2033
- Figure 25: South America 3d Image Sensors Revenue Share (%), by Country 2025 & 2033
- Figure 26: South America 3d Image Sensors Volume Share (%), by Country 2025 & 2033
- Figure 27: Europe 3d Image Sensors Revenue (million), by Application 2025 & 2033
- Figure 28: Europe 3d Image Sensors Volume (K), by Application 2025 & 2033
- Figure 29: Europe 3d Image Sensors Revenue Share (%), by Application 2025 & 2033
- Figure 30: Europe 3d Image Sensors Volume Share (%), by Application 2025 & 2033
- Figure 31: Europe 3d Image Sensors Revenue (million), by Type 2025 & 2033
- Figure 32: Europe 3d Image Sensors Volume (K), by Type 2025 & 2033
- Figure 33: Europe 3d Image Sensors Revenue Share (%), by Type 2025 & 2033
- Figure 34: Europe 3d Image Sensors Volume Share (%), by Type 2025 & 2033
- Figure 35: Europe 3d Image Sensors Revenue (million), by Country 2025 & 2033
- Figure 36: Europe 3d Image Sensors Volume (K), by Country 2025 & 2033
- Figure 37: Europe 3d Image Sensors Revenue Share (%), by Country 2025 & 2033
- Figure 38: Europe 3d Image Sensors Volume Share (%), by Country 2025 & 2033
- Figure 39: Middle East & Africa 3d Image Sensors Revenue (million), by Application 2025 & 2033
- Figure 40: Middle East & Africa 3d Image Sensors Volume (K), by Application 2025 & 2033
- Figure 41: Middle East & Africa 3d Image Sensors Revenue Share (%), by Application 2025 & 2033
- Figure 42: Middle East & Africa 3d Image Sensors Volume Share (%), by Application 2025 & 2033
- Figure 43: Middle East & Africa 3d Image Sensors Revenue (million), by Type 2025 & 2033
- Figure 44: Middle East & Africa 3d Image Sensors Volume (K), by Type 2025 & 2033
- Figure 45: Middle East & Africa 3d Image Sensors Revenue Share (%), by Type 2025 & 2033
- Figure 46: Middle East & Africa 3d Image Sensors Volume Share (%), by Type 2025 & 2033
- Figure 47: Middle East & Africa 3d Image Sensors Revenue (million), by Country 2025 & 2033
- Figure 48: Middle East & Africa 3d Image Sensors Volume (K), by Country 2025 & 2033
- Figure 49: Middle East & Africa 3d Image Sensors Revenue Share (%), by Country 2025 & 2033
- Figure 50: Middle East & Africa 3d Image Sensors Volume Share (%), by Country 2025 & 2033
- Figure 51: Asia Pacific 3d Image Sensors Revenue (million), by Application 2025 & 2033
- Figure 52: Asia Pacific 3d Image Sensors Volume (K), by Application 2025 & 2033
- Figure 53: Asia Pacific 3d Image Sensors Revenue Share (%), by Application 2025 & 2033
- Figure 54: Asia Pacific 3d Image Sensors Volume Share (%), by Application 2025 & 2033
- Figure 55: Asia Pacific 3d Image Sensors Revenue (million), by Type 2025 & 2033
- Figure 56: Asia Pacific 3d Image Sensors Volume (K), by Type 2025 & 2033
- Figure 57: Asia Pacific 3d Image Sensors Revenue Share (%), by Type 2025 & 2033
- Figure 58: Asia Pacific 3d Image Sensors Volume Share (%), by Type 2025 & 2033
- Figure 59: Asia Pacific 3d Image Sensors Revenue (million), by Country 2025 & 2033
- Figure 60: Asia Pacific 3d Image Sensors Volume (K), by Country 2025 & 2033
- Figure 61: Asia Pacific 3d Image Sensors Revenue Share (%), by Country 2025 & 2033
- Figure 62: Asia Pacific 3d Image Sensors Volume Share (%), by Country 2025 & 2033
List of Tables
- Table 1: Global 3d Image Sensors Revenue million Forecast, by Application 2020 & 2033
- Table 2: Global 3d Image Sensors Volume K Forecast, by Application 2020 & 2033
- Table 3: Global 3d Image Sensors Revenue million Forecast, by Type 2020 & 2033
- Table 4: Global 3d Image Sensors Volume K Forecast, by Type 2020 & 2033
- Table 5: Global 3d Image Sensors Revenue million Forecast, by Region 2020 & 2033
- Table 6: Global 3d Image Sensors Volume K Forecast, by Region 2020 & 2033
- Table 7: Global 3d Image Sensors Revenue million Forecast, by Application 2020 & 2033
- Table 8: Global 3d Image Sensors Volume K Forecast, by Application 2020 & 2033
- Table 9: Global 3d Image Sensors Revenue million Forecast, by Type 2020 & 2033
- Table 10: Global 3d Image Sensors Volume K Forecast, by Type 2020 & 2033
- Table 11: Global 3d Image Sensors Revenue million Forecast, by Country 2020 & 2033
- Table 12: Global 3d Image Sensors Volume K Forecast, by Country 2020 & 2033
- Table 13: United States 3d Image Sensors Revenue (million) Forecast, by Application 2020 & 2033
- Table 14: United States 3d Image Sensors Volume (K) Forecast, by Application 2020 & 2033
- Table 15: Canada 3d Image Sensors Revenue (million) Forecast, by Application 2020 & 2033
- Table 16: Canada 3d Image Sensors Volume (K) Forecast, by Application 2020 & 2033
- Table 17: Mexico 3d Image Sensors Revenue (million) Forecast, by Application 2020 & 2033
- Table 18: Mexico 3d Image Sensors Volume (K) Forecast, by Application 2020 & 2033
- Table 19: Global 3d Image Sensors Revenue million Forecast, by Application 2020 & 2033
- Table 20: Global 3d Image Sensors Volume K Forecast, by Application 2020 & 2033
- Table 21: Global 3d Image Sensors Revenue million Forecast, by Type 2020 & 2033
- Table 22: Global 3d Image Sensors Volume K Forecast, by Type 2020 & 2033
- Table 23: Global 3d Image Sensors Revenue million Forecast, by Country 2020 & 2033
- Table 24: Global 3d Image Sensors Volume K Forecast, by Country 2020 & 2033
- Table 25: Brazil 3d Image Sensors Revenue (million) Forecast, by Application 2020 & 2033
- Table 26: Brazil 3d Image Sensors Volume (K) Forecast, by Application 2020 & 2033
- Table 27: Argentina 3d Image Sensors Revenue (million) Forecast, by Application 2020 & 2033
- Table 28: Argentina 3d Image Sensors Volume (K) Forecast, by Application 2020 & 2033
- Table 29: Rest of South America 3d Image Sensors Revenue (million) Forecast, by Application 2020 & 2033
- Table 30: Rest of South America 3d Image Sensors Volume (K) Forecast, by Application 2020 & 2033
- Table 31: Global 3d Image Sensors Revenue million Forecast, by Application 2020 & 2033
- Table 32: Global 3d Image Sensors Volume K Forecast, by Application 2020 & 2033
- Table 33: Global 3d Image Sensors Revenue million Forecast, by Type 2020 & 2033
- Table 34: Global 3d Image Sensors Volume K Forecast, by Type 2020 & 2033
- Table 35: Global 3d Image Sensors Revenue million Forecast, by Country 2020 & 2033
- Table 36: Global 3d Image Sensors Volume K Forecast, by Country 2020 & 2033
- Table 37: United Kingdom 3d Image Sensors Revenue (million) Forecast, by Application 2020 & 2033
- Table 38: United Kingdom 3d Image Sensors Volume (K) Forecast, by Application 2020 & 2033
- Table 39: Germany 3d Image Sensors Revenue (million) Forecast, by Application 2020 & 2033
- Table 40: Germany 3d Image Sensors Volume (K) Forecast, by Application 2020 & 2033
- Table 41: France 3d Image Sensors Revenue (million) Forecast, by Application 2020 & 2033
- Table 42: France 3d Image Sensors Volume (K) Forecast, by Application 2020 & 2033
- Table 43: Italy 3d Image Sensors Revenue (million) Forecast, by Application 2020 & 2033
- Table 44: Italy 3d Image Sensors Volume (K) Forecast, by Application 2020 & 2033
- Table 45: Spain 3d Image Sensors Revenue (million) Forecast, by Application 2020 & 2033
- Table 46: Spain 3d Image Sensors Volume (K) Forecast, by Application 2020 & 2033
- Table 47: Russia 3d Image Sensors Revenue (million) Forecast, by Application 2020 & 2033
- Table 48: Russia 3d Image Sensors Volume (K) Forecast, by Application 2020 & 2033
- Table 49: Benelux 3d Image Sensors Revenue (million) Forecast, by Application 2020 & 2033
- Table 50: Benelux 3d Image Sensors Volume (K) Forecast, by Application 2020 & 2033
- Table 51: Nordics 3d Image Sensors Revenue (million) Forecast, by Application 2020 & 2033
- Table 52: Nordics 3d Image Sensors Volume (K) Forecast, by Application 2020 & 2033
- Table 53: Rest of Europe 3d Image Sensors Revenue (million) Forecast, by Application 2020 & 2033
- Table 54: Rest of Europe 3d Image Sensors Volume (K) Forecast, by Application 2020 & 2033
- Table 55: Global 3d Image Sensors Revenue million Forecast, by Application 2020 & 2033
- Table 56: Global 3d Image Sensors Volume K Forecast, by Application 2020 & 2033
- Table 57: Global 3d Image Sensors Revenue million Forecast, by Type 2020 & 2033
- Table 58: Global 3d Image Sensors Volume K Forecast, by Type 2020 & 2033
- Table 59: Global 3d Image Sensors Revenue million Forecast, by Country 2020 & 2033
- Table 60: Global 3d Image Sensors Volume K Forecast, by Country 2020 & 2033
- Table 61: Turkey 3d Image Sensors Revenue (million) Forecast, by Application 2020 & 2033
- Table 62: Turkey 3d Image Sensors Volume (K) Forecast, by Application 2020 & 2033
- Table 63: Israel 3d Image Sensors Revenue (million) Forecast, by Application 2020 & 2033
- Table 64: Israel 3d Image Sensors Volume (K) Forecast, by Application 2020 & 2033
- Table 65: GCC 3d Image Sensors Revenue (million) Forecast, by Application 2020 & 2033
- Table 66: GCC 3d Image Sensors Volume (K) Forecast, by Application 2020 & 2033
- Table 67: North Africa 3d Image Sensors Revenue (million) Forecast, by Application 2020 & 2033
- Table 68: North Africa 3d Image Sensors Volume (K) Forecast, by Application 2020 & 2033
- Table 69: South Africa 3d Image Sensors Revenue (million) Forecast, by Application 2020 & 2033
- Table 70: South Africa 3d Image Sensors Volume (K) Forecast, by Application 2020 & 2033
- Table 71: Rest of Middle East & Africa 3d Image Sensors Revenue (million) Forecast, by Application 2020 & 2033
- Table 72: Rest of Middle East & Africa 3d Image Sensors Volume (K) Forecast, by Application 2020 & 2033
- Table 73: Global 3d Image Sensors Revenue million Forecast, by Application 2020 & 2033
- Table 74: Global 3d Image Sensors Volume K Forecast, by Application 2020 & 2033
- Table 75: Global 3d Image Sensors Revenue million Forecast, by Type 2020 & 2033
- Table 76: Global 3d Image Sensors Volume K Forecast, by Type 2020 & 2033
- Table 77: Global 3d Image Sensors Revenue million Forecast, by Country 2020 & 2033
- Table 78: Global 3d Image Sensors Volume K Forecast, by Country 2020 & 2033
- Table 79: China 3d Image Sensors Revenue (million) Forecast, by Application 2020 & 2033
- Table 80: China 3d Image Sensors Volume (K) Forecast, by Application 2020 & 2033
- Table 81: India 3d Image Sensors Revenue (million) Forecast, by Application 2020 & 2033
- Table 82: India 3d Image Sensors Volume (K) Forecast, by Application 2020 & 2033
- Table 83: Japan 3d Image Sensors Revenue (million) Forecast, by Application 2020 & 2033
- Table 84: Japan 3d Image Sensors Volume (K) Forecast, by Application 2020 & 2033
- Table 85: South Korea 3d Image Sensors Revenue (million) Forecast, by Application 2020 & 2033
- Table 86: South Korea 3d Image Sensors Volume (K) Forecast, by Application 2020 & 2033
- Table 87: ASEAN 3d Image Sensors Revenue (million) Forecast, by Application 2020 & 2033
- Table 88: ASEAN 3d Image Sensors Volume (K) Forecast, by Application 2020 & 2033
- Table 89: Oceania 3d Image Sensors Revenue (million) Forecast, by Application 2020 & 2033
- Table 90: Oceania 3d Image Sensors Volume (K) Forecast, by Application 2020 & 2033
- Table 91: Rest of Asia Pacific 3d Image Sensors Revenue (million) Forecast, by Application 2020 & 2033
- Table 92: Rest of Asia Pacific 3d Image Sensors Volume (K) Forecast, by Application 2020 & 2033
Frequently Asked Questions
1. What is the projected Compound Annual Growth Rate (CAGR) of the 3d Image Sensors?
The projected CAGR is approximately 5.4%.
2. Which companies are prominent players in the 3d Image Sensors?
Key companies in the market include Infineon Technologies, Microchip Technology, Omnivision Technologies, PMD Technologies, Softkinetic, Asustek Computer, Cognex Corporation, IFM Electronic GmbH, Intel Corporation, LMI Technologies, Microsoft Corporation.
3. What are the main segments of the 3d Image Sensors?
The market segments include Application, Type.
4. Can you provide details about the market size?
The market size is estimated to be USD 4852 million as of 2022.
5. What are some drivers contributing to market growth?
N/A
6. What are the notable trends driving market growth?
N/A
7. Are there any restraints impacting market growth?
N/A
8. Can you provide examples of recent developments in the market?
N/A
9. What pricing options are available for accessing the report?
Pricing options include single-user, multi-user, and enterprise licenses priced at USD 3950.00, USD 5925.00, and USD 7900.00 respectively.
10. Is the market size provided in terms of value or volume?
The market size is provided in terms of value, measured in million and volume, measured in K.
11. Are there any specific market keywords associated with the report?
Yes, the market keyword associated with the report is "3d Image Sensors," which aids in identifying and referencing the specific market segment covered.
12. How do I determine which pricing option suits my needs best?
The pricing options vary based on user requirements and access needs. Individual users may opt for single-user licenses, while businesses requiring broader access may choose multi-user or enterprise licenses for cost-effective access to the report.
13. Are there any additional resources or data provided in the 3d Image Sensors report?
While the report offers comprehensive insights, it's advisable to review the specific contents or supplementary materials provided to ascertain if additional resources or data are available.
14. How can I stay updated on further developments or reports in the 3d Image Sensors?
To stay informed about further developments, trends, and reports in the 3d Image Sensors, consider subscribing to industry newsletters, following relevant companies and organizations, or regularly checking reputable industry news sources and publications.
Methodology
Step 1 - Identification of Relevant Samples Size from Population Database


Step 2 - Approaches for Defining Global Market Size (Value, Volume* & Price*)

Note*: In applicable scenarios
Step 3 - Data Sources
Primary Research
- Web Analytics
- Survey Reports
- Research Institute
- Latest Research Reports
- Opinion Leaders
Secondary Research
- Annual Reports
- White Paper
- Latest Press Release
- Industry Association
- Paid Database
- Investor Presentations

Step 4 - Data Triangulation
Involves using different sources of information in order to increase the validity of a study
These sources are likely to be stakeholders in a program - participants, other researchers, program staff, other community members, and so on.
Then we put all data in single framework & apply various statistical tools to find out the dynamic on the market.
During the analysis stage, feedback from the stakeholder groups would be compared to determine areas of agreement as well as areas of divergence