

Key Insights
The global Volumetric Display Screen market is poised for explosive growth, projected to reach an estimated USD 553.63 million in 2025. This remarkable expansion is fueled by a CAGR of 30.9% over the forecast period of 2025-2033, indicating a significant technological and commercial upswing. The primary drivers of this surge include the increasing demand for immersive and interactive visual experiences across various sectors, coupled with ongoing advancements in holographic and 3D display technologies. Industries such as Medical, Aerospace and Defense, Automotive, and Media and Entertainment are increasingly adopting volumetric displays for their ability to present true 3D images without the need for special glasses, thereby enhancing visualization, training, and product design processes. The inherent capabilities of these displays to showcase complex data and simulations in a tangible, three-dimensional format are revolutionizing how information is consumed and interacted with.
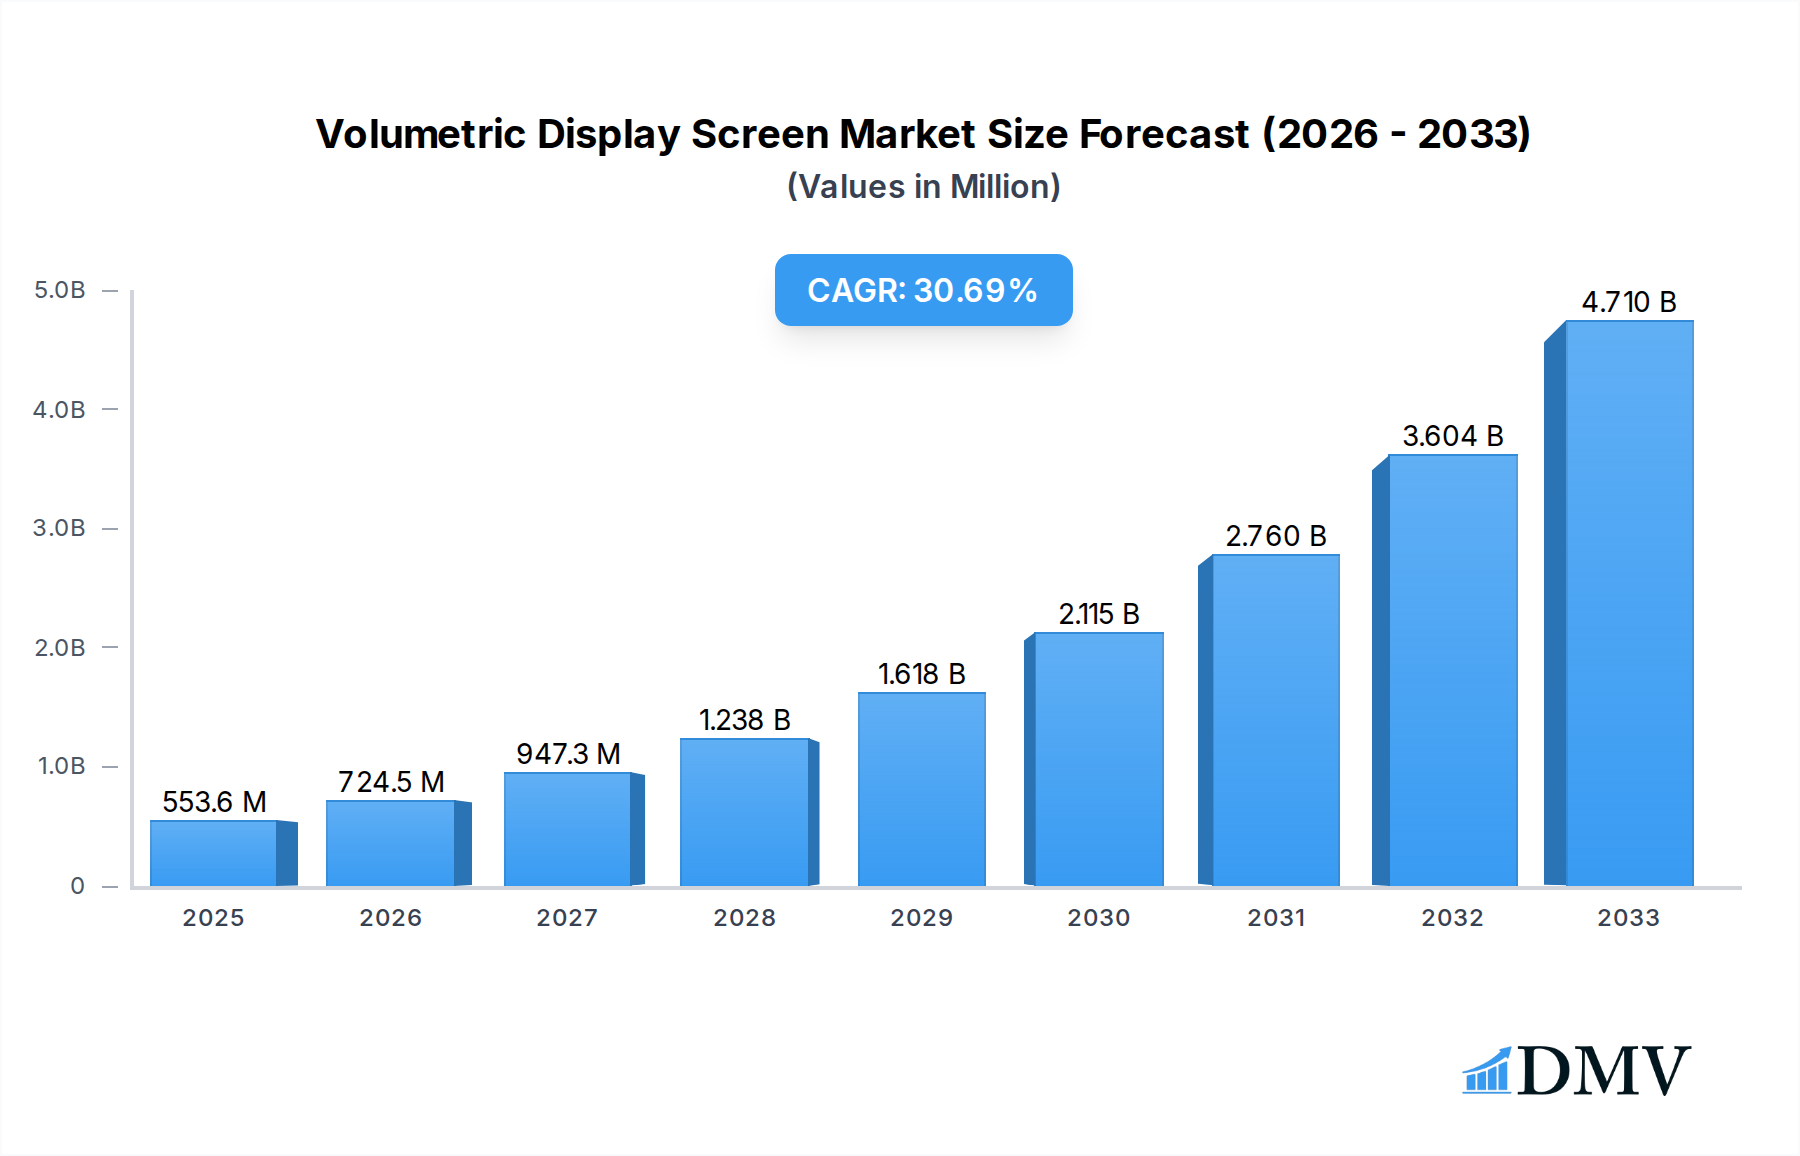
Volumetric Display Screen Market Size (In Million)
Key trends shaping the market include the development of higher resolution and more color-accurate volumetric displays, as well as the integration of these screens into augmented reality (AR) and virtual reality (VR) ecosystems to create more seamless and impactful mixed-reality experiences. While the market is predominantly driven by innovation, certain restraints such as the high initial cost of advanced volumetric display systems and the need for specialized content creation can pose challenges. However, as technology matures and production scales, these barriers are expected to diminish. The market is segmented into Static Volume and Swept Volume types, with applications spanning critical fields like medical imaging, aerospace simulations, automotive prototyping, and advanced media production. Leading companies are actively investing in research and development to capture a significant share of this burgeoning market, with North America and Europe currently leading in adoption, while the Asia Pacific region is anticipated to exhibit the fastest growth due to rapid technological adoption and a growing digital infrastructure.

Volumetric Display Screen Company Market Share
Gain a comprehensive understanding of the rapidly evolving volumetric display screen market with this in-depth industry report. Covering the study period of 2019–2033, with a base year of 2025 and an estimated year also of 2025, this report provides an unparalleled analysis of current trends and future projections. Discover critical insights into 3D display technology, holographic screens, and immersive visualization solutions essential for stakeholders across diverse sectors. This report is meticulously crafted to optimize search visibility for terms such as volumetric imaging, interactive 3D displays, medical visualization, aerospace simulation, automotive design reviews, and media entertainment experiences.
Volumetric Display Screen Market Composition & Trends
The volumetric display screen market is characterized by a moderate level of concentration, with key players investing heavily in research and development to push the boundaries of 3D volumetric technology. Innovation catalysts include the increasing demand for immersive user experiences and the need for precise, real-time 3D visualization in high-stakes industries. The regulatory landscape, while still developing, is increasingly focused on data privacy and the ethical deployment of advanced display technologies. Substitute products, such as advanced 2D displays and stereoscopic 3D, are present but fail to replicate the true depth and parallax of volumetric displays. End-user profiles range from leading medical institutions and aerospace manufacturers to automotive giants and cutting-edge entertainment studios, all seeking to leverage the transformative potential of holographic displays. Mergers and acquisitions (M&A) activity is projected to accelerate, with estimated deal values reaching over $150 million in the forecast period, indicating consolidation and strategic expansion within the ecosystem.
- Market Concentration: Moderate, with significant R&D investment by leading firms.
- Innovation Catalysts: Demand for immersive experiences, need for precise 3D visualization.
- Regulatory Landscape: Developing, with a focus on data privacy and ethical deployment.
- Substitute Products: Advanced 2D displays, stereoscopic 3D.
- End-User Profiles: Medical, Aerospace & Defense, Automotive, Media & Entertainment, Education & Training, Oil & Gas, Mining.
- M&A Activity: Projected to exceed $150 million in deal value.
Volumetric Display Screen Industry Evolution
The volumetric display screen industry has witnessed remarkable growth trajectories, fueled by relentless technological advancements and evolving consumer demands for more engaging and interactive visual experiences. From its nascent stages, the market has transitioned from experimental prototypes to commercially viable solutions, with adoption rates steadily climbing across various sectors. The forecast period of 2025–2033 is poised to see an accelerated adoption curve, driven by significant improvements in resolution, refresh rates, and the affordability of volumetric 3D display technology. Historically, early iterations were limited by bulky hardware and low image quality, but continuous innovation has led to more compact designs and enhanced photorealistic renderings. The market is expected to grow at a Compound Annual Growth Rate (CAGR) of approximately 25%, with the estimated market size projected to reach $5 billion by 2025 and expand significantly thereafter. Key technological leaps include advancements in light-field displays, electroholography, and multi-layer display technologies, all contributing to the creation of true volumetric visuals. Furthermore, the integration of AI and machine learning is enhancing the dynamic rendering capabilities of these displays, making them more responsive and adaptive to user interaction, thereby increasing their appeal in industries requiring complex data visualization and collaborative design. The increasing prevalence of virtual and augmented reality applications is also creating a fertile ground for volumetric displays as the next logical step in immersive technology.
Leading Regions, Countries, or Segments in Volumetric Display Screen
The volumetric display screen market showcases distinct regional dominance and segment leadership, driven by a confluence of factors including technological innovation, government support, and specific industry needs. In terms of applications, the Medical segment is emerging as a primary growth engine. The ability of volumetric displays to render intricate anatomical models in true 3D without the need for glasses is revolutionizing surgical planning, medical training, and patient consultation, leading to an estimated market share of 30% for this segment by 2025. Similarly, the Aerospace and Defense sector heavily relies on volumetric display solutions for pilot training simulators, aircraft design, and mission planning, contributing another 25% to the market. Geographically, North America and Europe are leading the charge, with substantial investments in R&D and a robust ecosystem of technology companies.
Dominant Application Segments:
- Medical: Driving innovation in surgical planning, medical imaging visualization, and patient education. Expect significant growth due to the need for detailed, real-time 3D anatomical models.
- Aerospace and Defense: Crucial for advanced simulation, training, and complex design reviews, offering unparalleled realism for critical applications.
- Media and Entertainment: Poised for a surge with the demand for immersive cinematic experiences and interactive gaming.
- Automotive: Essential for vehicle design visualization, virtual prototyping, and customer showrooms.
- Education and Training: Revolutionizing learning with interactive 3D models and simulations, making complex subjects more accessible.
Key Drivers for Segment Dominance:
- Technological Advancements: Improved resolution, brightness, and refresh rates are making these displays more practical and appealing.
- Investment Trends: Significant venture capital and corporate investment are pouring into volumetric display startups and established players.
- Regulatory Support: Government initiatives promoting advanced manufacturing and digital transformation are indirectly benefiting the market.
- End-User Adoption: Increasing realization of the tangible benefits of true 3D visualization in critical decision-making processes.
Volumetric Display Screen Product Innovations
The volumetric display screen market is experiencing a surge of innovative products that are redefining visual interaction. Companies are introducing next-generation holographic display screens with unprecedented resolution, offering millions of pixels per cubic inch to create incredibly detailed and lifelike 3D imagery. Innovations include advancements in light-field technology, enabling displays that can project true volumetric images viewable from any angle without the need for special eyewear. Performance metrics such as refresh rates exceeding 120 Hz and color gamuts covering 99% of DCI-P3 are becoming standard. Unique selling propositions often revolve around the seamless integration of these displays into existing workflows, their energy efficiency, and their ability to support interactive 3D applications, such as gesture control and real-time data manipulation.
Propelling Factors for Volumetric Display Screen Growth
The growth of the volumetric display screen market is being propelled by several interconnected factors. Technologically, advancements in LED and laser technologies, coupled with sophisticated optical designs, are enabling brighter, more vibrant, and higher-resolution volumetric displays. Economically, the declining cost of components and increasing production scalability are making these solutions more accessible to a wider range of industries. Regulatory tailwinds, such as government initiatives supporting digital transformation and advanced manufacturing, further encourage adoption. The growing demand for immersive experiences in media and entertainment, coupled with the critical need for precise 3D visualization in sectors like medical and aerospace, are powerful market pull factors. For instance, the automotive industry's adoption of volumetric displays for virtual prototyping is significantly reducing design cycle times and costs.
Obstacles in the Volumetric Display Screen Market
Despite its promising trajectory, the volumetric display screen market faces several obstacles. High initial manufacturing costs and the complexity of producing true volumetric displays at scale remain significant barriers. Regulatory challenges, particularly concerning data privacy and intellectual property protection when dealing with highly detailed 3D models, need to be addressed. Supply chain disruptions for specialized optical components can impact production timelines and costs. Competitive pressures from established display technologies and the ongoing development of alternative immersive solutions also present challenges. Quantifiable impacts include longer lead times for custom installations and a higher upfront investment for early adopters, potentially limiting market penetration in price-sensitive sectors.
Future Opportunities in Volumetric Display Screen
The future of the volumetric display screen market is ripe with opportunities. Emerging markets in areas such as virtual tourism, architectural visualization, and interactive retail displays present new avenues for growth. Technological opportunities lie in further miniaturization of components, the development of AI-powered dynamic volumetric content generation, and the integration of haptic feedback for truly immersive experiences. Consumer trends are increasingly leaning towards interactive and personalized visual content, which volumetric displays are uniquely positioned to deliver. The expansion into education and training, particularly for complex scientific and engineering subjects, offers substantial untapped potential.
Major Players in the Volumetric Display Screen Ecosystem
- 3Dicons
- Afriten Technologies
- Dicon
- Euroscreen
- Fujipream
- Holoxica
- HYPERVSN
- Kelyn Technologies
- Leia
- LianTronics
- LightSpace Technologies
- Merck KGaA
- Seekway Technology
- Volucap
- Zebra Imaging
Key Developments in Volumetric Display Screen Industry
- 2023/08: HYPERVSN launches a new generation of high-resolution holographic displays for large-scale installations.
- 2023/11: Leia showcases advancements in its Lightfield display technology, promising more immersive consumer-grade devices.
- 2024/01: Merck KGaA announces strategic partnerships to explore new material applications for advanced volumetric display components.
- 2024/03: Zebra Imaging demonstrates real-time volumetric data visualization for geological surveying applications.
- 2024/06: LianTronics unveils a large-scale transparent volumetric display for architectural and retail use cases.
Strategic Volumetric Display Screen Market Forecast
The strategic volumetric display screen market forecast indicates robust and sustained growth, driven by increasing demand for realistic 3D visualization and immersive user experiences across key industries. Future opportunities in emerging markets and the continuous evolution of display technologies will further accelerate adoption. The integration of AI and enhanced interactivity will solidify the position of volumetric displays as a pivotal technology for innovation in sectors ranging from healthcare to entertainment. Continued investment and strategic collaborations among major players will foster market expansion, making volumetric displays an indispensable tool for future-forward businesses. The market is projected to reach over $15 billion by 2033.
Volumetric Display Screen Segmentation
-
1. Application
- 1.1. Medical
- 1.2. Aerospace and Defense
- 1.3. Automotive
- 1.4. Media and Entertainment
- 1.5. Education and Training
- 1.6. Others (Oil, Gas, Mining, etc.)
-
2. Type
- 2.1. Static Volume
- 2.2. Swept Volume
Volumetric Display Screen Segmentation By Geography
-
1. North America
- 1.1. United States
- 1.2. Canada
- 1.3. Mexico
-
2. South America
- 2.1. Brazil
- 2.2. Argentina
- 2.3. Rest of South America
-
3. Europe
- 3.1. United Kingdom
- 3.2. Germany
- 3.3. France
- 3.4. Italy
- 3.5. Spain
- 3.6. Russia
- 3.7. Benelux
- 3.8. Nordics
- 3.9. Rest of Europe
-
4. Middle East & Africa
- 4.1. Turkey
- 4.2. Israel
- 4.3. GCC
- 4.4. North Africa
- 4.5. South Africa
- 4.6. Rest of Middle East & Africa
-
5. Asia Pacific
- 5.1. China
- 5.2. India
- 5.3. Japan
- 5.4. South Korea
- 5.5. ASEAN
- 5.6. Oceania
- 5.7. Rest of Asia Pacific

Volumetric Display Screen Regional Market Share
Geographic Coverage of Volumetric Display Screen
Volumetric Display Screen REPORT HIGHLIGHTS
| Aspects | Details |
|---|---|
| Study Period | 2020-2034 |
| Base Year | 2025 |
| Estimated Year | 2026 |
| Forecast Period | 2026-2034 |
| Historical Period | 2020-2025 |
| Growth Rate | CAGR of 30.9% from 2020-2034 |
| Segmentation |
|
Table of Contents
- 1. Introduction
- 1.1. Research Scope
- 1.2. Market Segmentation
- 1.3. Research Objective
- 1.4. Definitions and Assumptions
- 2. Executive Summary
- 2.1. Market Snapshot
- 3. Market Dynamics
- 3.1. Market Drivers
- 3.2. Market Restrains
- 3.3. Market Trends
- 3.4. Market Opportunities
- 4. Market Factor Analysis
- 4.1. Porters Five Forces
- 4.1.1. Bargaining Power of Suppliers
- 4.1.2. Bargaining Power of Buyers
- 4.1.3. Threat of New Entrants
- 4.1.4. Threat of Substitutes
- 4.1.5. Competitive Rivalry
- 4.2. PESTEL analysis
- 4.3. BCG Analysis
- 4.3.1. Stars (High Growth, High Market Share)
- 4.3.2. Cash Cows (Low Growth, High Market Share)
- 4.3.3. Question Mark (High Growth, Low Market Share)
- 4.3.4. Dogs (Low Growth, Low Market Share)
- 4.4. Ansoff Matrix Analysis
- 4.5. Supply Chain Analysis
- 4.6. Regulatory Landscape
- 4.7. Current Market Potential and Opportunity Assessment (TAM–SAM–SOM Framework)
- 4.8. DMV Analyst Note
- 4.1. Porters Five Forces
- 5. Market Analysis, Insights and Forecast 2021-2033
- 5.1. Market Analysis, Insights and Forecast - by Application
- 5.1.1. Medical
- 5.1.2. Aerospace and Defense
- 5.1.3. Automotive
- 5.1.4. Media and Entertainment
- 5.1.5. Education and Training
- 5.1.6. Others (Oil, Gas, Mining, etc.)
- 5.2. Market Analysis, Insights and Forecast - by Type
- 5.2.1. Static Volume
- 5.2.2. Swept Volume
- 5.3. Market Analysis, Insights and Forecast - by Region
- 5.3.1. North America
- 5.3.2. South America
- 5.3.3. Europe
- 5.3.4. Middle East & Africa
- 5.3.5. Asia Pacific
- 5.1. Market Analysis, Insights and Forecast - by Application
- 6. Global Volumetric Display Screen Analysis, Insights and Forecast, 2021-2033
- 6.1. Market Analysis, Insights and Forecast - by Application
- 6.1.1. Medical
- 6.1.2. Aerospace and Defense
- 6.1.3. Automotive
- 6.1.4. Media and Entertainment
- 6.1.5. Education and Training
- 6.1.6. Others (Oil, Gas, Mining, etc.)
- 6.2. Market Analysis, Insights and Forecast - by Type
- 6.2.1. Static Volume
- 6.2.2. Swept Volume
- 6.1. Market Analysis, Insights and Forecast - by Application
- 7. North America Volumetric Display Screen Analysis, Insights and Forecast, 2020-2032
- 7.1. Market Analysis, Insights and Forecast - by Application
- 7.1.1. Medical
- 7.1.2. Aerospace and Defense
- 7.1.3. Automotive
- 7.1.4. Media and Entertainment
- 7.1.5. Education and Training
- 7.1.6. Others (Oil, Gas, Mining, etc.)
- 7.2. Market Analysis, Insights and Forecast - by Type
- 7.2.1. Static Volume
- 7.2.2. Swept Volume
- 7.1. Market Analysis, Insights and Forecast - by Application
- 8. South America Volumetric Display Screen Analysis, Insights and Forecast, 2020-2032
- 8.1. Market Analysis, Insights and Forecast - by Application
- 8.1.1. Medical
- 8.1.2. Aerospace and Defense
- 8.1.3. Automotive
- 8.1.4. Media and Entertainment
- 8.1.5. Education and Training
- 8.1.6. Others (Oil, Gas, Mining, etc.)
- 8.2. Market Analysis, Insights and Forecast - by Type
- 8.2.1. Static Volume
- 8.2.2. Swept Volume
- 8.1. Market Analysis, Insights and Forecast - by Application
- 9. Europe Volumetric Display Screen Analysis, Insights and Forecast, 2020-2032
- 9.1. Market Analysis, Insights and Forecast - by Application
- 9.1.1. Medical
- 9.1.2. Aerospace and Defense
- 9.1.3. Automotive
- 9.1.4. Media and Entertainment
- 9.1.5. Education and Training
- 9.1.6. Others (Oil, Gas, Mining, etc.)
- 9.2. Market Analysis, Insights and Forecast - by Type
- 9.2.1. Static Volume
- 9.2.2. Swept Volume
- 9.1. Market Analysis, Insights and Forecast - by Application
- 10. Middle East & Africa Volumetric Display Screen Analysis, Insights and Forecast, 2020-2032
- 10.1. Market Analysis, Insights and Forecast - by Application
- 10.1.1. Medical
- 10.1.2. Aerospace and Defense
- 10.1.3. Automotive
- 10.1.4. Media and Entertainment
- 10.1.5. Education and Training
- 10.1.6. Others (Oil, Gas, Mining, etc.)
- 10.2. Market Analysis, Insights and Forecast - by Type
- 10.2.1. Static Volume
- 10.2.2. Swept Volume
- 10.1. Market Analysis, Insights and Forecast - by Application
- 11. Asia Pacific Volumetric Display Screen Analysis, Insights and Forecast, 2020-2032
- 11.1. Market Analysis, Insights and Forecast - by Application
- 11.1.1. Medical
- 11.1.2. Aerospace and Defense
- 11.1.3. Automotive
- 11.1.4. Media and Entertainment
- 11.1.5. Education and Training
- 11.1.6. Others (Oil, Gas, Mining, etc.)
- 11.2. Market Analysis, Insights and Forecast - by Type
- 11.2.1. Static Volume
- 11.2.2. Swept Volume
- 11.1. Market Analysis, Insights and Forecast - by Application
- 12. Competitive Analysis
- 12.1. Company Profiles
- 12.1.1 3Dicons
- 12.1.1.1. Company Overview
- 12.1.1.2. Products
- 12.1.1.3. Company Financials
- 12.1.1.4. SWOT Analysis
- 12.1.2 Afriten Technologies
- 12.1.2.1. Company Overview
- 12.1.2.2. Products
- 12.1.2.3. Company Financials
- 12.1.2.4. SWOT Analysis
- 12.1.3 Dicon
- 12.1.3.1. Company Overview
- 12.1.3.2. Products
- 12.1.3.3. Company Financials
- 12.1.3.4. SWOT Analysis
- 12.1.4 Euroscreen
- 12.1.4.1. Company Overview
- 12.1.4.2. Products
- 12.1.4.3. Company Financials
- 12.1.4.4. SWOT Analysis
- 12.1.5 Fujipream
- 12.1.5.1. Company Overview
- 12.1.5.2. Products
- 12.1.5.3. Company Financials
- 12.1.5.4. SWOT Analysis
- 12.1.6 Holoxica
- 12.1.6.1. Company Overview
- 12.1.6.2. Products
- 12.1.6.3. Company Financials
- 12.1.6.4. SWOT Analysis
- 12.1.7 HYPERVSN
- 12.1.7.1. Company Overview
- 12.1.7.2. Products
- 12.1.7.3. Company Financials
- 12.1.7.4. SWOT Analysis
- 12.1.8 Kelyn Technologies
- 12.1.8.1. Company Overview
- 12.1.8.2. Products
- 12.1.8.3. Company Financials
- 12.1.8.4. SWOT Analysis
- 12.1.9 Leia
- 12.1.9.1. Company Overview
- 12.1.9.2. Products
- 12.1.9.3. Company Financials
- 12.1.9.4. SWOT Analysis
- 12.1.10 LianTronics
- 12.1.10.1. Company Overview
- 12.1.10.2. Products
- 12.1.10.3. Company Financials
- 12.1.10.4. SWOT Analysis
- 12.1.11 LightSpace Technologies
- 12.1.11.1. Company Overview
- 12.1.11.2. Products
- 12.1.11.3. Company Financials
- 12.1.11.4. SWOT Analysis
- 12.1.12 Merck KGaA
- 12.1.12.1. Company Overview
- 12.1.12.2. Products
- 12.1.12.3. Company Financials
- 12.1.12.4. SWOT Analysis
- 12.1.13 Seekway Technology
- 12.1.13.1. Company Overview
- 12.1.13.2. Products
- 12.1.13.3. Company Financials
- 12.1.13.4. SWOT Analysis
- 12.1.14 Volucap
- 12.1.14.1. Company Overview
- 12.1.14.2. Products
- 12.1.14.3. Company Financials
- 12.1.14.4. SWOT Analysis
- 12.1.15 Zebra Imaging
- 12.1.15.1. Company Overview
- 12.1.15.2. Products
- 12.1.15.3. Company Financials
- 12.1.15.4. SWOT Analysis
- 12.1.1 3Dicons
- 12.2. Market Entropy
- 12.2.1 Company's Key Areas Served
- 12.2.2 Recent Developments
- 12.3. Company Market Share Analysis 2025
- 12.3.1 Top 5 Companies Market Share Analysis
- 12.3.2 Top 3 Companies Market Share Analysis
- 12.4. List of Potential Customers
- 13. Research Methodology
List of Figures
- Figure 1: Global Volumetric Display Screen Revenue Breakdown (million, %) by Region 2025 & 2033
- Figure 2: Global Volumetric Display Screen Volume Breakdown (K, %) by Region 2025 & 2033
- Figure 3: North America Volumetric Display Screen Revenue (million), by Application 2025 & 2033
- Figure 4: North America Volumetric Display Screen Volume (K), by Application 2025 & 2033
- Figure 5: North America Volumetric Display Screen Revenue Share (%), by Application 2025 & 2033
- Figure 6: North America Volumetric Display Screen Volume Share (%), by Application 2025 & 2033
- Figure 7: North America Volumetric Display Screen Revenue (million), by Type 2025 & 2033
- Figure 8: North America Volumetric Display Screen Volume (K), by Type 2025 & 2033
- Figure 9: North America Volumetric Display Screen Revenue Share (%), by Type 2025 & 2033
- Figure 10: North America Volumetric Display Screen Volume Share (%), by Type 2025 & 2033
- Figure 11: North America Volumetric Display Screen Revenue (million), by Country 2025 & 2033
- Figure 12: North America Volumetric Display Screen Volume (K), by Country 2025 & 2033
- Figure 13: North America Volumetric Display Screen Revenue Share (%), by Country 2025 & 2033
- Figure 14: North America Volumetric Display Screen Volume Share (%), by Country 2025 & 2033
- Figure 15: South America Volumetric Display Screen Revenue (million), by Application 2025 & 2033
- Figure 16: South America Volumetric Display Screen Volume (K), by Application 2025 & 2033
- Figure 17: South America Volumetric Display Screen Revenue Share (%), by Application 2025 & 2033
- Figure 18: South America Volumetric Display Screen Volume Share (%), by Application 2025 & 2033
- Figure 19: South America Volumetric Display Screen Revenue (million), by Type 2025 & 2033
- Figure 20: South America Volumetric Display Screen Volume (K), by Type 2025 & 2033
- Figure 21: South America Volumetric Display Screen Revenue Share (%), by Type 2025 & 2033
- Figure 22: South America Volumetric Display Screen Volume Share (%), by Type 2025 & 2033
- Figure 23: South America Volumetric Display Screen Revenue (million), by Country 2025 & 2033
- Figure 24: South America Volumetric Display Screen Volume (K), by Country 2025 & 2033
- Figure 25: South America Volumetric Display Screen Revenue Share (%), by Country 2025 & 2033
- Figure 26: South America Volumetric Display Screen Volume Share (%), by Country 2025 & 2033
- Figure 27: Europe Volumetric Display Screen Revenue (million), by Application 2025 & 2033
- Figure 28: Europe Volumetric Display Screen Volume (K), by Application 2025 & 2033
- Figure 29: Europe Volumetric Display Screen Revenue Share (%), by Application 2025 & 2033
- Figure 30: Europe Volumetric Display Screen Volume Share (%), by Application 2025 & 2033
- Figure 31: Europe Volumetric Display Screen Revenue (million), by Type 2025 & 2033
- Figure 32: Europe Volumetric Display Screen Volume (K), by Type 2025 & 2033
- Figure 33: Europe Volumetric Display Screen Revenue Share (%), by Type 2025 & 2033
- Figure 34: Europe Volumetric Display Screen Volume Share (%), by Type 2025 & 2033
- Figure 35: Europe Volumetric Display Screen Revenue (million), by Country 2025 & 2033
- Figure 36: Europe Volumetric Display Screen Volume (K), by Country 2025 & 2033
- Figure 37: Europe Volumetric Display Screen Revenue Share (%), by Country 2025 & 2033
- Figure 38: Europe Volumetric Display Screen Volume Share (%), by Country 2025 & 2033
- Figure 39: Middle East & Africa Volumetric Display Screen Revenue (million), by Application 2025 & 2033
- Figure 40: Middle East & Africa Volumetric Display Screen Volume (K), by Application 2025 & 2033
- Figure 41: Middle East & Africa Volumetric Display Screen Revenue Share (%), by Application 2025 & 2033
- Figure 42: Middle East & Africa Volumetric Display Screen Volume Share (%), by Application 2025 & 2033
- Figure 43: Middle East & Africa Volumetric Display Screen Revenue (million), by Type 2025 & 2033
- Figure 44: Middle East & Africa Volumetric Display Screen Volume (K), by Type 2025 & 2033
- Figure 45: Middle East & Africa Volumetric Display Screen Revenue Share (%), by Type 2025 & 2033
- Figure 46: Middle East & Africa Volumetric Display Screen Volume Share (%), by Type 2025 & 2033
- Figure 47: Middle East & Africa Volumetric Display Screen Revenue (million), by Country 2025 & 2033
- Figure 48: Middle East & Africa Volumetric Display Screen Volume (K), by Country 2025 & 2033
- Figure 49: Middle East & Africa Volumetric Display Screen Revenue Share (%), by Country 2025 & 2033
- Figure 50: Middle East & Africa Volumetric Display Screen Volume Share (%), by Country 2025 & 2033
- Figure 51: Asia Pacific Volumetric Display Screen Revenue (million), by Application 2025 & 2033
- Figure 52: Asia Pacific Volumetric Display Screen Volume (K), by Application 2025 & 2033
- Figure 53: Asia Pacific Volumetric Display Screen Revenue Share (%), by Application 2025 & 2033
- Figure 54: Asia Pacific Volumetric Display Screen Volume Share (%), by Application 2025 & 2033
- Figure 55: Asia Pacific Volumetric Display Screen Revenue (million), by Type 2025 & 2033
- Figure 56: Asia Pacific Volumetric Display Screen Volume (K), by Type 2025 & 2033
- Figure 57: Asia Pacific Volumetric Display Screen Revenue Share (%), by Type 2025 & 2033
- Figure 58: Asia Pacific Volumetric Display Screen Volume Share (%), by Type 2025 & 2033
- Figure 59: Asia Pacific Volumetric Display Screen Revenue (million), by Country 2025 & 2033
- Figure 60: Asia Pacific Volumetric Display Screen Volume (K), by Country 2025 & 2033
- Figure 61: Asia Pacific Volumetric Display Screen Revenue Share (%), by Country 2025 & 2033
- Figure 62: Asia Pacific Volumetric Display Screen Volume Share (%), by Country 2025 & 2033
List of Tables
- Table 1: Global Volumetric Display Screen Revenue million Forecast, by Application 2020 & 2033
- Table 2: Global Volumetric Display Screen Volume K Forecast, by Application 2020 & 2033
- Table 3: Global Volumetric Display Screen Revenue million Forecast, by Type 2020 & 2033
- Table 4: Global Volumetric Display Screen Volume K Forecast, by Type 2020 & 2033
- Table 5: Global Volumetric Display Screen Revenue million Forecast, by Region 2020 & 2033
- Table 6: Global Volumetric Display Screen Volume K Forecast, by Region 2020 & 2033
- Table 7: Global Volumetric Display Screen Revenue million Forecast, by Application 2020 & 2033
- Table 8: Global Volumetric Display Screen Volume K Forecast, by Application 2020 & 2033
- Table 9: Global Volumetric Display Screen Revenue million Forecast, by Type 2020 & 2033
- Table 10: Global Volumetric Display Screen Volume K Forecast, by Type 2020 & 2033
- Table 11: Global Volumetric Display Screen Revenue million Forecast, by Country 2020 & 2033
- Table 12: Global Volumetric Display Screen Volume K Forecast, by Country 2020 & 2033
- Table 13: United States Volumetric Display Screen Revenue (million) Forecast, by Application 2020 & 2033
- Table 14: United States Volumetric Display Screen Volume (K) Forecast, by Application 2020 & 2033
- Table 15: Canada Volumetric Display Screen Revenue (million) Forecast, by Application 2020 & 2033
- Table 16: Canada Volumetric Display Screen Volume (K) Forecast, by Application 2020 & 2033
- Table 17: Mexico Volumetric Display Screen Revenue (million) Forecast, by Application 2020 & 2033
- Table 18: Mexico Volumetric Display Screen Volume (K) Forecast, by Application 2020 & 2033
- Table 19: Global Volumetric Display Screen Revenue million Forecast, by Application 2020 & 2033
- Table 20: Global Volumetric Display Screen Volume K Forecast, by Application 2020 & 2033
- Table 21: Global Volumetric Display Screen Revenue million Forecast, by Type 2020 & 2033
- Table 22: Global Volumetric Display Screen Volume K Forecast, by Type 2020 & 2033
- Table 23: Global Volumetric Display Screen Revenue million Forecast, by Country 2020 & 2033
- Table 24: Global Volumetric Display Screen Volume K Forecast, by Country 2020 & 2033
- Table 25: Brazil Volumetric Display Screen Revenue (million) Forecast, by Application 2020 & 2033
- Table 26: Brazil Volumetric Display Screen Volume (K) Forecast, by Application 2020 & 2033
- Table 27: Argentina Volumetric Display Screen Revenue (million) Forecast, by Application 2020 & 2033
- Table 28: Argentina Volumetric Display Screen Volume (K) Forecast, by Application 2020 & 2033
- Table 29: Rest of South America Volumetric Display Screen Revenue (million) Forecast, by Application 2020 & 2033
- Table 30: Rest of South America Volumetric Display Screen Volume (K) Forecast, by Application 2020 & 2033
- Table 31: Global Volumetric Display Screen Revenue million Forecast, by Application 2020 & 2033
- Table 32: Global Volumetric Display Screen Volume K Forecast, by Application 2020 & 2033
- Table 33: Global Volumetric Display Screen Revenue million Forecast, by Type 2020 & 2033
- Table 34: Global Volumetric Display Screen Volume K Forecast, by Type 2020 & 2033
- Table 35: Global Volumetric Display Screen Revenue million Forecast, by Country 2020 & 2033
- Table 36: Global Volumetric Display Screen Volume K Forecast, by Country 2020 & 2033
- Table 37: United Kingdom Volumetric Display Screen Revenue (million) Forecast, by Application 2020 & 2033
- Table 38: United Kingdom Volumetric Display Screen Volume (K) Forecast, by Application 2020 & 2033
- Table 39: Germany Volumetric Display Screen Revenue (million) Forecast, by Application 2020 & 2033
- Table 40: Germany Volumetric Display Screen Volume (K) Forecast, by Application 2020 & 2033
- Table 41: France Volumetric Display Screen Revenue (million) Forecast, by Application 2020 & 2033
- Table 42: France Volumetric Display Screen Volume (K) Forecast, by Application 2020 & 2033
- Table 43: Italy Volumetric Display Screen Revenue (million) Forecast, by Application 2020 & 2033
- Table 44: Italy Volumetric Display Screen Volume (K) Forecast, by Application 2020 & 2033
- Table 45: Spain Volumetric Display Screen Revenue (million) Forecast, by Application 2020 & 2033
- Table 46: Spain Volumetric Display Screen Volume (K) Forecast, by Application 2020 & 2033
- Table 47: Russia Volumetric Display Screen Revenue (million) Forecast, by Application 2020 & 2033
- Table 48: Russia Volumetric Display Screen Volume (K) Forecast, by Application 2020 & 2033
- Table 49: Benelux Volumetric Display Screen Revenue (million) Forecast, by Application 2020 & 2033
- Table 50: Benelux Volumetric Display Screen Volume (K) Forecast, by Application 2020 & 2033
- Table 51: Nordics Volumetric Display Screen Revenue (million) Forecast, by Application 2020 & 2033
- Table 52: Nordics Volumetric Display Screen Volume (K) Forecast, by Application 2020 & 2033
- Table 53: Rest of Europe Volumetric Display Screen Revenue (million) Forecast, by Application 2020 & 2033
- Table 54: Rest of Europe Volumetric Display Screen Volume (K) Forecast, by Application 2020 & 2033
- Table 55: Global Volumetric Display Screen Revenue million Forecast, by Application 2020 & 2033
- Table 56: Global Volumetric Display Screen Volume K Forecast, by Application 2020 & 2033
- Table 57: Global Volumetric Display Screen Revenue million Forecast, by Type 2020 & 2033
- Table 58: Global Volumetric Display Screen Volume K Forecast, by Type 2020 & 2033
- Table 59: Global Volumetric Display Screen Revenue million Forecast, by Country 2020 & 2033
- Table 60: Global Volumetric Display Screen Volume K Forecast, by Country 2020 & 2033
- Table 61: Turkey Volumetric Display Screen Revenue (million) Forecast, by Application 2020 & 2033
- Table 62: Turkey Volumetric Display Screen Volume (K) Forecast, by Application 2020 & 2033
- Table 63: Israel Volumetric Display Screen Revenue (million) Forecast, by Application 2020 & 2033
- Table 64: Israel Volumetric Display Screen Volume (K) Forecast, by Application 2020 & 2033
- Table 65: GCC Volumetric Display Screen Revenue (million) Forecast, by Application 2020 & 2033
- Table 66: GCC Volumetric Display Screen Volume (K) Forecast, by Application 2020 & 2033
- Table 67: North Africa Volumetric Display Screen Revenue (million) Forecast, by Application 2020 & 2033
- Table 68: North Africa Volumetric Display Screen Volume (K) Forecast, by Application 2020 & 2033
- Table 69: South Africa Volumetric Display Screen Revenue (million) Forecast, by Application 2020 & 2033
- Table 70: South Africa Volumetric Display Screen Volume (K) Forecast, by Application 2020 & 2033
- Table 71: Rest of Middle East & Africa Volumetric Display Screen Revenue (million) Forecast, by Application 2020 & 2033
- Table 72: Rest of Middle East & Africa Volumetric Display Screen Volume (K) Forecast, by Application 2020 & 2033
- Table 73: Global Volumetric Display Screen Revenue million Forecast, by Application 2020 & 2033
- Table 74: Global Volumetric Display Screen Volume K Forecast, by Application 2020 & 2033
- Table 75: Global Volumetric Display Screen Revenue million Forecast, by Type 2020 & 2033
- Table 76: Global Volumetric Display Screen Volume K Forecast, by Type 2020 & 2033
- Table 77: Global Volumetric Display Screen Revenue million Forecast, by Country 2020 & 2033
- Table 78: Global Volumetric Display Screen Volume K Forecast, by Country 2020 & 2033
- Table 79: China Volumetric Display Screen Revenue (million) Forecast, by Application 2020 & 2033
- Table 80: China Volumetric Display Screen Volume (K) Forecast, by Application 2020 & 2033
- Table 81: India Volumetric Display Screen Revenue (million) Forecast, by Application 2020 & 2033
- Table 82: India Volumetric Display Screen Volume (K) Forecast, by Application 2020 & 2033
- Table 83: Japan Volumetric Display Screen Revenue (million) Forecast, by Application 2020 & 2033
- Table 84: Japan Volumetric Display Screen Volume (K) Forecast, by Application 2020 & 2033
- Table 85: South Korea Volumetric Display Screen Revenue (million) Forecast, by Application 2020 & 2033
- Table 86: South Korea Volumetric Display Screen Volume (K) Forecast, by Application 2020 & 2033
- Table 87: ASEAN Volumetric Display Screen Revenue (million) Forecast, by Application 2020 & 2033
- Table 88: ASEAN Volumetric Display Screen Volume (K) Forecast, by Application 2020 & 2033
- Table 89: Oceania Volumetric Display Screen Revenue (million) Forecast, by Application 2020 & 2033
- Table 90: Oceania Volumetric Display Screen Volume (K) Forecast, by Application 2020 & 2033
- Table 91: Rest of Asia Pacific Volumetric Display Screen Revenue (million) Forecast, by Application 2020 & 2033
- Table 92: Rest of Asia Pacific Volumetric Display Screen Volume (K) Forecast, by Application 2020 & 2033
Frequently Asked Questions
1. What is the projected Compound Annual Growth Rate (CAGR) of the Volumetric Display Screen?
The projected CAGR is approximately 30.9%.
2. Which companies are prominent players in the Volumetric Display Screen?
Key companies in the market include 3Dicons, Afriten Technologies, Dicon, Euroscreen, Fujipream, Holoxica, HYPERVSN, Kelyn Technologies, Leia, LianTronics, LightSpace Technologies, Merck KGaA, Seekway Technology, Volucap, Zebra Imaging.
3. What are the main segments of the Volumetric Display Screen?
The market segments include Application, Type.
4. Can you provide details about the market size?
The market size is estimated to be USD 553.63 million as of 2022.
5. What are some drivers contributing to market growth?
N/A
6. What are the notable trends driving market growth?
N/A
7. Are there any restraints impacting market growth?
N/A
8. Can you provide examples of recent developments in the market?
N/A
9. What pricing options are available for accessing the report?
Pricing options include single-user, multi-user, and enterprise licenses priced at USD 3950.00, USD 5925.00, and USD 7900.00 respectively.
10. Is the market size provided in terms of value or volume?
The market size is provided in terms of value, measured in million and volume, measured in K.
11. Are there any specific market keywords associated with the report?
Yes, the market keyword associated with the report is "Volumetric Display Screen," which aids in identifying and referencing the specific market segment covered.
12. How do I determine which pricing option suits my needs best?
The pricing options vary based on user requirements and access needs. Individual users may opt for single-user licenses, while businesses requiring broader access may choose multi-user or enterprise licenses for cost-effective access to the report.
13. Are there any additional resources or data provided in the Volumetric Display Screen report?
While the report offers comprehensive insights, it's advisable to review the specific contents or supplementary materials provided to ascertain if additional resources or data are available.
14. How can I stay updated on further developments or reports in the Volumetric Display Screen?
To stay informed about further developments, trends, and reports in the Volumetric Display Screen, consider subscribing to industry newsletters, following relevant companies and organizations, or regularly checking reputable industry news sources and publications.
Methodology
Step 1 - Identification of Relevant Samples Size from Population Database


Step 2 - Approaches for Defining Global Market Size (Value, Volume* & Price*)

Note*: In applicable scenarios
Step 3 - Data Sources
Primary Research
- Web Analytics
- Survey Reports
- Research Institute
- Latest Research Reports
- Opinion Leaders
Secondary Research
- Annual Reports
- White Paper
- Latest Press Release
- Industry Association
- Paid Database
- Investor Presentations

Step 4 - Data Triangulation
Involves using different sources of information in order to increase the validity of a study
These sources are likely to be stakeholders in a program - participants, other researchers, program staff, other community members, and so on.
Then we put all data in single framework & apply various statistical tools to find out the dynamic on the market.
During the analysis stage, feedback from the stakeholder groups would be compared to determine areas of agreement as well as areas of divergence