

Key Insights
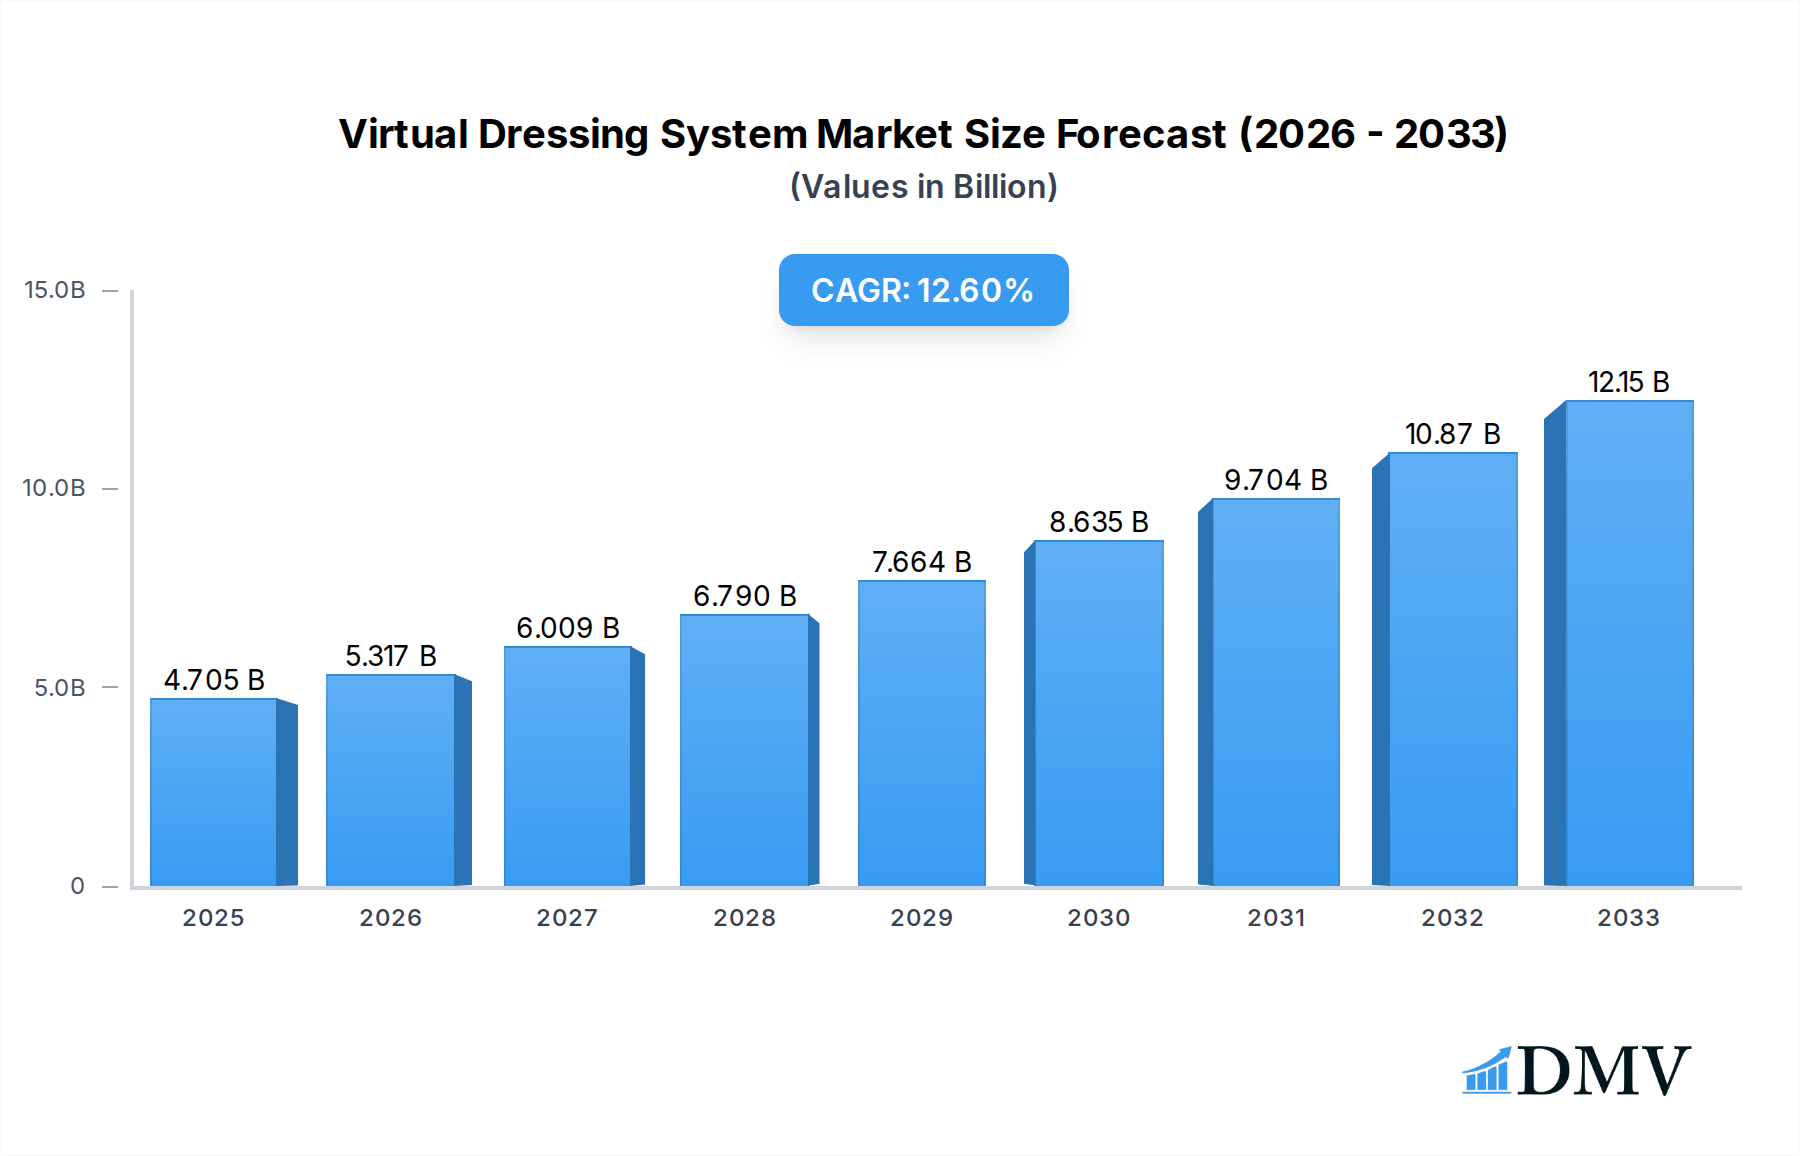
The Virtual Dressing System market is poised for substantial expansion, projected to reach $4705 million by 2025, driven by a remarkable compound annual growth rate (CAGR) of 13%. This robust growth is fueled by escalating demand for enhanced online and in-store shopping experiences, a crucial element for overcoming the limitations of traditional retail and e-commerce. The increasing adoption of augmented reality (AR) and artificial intelligence (AI) technologies is central to this trend, enabling virtual try-ons that bridge the gap between digital browsing and physical product evaluation. Key drivers include the desire to reduce return rates, improve customer satisfaction, and create more engaging retail environments. The market is segmented into E-commerce and Physical Store applications, with solutions encompassing Hardware, Software, and Services, reflecting a comprehensive approach to integrating virtual dressing capabilities across diverse retail touchpoints. The growth trajectory is further supported by substantial investments in technological advancements and the strategic expansion plans of leading market players.

Virtual Dressing System Market Size (In Billion)
The virtual dressing system market is experiencing a dynamic shift, with significant growth anticipated throughout the forecast period. The integration of advanced technologies like AI-powered body scanning and personalized styling recommendations is redefining customer engagement in both online and offline retail spaces. While the adoption in physical stores aims to revolutionize the fitting room experience, its impact on e-commerce is equally profound, offering a more confident and informed purchasing journey for consumers. Factors such as the growing influence of social commerce and the increasing preference for personalized shopping experiences are also contributing to the market's upward trajectory. However, challenges such as high initial investment costs for sophisticated hardware and the need for seamless integration with existing retail infrastructures may present some restraints, though these are expected to be overcome by ongoing technological innovation and the clear return on investment in terms of reduced returns and increased sales conversions. The global adoption is expected to see North America and Europe leading in early implementation, with Asia Pacific showing the fastest growth potential due to its rapidly expanding e-commerce landscape.
Virtual Dressing System Company Market Share
Virtual Dressing System Market Report: Comprehensive Analysis and Strategic Forecast (2019–2033)
This in-depth report provides a comprehensive analysis of the global Virtual Dressing System market, offering critical insights into its composition, trends, evolution, regional dominance, product innovations, growth drivers, obstacles, and future opportunities. Covering the period from 2019 to 2033, with a base year of 2025 and a forecast period extending to 2033, this report is an indispensable resource for stakeholders seeking to understand and capitalize on this rapidly expanding sector. The virtual dressing system market is poised for significant expansion, driven by advancements in augmented reality (AR), artificial intelligence (AI), and 3D visualization technologies, transforming the retail landscape for both e-commerce and physical stores.
Virtual Dressing System Market Composition & Trends
The Virtual Dressing System market is characterized by a dynamic and evolving competitive landscape, with key players continuously innovating to capture market share. Market concentration is moderate, with a growing number of specialized companies emerging alongside established technology providers. Innovation catalysts include the increasing demand for personalized shopping experiences, the drive to reduce returns in e-commerce, and the adoption of immersive technologies in retail. Regulatory landscapes are evolving, with a focus on data privacy and the ethical use of AI, impacting how virtual try-on solutions are developed and deployed. Substitute products, such as traditional sizing guides and mannequin displays, are gradually being displaced by more interactive and personalized virtual solutions. End-user profiles range from fashion retailers and apparel brands to online marketplaces and direct-to-consumer (DTC) businesses. Mergers and acquisitions (M&A) activities are expected to increase as larger entities seek to integrate cutting-edge virtual dressing technologies into their offerings. For instance, M&A deal values are projected to reach hundreds of millions by 2030.
- Market Share Distribution: The e-commerce segment holds a substantial market share, estimated at over 60% in 2025, driven by its scalability and reach.
- M&A Activity: Several strategic acquisitions are anticipated, with deal values potentially exceeding $500 million by 2028, consolidating market power and fostering innovation.
- Innovation Focus: Key areas of innovation include hyper-realistic avatar creation, AI-powered body scanning, and seamless integration with existing e-commerce platforms.
Virtual Dressing System Industry Evolution
The Virtual Dressing System industry has witnessed remarkable evolution since 2019, transforming from nascent concepts to sophisticated, integrated solutions impacting both online and offline retail experiences. This evolution is marked by significant technological advancements, a substantial increase in market growth trajectories, and a profound shift in consumer demands for more engaging and personalized shopping journeys. Historically, the market's growth from 2019–2024 was characterized by early adoption by visionary retailers and a focus on basic 3D visualization. The base year of 2025 represents a critical inflection point where virtual dressing systems are becoming mainstream, with an estimated market size of $3.5 billion. The projected growth rate from 2025 to 2033 is robust, with an anticipated Compound Annual Growth Rate (CAGR) of approximately 25%. This expansion is fueled by the increasing integration of Artificial Intelligence (AI) for hyper-realistic avatar generation and personalized fit recommendations, and the proliferation of Augmented Reality (AR) technologies enabling virtual try-on experiences directly on consumers' devices.
Technological advancements have been the bedrock of this evolution. Early systems relied on static 3D models, but contemporary solutions leverage advanced algorithms for dynamic body scanning and accurate garment simulation, accounting for fabric drape and movement. This has led to a significant increase in the accuracy and realism of virtual try-ons, boosting consumer confidence and reducing the likelihood of returns, a major pain point for online apparel sales. Adoption metrics are steadily climbing, with an estimated 40% of major e-commerce fashion retailers expected to have implemented some form of virtual dressing technology by the end of 2025. Furthermore, the integration of virtual dressing into physical stores, offering augmented reality mirrors and interactive fitting rooms, is gaining traction, creating a seamless omnichannel experience. Consumer demand for convenience, personalization, and reduced environmental impact (through fewer returns) are powerful drivers. As consumers become more comfortable with digital interactions, the demand for immersive and interactive shopping experiences will only intensify. The industry is moving towards more sophisticated solutions that offer not just visualization but also personalized styling advice and precise fit predictions, further solidifying its indispensable role in modern retail. The market size is projected to exceed $15 billion by 2033, a testament to its transformative impact.
Leading Regions, Countries, or Segments in Virtual Dressing System
The Virtual Dressing System market's dominance is significantly influenced by key segments, particularly the E-commerce application. This segment is projected to maintain its leading position throughout the forecast period (2025–2033) due to its inherent scalability, extensive reach, and the direct impact virtual try-on solutions have on reducing online purchase friction and return rates. North America and Europe are expected to be the leading regions, driven by high internet penetration, strong e-commerce adoption, and a technologically savvy consumer base receptive to innovative retail solutions. The Software type is also a dominant force, as it forms the core technology enabling virtual dressing experiences across various platforms and devices.
- Dominant Application: E-commerce: The e-commerce segment's leadership is underpinned by its ability to address critical challenges such as high return rates, estimated to be as high as 30% for apparel purchases, and the lack of tactile experience in online shopping. Virtual dressing systems directly mitigate these issues, offering customers a more confident purchasing decision and thereby boosting conversion rates. Investment trends in this segment are robust, with venture capital funding flowing into innovative startups and established players expanding their offerings.
- Leading Regional Driver: North America: This region's dominance is attributed to the presence of major global e-commerce giants and a mature retail infrastructure actively seeking digital transformation. Regulatory support for technological adoption and a strong consumer inclination towards personalized online experiences further bolster its position. The market size in North America alone is estimated to reach over $5 billion by 2030.
- Dominant Type: Software: Software solutions are the cornerstone of virtual dressing technology. Their dominance stems from their adaptability, enabling integration with various hardware and service components. The increasing sophistication of AI and AR algorithms powering these software solutions directly contributes to their widespread adoption. The global market for virtual dressing software is expected to grow at a CAGR of over 28% from 2025 to 2033.
- Key Segment Impact: Physical Store Integration: While e-commerce leads, the integration of virtual dressing systems into physical stores is a significant growth area. This includes AR mirrors and smart fitting rooms, enhancing in-store experiences and bridging the gap between online and offline retail. Investment in this sub-segment is projected to grow by 20% annually.
Virtual Dressing System Product Innovations
Product innovations in the Virtual Dressing System market are rapidly enhancing realism and user engagement. Companies are focusing on developing hyper-realistic 3D garment simulations that accurately replicate fabric textures, drapes, and movement, offering an almost indistinguishable experience from physical try-ons. AI-powered body scanning technologies are becoming more sophisticated, enabling precise body measurements and the creation of highly personalized avatars in seconds, a significant improvement over earlier, more generalized models. The integration of augmented reality (AR) into mobile applications and smart mirrors allows for seamless virtual try-on experiences directly in consumers' homes or retail environments. Performance metrics such as accuracy in fit prediction, reduction in return rates (projected to decrease by up to 20% with effective implementation), and user engagement time (increasing by an average of 30%) are key indicators of successful product innovation.
Propelling Factors for Virtual Dressing System Growth
Several key growth drivers are propelling the Virtual Dressing System market forward. Technological advancements, particularly in Augmented Reality (AR), Artificial Intelligence (AI), and 3D modeling, are enabling more realistic and immersive virtual try-on experiences. The burgeoning growth of e-commerce and the increasing demand for personalized shopping experiences are creating a strong market pull. Furthermore, the desire to reduce high return rates in online fashion retail, which can cost companies millions annually, is a significant economic incentive. Regulatory support for digital transformation in retail and increasing consumer adoption of digital solutions are also contributing to market expansion.
- Technological Advancements: The continuous improvement of AI algorithms for avatar creation and garment simulation.
- E-commerce Expansion: The global e-commerce market is projected to reach over $8 trillion by 2028, driving the need for virtual fitting solutions.
- Return Rate Reduction: A 15% average reduction in apparel return rates is achievable with effective virtual dressing implementation.
- Consumer Demand: Growing preference for personalized and convenient shopping experiences.
Obstacles in the Virtual Dressing System Market
Despite its promising growth, the Virtual Dressing System market faces several obstacles. The high initial investment cost for sophisticated hardware and software can be a barrier for smaller retailers. Ensuring data privacy and security for body scan data is a significant concern, requiring robust compliance with regulations like GDPR. The development of accurate and realistic 3D garment models for a vast array of clothing items remains a technical challenge, demanding significant resources and expertise. Finally, user adoption can be hindered by the learning curve associated with some technologies and the need for widespread consumer trust in the accuracy of virtual try-ons.
- High Implementation Costs: Initial setup can range from hundreds of thousands to millions of dollars for advanced systems.
- Data Privacy Concerns: Ensuring compliance with evolving data protection laws.
- 3D Model Accuracy: The complexity of replicating diverse fabric types and fits.
- User Adoption Challenges: Overcoming skepticism and familiarizing users with new technologies.
Future Opportunities in Virtual Dressing System
The Virtual Dressing System market is ripe with future opportunities. The expansion into emerging markets in Asia-Pacific and Latin America, where e-commerce is rapidly growing, presents a significant untapped potential. The integration of virtual dressing with virtual reality (VR) environments offers new avenues for immersive shopping experiences. Furthermore, advancements in AI can lead to hyper-personalized styling recommendations and virtual personal shoppers. The use of virtual dressing in the metaverse and gaming industries also opens up entirely new revenue streams and engagement models.
- Emerging Market Expansion: Capturing market share in regions with rapidly growing e-commerce penetration.
- VR/Metaverse Integration: Creating truly immersive and interactive digital shopping worlds.
- AI-Powered Personalization: Offering advanced styling advice and fitting recommendations.
- Cross-Industry Applications: Exploring use cases beyond fashion, such as in furniture or automotive retail.
Major Players in the Virtual Dressing System Ecosystem
- Magic Mirror
- Trimirror
- Fit Analytics
- AstraFit
- Rakuten Fits Me
- ELSE Corp
- Reactive Reality GmbH
- WEARFITS
- Coitor IT Tech
- Quytech
- Auglio
- Sizebay
- Virtusize
- True Fit
- Kivisense Technology
- Beijing SanyTouch Technology
- Beijing Huatang Liye Technology
Key Developments in Virtual Dressing System Industry
- 2023: Launch of advanced AI-powered body scanning technology by Kivisense Technology, enabling sub-millimeter accuracy for avatar creation.
- 2023: Fit Analytics announces strategic partnerships with several major fashion retailers to integrate their virtual try-on solutions across millions of product SKUs.
- 2024: ELSE Corp unveils a new cloud-based platform for creating highly realistic 3D apparel models, significantly reducing production time and cost.
- 2024: Reactive Reality GmbH secures substantial funding to expand its AR-powered virtual fitting room solutions to physical retail spaces globally.
- 2025: Magic Mirror introduces its next-generation smart mirror with integrated AI for personalized style recommendations and real-time feedback on garment fit.
- 2025: Trimirror expands its service offerings to include virtual fashion shows and influencer marketing integration.
- 2025: Quytech launches a new SDK for seamless integration of virtual dressing features into existing mobile applications, estimated to reach millions of users.
- 2026: AstraFit partners with a leading logistics provider to further optimize return management through improved virtual fit accuracy.
- 2027: Virtusize enhances its virtual fitting technology with advanced material simulation, accounting for stretch and weight of fabrics.
- 2028: Rakuten Fits Me announces a significant expansion into the Asian market with localized virtual fitting solutions.
- 2029: Auglio develops a novel solution for virtual try-on of accessories, including jewelry and eyewear.
- 2030: Sizebay introduces a comprehensive virtual sizing solution for bespoke and custom-made clothing.
- 2031: True Fit enhances its AI engine to predict garment fit based on user-uploaded images, further reducing the need for physical measurements.
- 2032: WEARFITS collaborates with sportswear brands to develop virtual try-on solutions for performance apparel.
- 2033: Beijing SanyTouch Technology and Beijing Huatang Liye Technology merge, creating a dominant force in the Asian virtual dressing market.
Strategic Virtual Dressing System Market Forecast
The Virtual Dressing System market is projected for substantial growth, driven by an increasing convergence of technological innovation and evolving consumer expectations. Strategic investments in AI and AR technologies will continue to enhance the realism and utility of virtual try-on solutions, leading to a projected market size exceeding $15 billion by 2033. The reduction in e-commerce return rates, a significant cost factor for retailers, alongside the enhanced customer engagement and conversion rates offered by virtual dressing, will be key growth catalysts. Furthermore, the expansion into new geographical markets and the integration of virtual dressing into emerging digital platforms like the metaverse will unlock substantial future opportunities, solidifying its position as a transformative force in the retail industry.
Virtual Dressing System Segmentation
-
1. Application
- 1.1. E-commerce
- 1.2. Physical Store
-
2. Types
- 2.1. Hardware
- 2.2. Software
- 2.3. Services
Virtual Dressing System Segmentation By Geography
-
1. North America
- 1.1. United States
- 1.2. Canada
- 1.3. Mexico
-
2. South America
- 2.1. Brazil
- 2.2. Argentina
- 2.3. Rest of South America
-
3. Europe
- 3.1. United Kingdom
- 3.2. Germany
- 3.3. France
- 3.4. Italy
- 3.5. Spain
- 3.6. Russia
- 3.7. Benelux
- 3.8. Nordics
- 3.9. Rest of Europe
-
4. Middle East & Africa
- 4.1. Turkey
- 4.2. Israel
- 4.3. GCC
- 4.4. North Africa
- 4.5. South Africa
- 4.6. Rest of Middle East & Africa
-
5. Asia Pacific
- 5.1. China
- 5.2. India
- 5.3. Japan
- 5.4. South Korea
- 5.5. ASEAN
- 5.6. Oceania
- 5.7. Rest of Asia Pacific
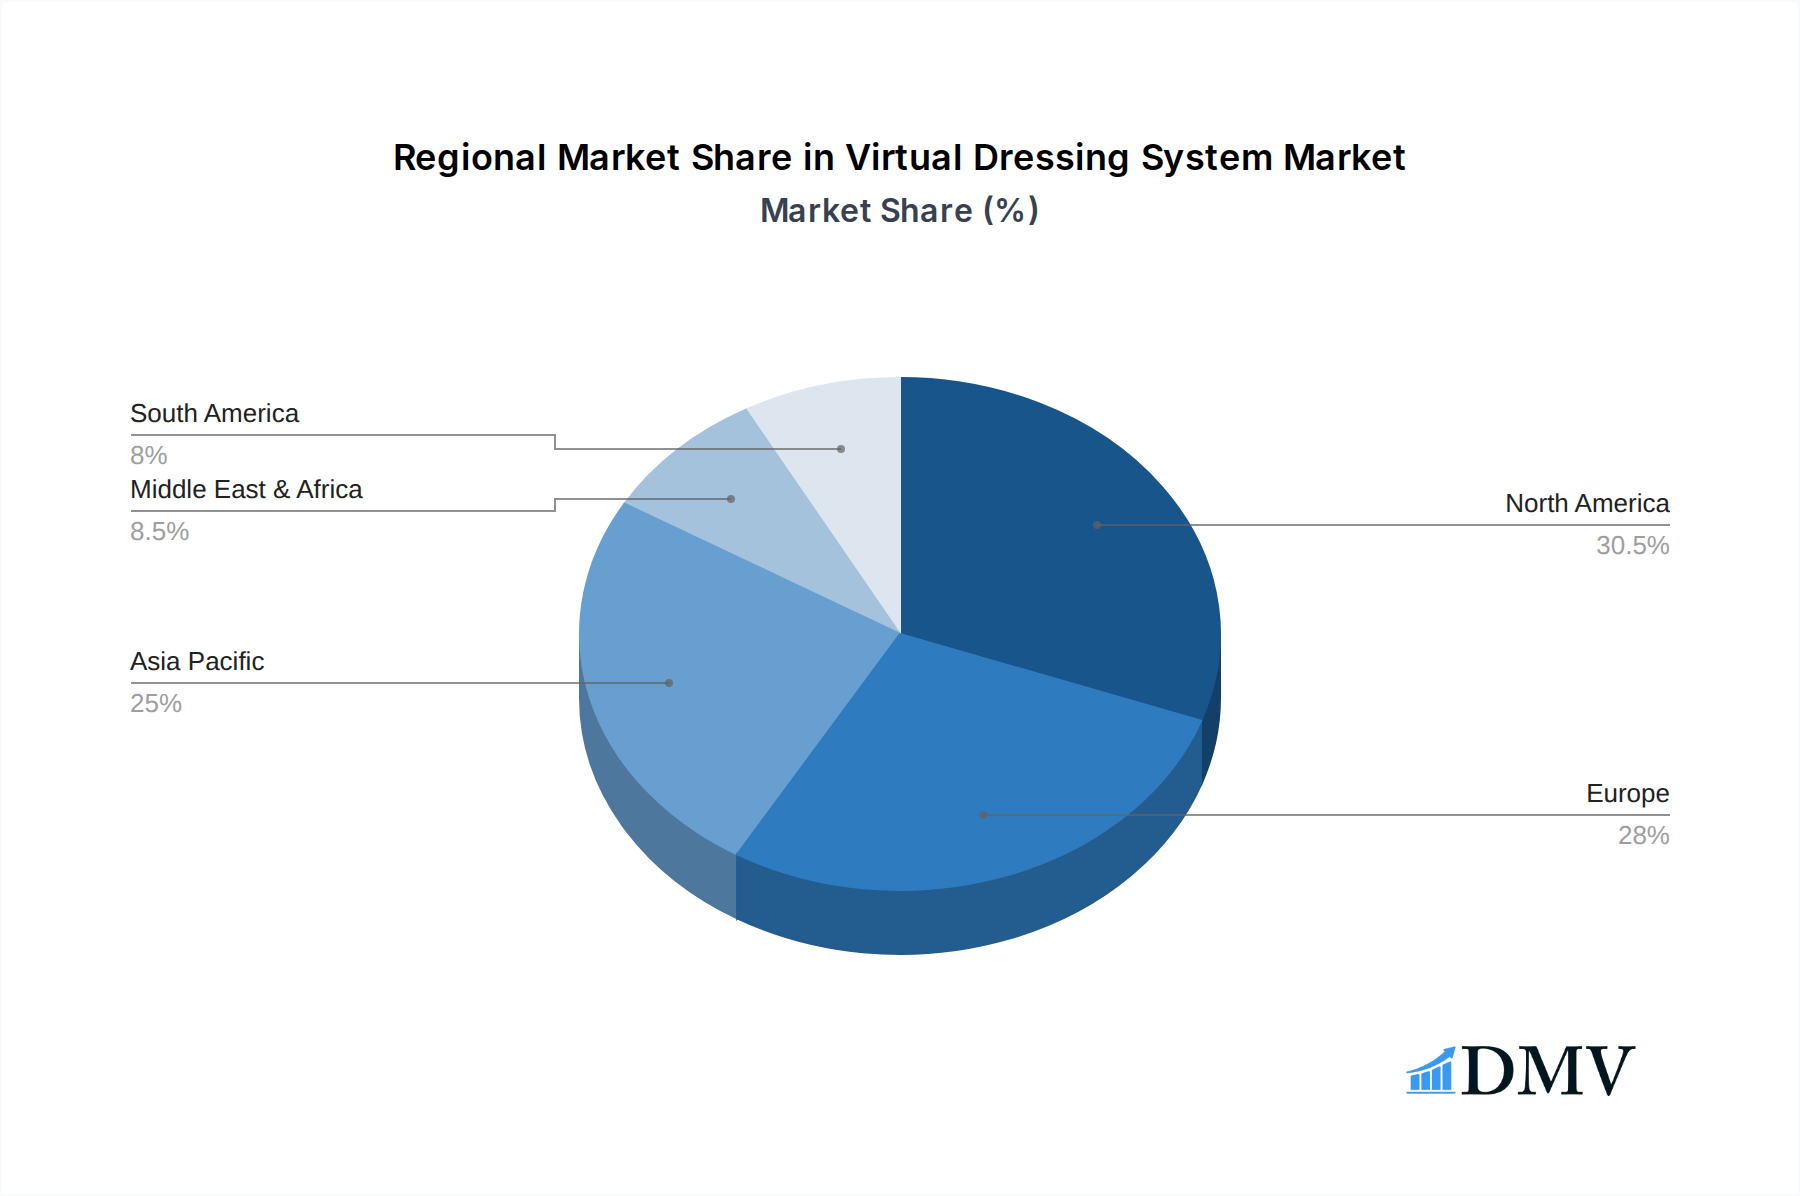
Virtual Dressing System Regional Market Share
Geographic Coverage of Virtual Dressing System
Virtual Dressing System REPORT HIGHLIGHTS
| Aspects | Details |
|---|---|
| Study Period | 2020-2034 |
| Base Year | 2025 |
| Estimated Year | 2026 |
| Forecast Period | 2026-2034 |
| Historical Period | 2020-2025 |
| Growth Rate | CAGR of 13% from 2020-2034 |
| Segmentation |
|
Table of Contents
- 1. Introduction
- 1.1. Research Scope
- 1.2. Market Segmentation
- 1.3. Research Methodology
- 1.4. Definitions and Assumptions
- 2. Executive Summary
- 2.1. Introduction
- 3. Market Dynamics
- 3.1. Introduction
- 3.2. Market Drivers
- 3.3. Market Restrains
- 3.4. Market Trends
- 4. Market Factor Analysis
- 4.1. Porters Five Forces
- 4.2. Supply/Value Chain
- 4.3. PESTEL analysis
- 4.4. Market Entropy
- 4.5. Patent/Trademark Analysis
- 5. Global Virtual Dressing System Analysis, Insights and Forecast, 2020-2032
- 5.1. Market Analysis, Insights and Forecast - by Application
- 5.1.1. E-commerce
- 5.1.2. Physical Store
- 5.2. Market Analysis, Insights and Forecast - by Types
- 5.2.1. Hardware
- 5.2.2. Software
- 5.2.3. Services
- 5.3. Market Analysis, Insights and Forecast - by Region
- 5.3.1. North America
- 5.3.2. South America
- 5.3.3. Europe
- 5.3.4. Middle East & Africa
- 5.3.5. Asia Pacific
- 5.1. Market Analysis, Insights and Forecast - by Application
- 6. North America Virtual Dressing System Analysis, Insights and Forecast, 2020-2032
- 6.1. Market Analysis, Insights and Forecast - by Application
- 6.1.1. E-commerce
- 6.1.2. Physical Store
- 6.2. Market Analysis, Insights and Forecast - by Types
- 6.2.1. Hardware
- 6.2.2. Software
- 6.2.3. Services
- 6.1. Market Analysis, Insights and Forecast - by Application
- 7. South America Virtual Dressing System Analysis, Insights and Forecast, 2020-2032
- 7.1. Market Analysis, Insights and Forecast - by Application
- 7.1.1. E-commerce
- 7.1.2. Physical Store
- 7.2. Market Analysis, Insights and Forecast - by Types
- 7.2.1. Hardware
- 7.2.2. Software
- 7.2.3. Services
- 7.1. Market Analysis, Insights and Forecast - by Application
- 8. Europe Virtual Dressing System Analysis, Insights and Forecast, 2020-2032
- 8.1. Market Analysis, Insights and Forecast - by Application
- 8.1.1. E-commerce
- 8.1.2. Physical Store
- 8.2. Market Analysis, Insights and Forecast - by Types
- 8.2.1. Hardware
- 8.2.2. Software
- 8.2.3. Services
- 8.1. Market Analysis, Insights and Forecast - by Application
- 9. Middle East & Africa Virtual Dressing System Analysis, Insights and Forecast, 2020-2032
- 9.1. Market Analysis, Insights and Forecast - by Application
- 9.1.1. E-commerce
- 9.1.2. Physical Store
- 9.2. Market Analysis, Insights and Forecast - by Types
- 9.2.1. Hardware
- 9.2.2. Software
- 9.2.3. Services
- 9.1. Market Analysis, Insights and Forecast - by Application
- 10. Asia Pacific Virtual Dressing System Analysis, Insights and Forecast, 2020-2032
- 10.1. Market Analysis, Insights and Forecast - by Application
- 10.1.1. E-commerce
- 10.1.2. Physical Store
- 10.2. Market Analysis, Insights and Forecast - by Types
- 10.2.1. Hardware
- 10.2.2. Software
- 10.2.3. Services
- 10.1. Market Analysis, Insights and Forecast - by Application
- 11. Competitive Analysis
- 11.1. Global Market Share Analysis 2025
- 11.2. Company Profiles
- 11.2.1 Magic Mirror
- 11.2.1.1. Overview
- 11.2.1.2. Products
- 11.2.1.3. SWOT Analysis
- 11.2.1.4. Recent Developments
- 11.2.1.5. Financials (Based on Availability)
- 11.2.2 Trimirror
- 11.2.2.1. Overview
- 11.2.2.2. Products
- 11.2.2.3. SWOT Analysis
- 11.2.2.4. Recent Developments
- 11.2.2.5. Financials (Based on Availability)
- 11.2.3 Fit Analytics
- 11.2.3.1. Overview
- 11.2.3.2. Products
- 11.2.3.3. SWOT Analysis
- 11.2.3.4. Recent Developments
- 11.2.3.5. Financials (Based on Availability)
- 11.2.4 AstraFit
- 11.2.4.1. Overview
- 11.2.4.2. Products
- 11.2.4.3. SWOT Analysis
- 11.2.4.4. Recent Developments
- 11.2.4.5. Financials (Based on Availability)
- 11.2.5 Rakuten Fits Me
- 11.2.5.1. Overview
- 11.2.5.2. Products
- 11.2.5.3. SWOT Analysis
- 11.2.5.4. Recent Developments
- 11.2.5.5. Financials (Based on Availability)
- 11.2.6 ELSE Corp
- 11.2.6.1. Overview
- 11.2.6.2. Products
- 11.2.6.3. SWOT Analysis
- 11.2.6.4. Recent Developments
- 11.2.6.5. Financials (Based on Availability)
- 11.2.7 Reactive Reality GmbH
- 11.2.7.1. Overview
- 11.2.7.2. Products
- 11.2.7.3. SWOT Analysis
- 11.2.7.4. Recent Developments
- 11.2.7.5. Financials (Based on Availability)
- 11.2.8 WEARFITS
- 11.2.8.1. Overview
- 11.2.8.2. Products
- 11.2.8.3. SWOT Analysis
- 11.2.8.4. Recent Developments
- 11.2.8.5. Financials (Based on Availability)
- 11.2.9 Coitor IT Tech
- 11.2.9.1. Overview
- 11.2.9.2. Products
- 11.2.9.3. SWOT Analysis
- 11.2.9.4. Recent Developments
- 11.2.9.5. Financials (Based on Availability)
- 11.2.10 Quytech
- 11.2.10.1. Overview
- 11.2.10.2. Products
- 11.2.10.3. SWOT Analysis
- 11.2.10.4. Recent Developments
- 11.2.10.5. Financials (Based on Availability)
- 11.2.11 Auglio
- 11.2.11.1. Overview
- 11.2.11.2. Products
- 11.2.11.3. SWOT Analysis
- 11.2.11.4. Recent Developments
- 11.2.11.5. Financials (Based on Availability)
- 11.2.12 Sizebay
- 11.2.12.1. Overview
- 11.2.12.2. Products
- 11.2.12.3. SWOT Analysis
- 11.2.12.4. Recent Developments
- 11.2.12.5. Financials (Based on Availability)
- 11.2.13 Virtusize
- 11.2.13.1. Overview
- 11.2.13.2. Products
- 11.2.13.3. SWOT Analysis
- 11.2.13.4. Recent Developments
- 11.2.13.5. Financials (Based on Availability)
- 11.2.14 True Fit
- 11.2.14.1. Overview
- 11.2.14.2. Products
- 11.2.14.3. SWOT Analysis
- 11.2.14.4. Recent Developments
- 11.2.14.5. Financials (Based on Availability)
- 11.2.15 Kivisense Technology
- 11.2.15.1. Overview
- 11.2.15.2. Products
- 11.2.15.3. SWOT Analysis
- 11.2.15.4. Recent Developments
- 11.2.15.5. Financials (Based on Availability)
- 11.2.16 Beijing SanyTouch Technology
- 11.2.16.1. Overview
- 11.2.16.2. Products
- 11.2.16.3. SWOT Analysis
- 11.2.16.4. Recent Developments
- 11.2.16.5. Financials (Based on Availability)
- 11.2.17 Beijing Huatang Liye Technology
- 11.2.17.1. Overview
- 11.2.17.2. Products
- 11.2.17.3. SWOT Analysis
- 11.2.17.4. Recent Developments
- 11.2.17.5. Financials (Based on Availability)
- 11.2.1 Magic Mirror
List of Figures
- Figure 1: Global Virtual Dressing System Revenue Breakdown (million, %) by Region 2025 & 2033
- Figure 2: North America Virtual Dressing System Revenue (million), by Application 2025 & 2033
- Figure 3: North America Virtual Dressing System Revenue Share (%), by Application 2025 & 2033
- Figure 4: North America Virtual Dressing System Revenue (million), by Types 2025 & 2033
- Figure 5: North America Virtual Dressing System Revenue Share (%), by Types 2025 & 2033
- Figure 6: North America Virtual Dressing System Revenue (million), by Country 2025 & 2033
- Figure 7: North America Virtual Dressing System Revenue Share (%), by Country 2025 & 2033
- Figure 8: South America Virtual Dressing System Revenue (million), by Application 2025 & 2033
- Figure 9: South America Virtual Dressing System Revenue Share (%), by Application 2025 & 2033
- Figure 10: South America Virtual Dressing System Revenue (million), by Types 2025 & 2033
- Figure 11: South America Virtual Dressing System Revenue Share (%), by Types 2025 & 2033
- Figure 12: South America Virtual Dressing System Revenue (million), by Country 2025 & 2033
- Figure 13: South America Virtual Dressing System Revenue Share (%), by Country 2025 & 2033
- Figure 14: Europe Virtual Dressing System Revenue (million), by Application 2025 & 2033
- Figure 15: Europe Virtual Dressing System Revenue Share (%), by Application 2025 & 2033
- Figure 16: Europe Virtual Dressing System Revenue (million), by Types 2025 & 2033
- Figure 17: Europe Virtual Dressing System Revenue Share (%), by Types 2025 & 2033
- Figure 18: Europe Virtual Dressing System Revenue (million), by Country 2025 & 2033
- Figure 19: Europe Virtual Dressing System Revenue Share (%), by Country 2025 & 2033
- Figure 20: Middle East & Africa Virtual Dressing System Revenue (million), by Application 2025 & 2033
- Figure 21: Middle East & Africa Virtual Dressing System Revenue Share (%), by Application 2025 & 2033
- Figure 22: Middle East & Africa Virtual Dressing System Revenue (million), by Types 2025 & 2033
- Figure 23: Middle East & Africa Virtual Dressing System Revenue Share (%), by Types 2025 & 2033
- Figure 24: Middle East & Africa Virtual Dressing System Revenue (million), by Country 2025 & 2033
- Figure 25: Middle East & Africa Virtual Dressing System Revenue Share (%), by Country 2025 & 2033
- Figure 26: Asia Pacific Virtual Dressing System Revenue (million), by Application 2025 & 2033
- Figure 27: Asia Pacific Virtual Dressing System Revenue Share (%), by Application 2025 & 2033
- Figure 28: Asia Pacific Virtual Dressing System Revenue (million), by Types 2025 & 2033
- Figure 29: Asia Pacific Virtual Dressing System Revenue Share (%), by Types 2025 & 2033
- Figure 30: Asia Pacific Virtual Dressing System Revenue (million), by Country 2025 & 2033
- Figure 31: Asia Pacific Virtual Dressing System Revenue Share (%), by Country 2025 & 2033
List of Tables
- Table 1: Global Virtual Dressing System Revenue million Forecast, by Application 2020 & 2033
- Table 2: Global Virtual Dressing System Revenue million Forecast, by Types 2020 & 2033
- Table 3: Global Virtual Dressing System Revenue million Forecast, by Region 2020 & 2033
- Table 4: Global Virtual Dressing System Revenue million Forecast, by Application 2020 & 2033
- Table 5: Global Virtual Dressing System Revenue million Forecast, by Types 2020 & 2033
- Table 6: Global Virtual Dressing System Revenue million Forecast, by Country 2020 & 2033
- Table 7: United States Virtual Dressing System Revenue (million) Forecast, by Application 2020 & 2033
- Table 8: Canada Virtual Dressing System Revenue (million) Forecast, by Application 2020 & 2033
- Table 9: Mexico Virtual Dressing System Revenue (million) Forecast, by Application 2020 & 2033
- Table 10: Global Virtual Dressing System Revenue million Forecast, by Application 2020 & 2033
- Table 11: Global Virtual Dressing System Revenue million Forecast, by Types 2020 & 2033
- Table 12: Global Virtual Dressing System Revenue million Forecast, by Country 2020 & 2033
- Table 13: Brazil Virtual Dressing System Revenue (million) Forecast, by Application 2020 & 2033
- Table 14: Argentina Virtual Dressing System Revenue (million) Forecast, by Application 2020 & 2033
- Table 15: Rest of South America Virtual Dressing System Revenue (million) Forecast, by Application 2020 & 2033
- Table 16: Global Virtual Dressing System Revenue million Forecast, by Application 2020 & 2033
- Table 17: Global Virtual Dressing System Revenue million Forecast, by Types 2020 & 2033
- Table 18: Global Virtual Dressing System Revenue million Forecast, by Country 2020 & 2033
- Table 19: United Kingdom Virtual Dressing System Revenue (million) Forecast, by Application 2020 & 2033
- Table 20: Germany Virtual Dressing System Revenue (million) Forecast, by Application 2020 & 2033
- Table 21: France Virtual Dressing System Revenue (million) Forecast, by Application 2020 & 2033
- Table 22: Italy Virtual Dressing System Revenue (million) Forecast, by Application 2020 & 2033
- Table 23: Spain Virtual Dressing System Revenue (million) Forecast, by Application 2020 & 2033
- Table 24: Russia Virtual Dressing System Revenue (million) Forecast, by Application 2020 & 2033
- Table 25: Benelux Virtual Dressing System Revenue (million) Forecast, by Application 2020 & 2033
- Table 26: Nordics Virtual Dressing System Revenue (million) Forecast, by Application 2020 & 2033
- Table 27: Rest of Europe Virtual Dressing System Revenue (million) Forecast, by Application 2020 & 2033
- Table 28: Global Virtual Dressing System Revenue million Forecast, by Application 2020 & 2033
- Table 29: Global Virtual Dressing System Revenue million Forecast, by Types 2020 & 2033
- Table 30: Global Virtual Dressing System Revenue million Forecast, by Country 2020 & 2033
- Table 31: Turkey Virtual Dressing System Revenue (million) Forecast, by Application 2020 & 2033
- Table 32: Israel Virtual Dressing System Revenue (million) Forecast, by Application 2020 & 2033
- Table 33: GCC Virtual Dressing System Revenue (million) Forecast, by Application 2020 & 2033
- Table 34: North Africa Virtual Dressing System Revenue (million) Forecast, by Application 2020 & 2033
- Table 35: South Africa Virtual Dressing System Revenue (million) Forecast, by Application 2020 & 2033
- Table 36: Rest of Middle East & Africa Virtual Dressing System Revenue (million) Forecast, by Application 2020 & 2033
- Table 37: Global Virtual Dressing System Revenue million Forecast, by Application 2020 & 2033
- Table 38: Global Virtual Dressing System Revenue million Forecast, by Types 2020 & 2033
- Table 39: Global Virtual Dressing System Revenue million Forecast, by Country 2020 & 2033
- Table 40: China Virtual Dressing System Revenue (million) Forecast, by Application 2020 & 2033
- Table 41: India Virtual Dressing System Revenue (million) Forecast, by Application 2020 & 2033
- Table 42: Japan Virtual Dressing System Revenue (million) Forecast, by Application 2020 & 2033
- Table 43: South Korea Virtual Dressing System Revenue (million) Forecast, by Application 2020 & 2033
- Table 44: ASEAN Virtual Dressing System Revenue (million) Forecast, by Application 2020 & 2033
- Table 45: Oceania Virtual Dressing System Revenue (million) Forecast, by Application 2020 & 2033
- Table 46: Rest of Asia Pacific Virtual Dressing System Revenue (million) Forecast, by Application 2020 & 2033
Frequently Asked Questions
1. What is the projected Compound Annual Growth Rate (CAGR) of the Virtual Dressing System?
The projected CAGR is approximately 13%.
2. Which companies are prominent players in the Virtual Dressing System?
Key companies in the market include Magic Mirror, Trimirror, Fit Analytics, AstraFit, Rakuten Fits Me, ELSE Corp, Reactive Reality GmbH, WEARFITS, Coitor IT Tech, Quytech, Auglio, Sizebay, Virtusize, True Fit, Kivisense Technology, Beijing SanyTouch Technology, Beijing Huatang Liye Technology.
3. What are the main segments of the Virtual Dressing System?
The market segments include Application, Types.
4. Can you provide details about the market size?
The market size is estimated to be USD 4705 million as of 2022.
5. What are some drivers contributing to market growth?
N/A
6. What are the notable trends driving market growth?
N/A
7. Are there any restraints impacting market growth?
N/A
8. Can you provide examples of recent developments in the market?
N/A
9. What pricing options are available for accessing the report?
Pricing options include single-user, multi-user, and enterprise licenses priced at USD 3950.00, USD 5925.00, and USD 7900.00 respectively.
10. Is the market size provided in terms of value or volume?
The market size is provided in terms of value, measured in million.
11. Are there any specific market keywords associated with the report?
Yes, the market keyword associated with the report is "Virtual Dressing System," which aids in identifying and referencing the specific market segment covered.
12. How do I determine which pricing option suits my needs best?
The pricing options vary based on user requirements and access needs. Individual users may opt for single-user licenses, while businesses requiring broader access may choose multi-user or enterprise licenses for cost-effective access to the report.
13. Are there any additional resources or data provided in the Virtual Dressing System report?
While the report offers comprehensive insights, it's advisable to review the specific contents or supplementary materials provided to ascertain if additional resources or data are available.
14. How can I stay updated on further developments or reports in the Virtual Dressing System?
To stay informed about further developments, trends, and reports in the Virtual Dressing System, consider subscribing to industry newsletters, following relevant companies and organizations, or regularly checking reputable industry news sources and publications.
Methodology
Step 1 - Identification of Relevant Samples Size from Population Database


Step 2 - Approaches for Defining Global Market Size (Value, Volume* & Price*)

Note*: In applicable scenarios
Step 3 - Data Sources
Primary Research
- Web Analytics
- Survey Reports
- Research Institute
- Latest Research Reports
- Opinion Leaders
Secondary Research
- Annual Reports
- White Paper
- Latest Press Release
- Industry Association
- Paid Database
- Investor Presentations

Step 4 - Data Triangulation
Involves using different sources of information in order to increase the validity of a study
These sources are likely to be stakeholders in a program - participants, other researchers, program staff, other community members, and so on.
Then we put all data in single framework & apply various statistical tools to find out the dynamic on the market.
During the analysis stage, feedback from the stakeholder groups would be compared to determine areas of agreement as well as areas of divergence