

Key Insights
The global Virtual Business Phone Number Apps market is poised for significant expansion, projected to reach a valuation of $13.7 billion in 2023, with a robust Compound Annual Growth Rate (CAGR) of 6.5% expected through 2033. This dynamic growth is fueled by a confluence of factors, primarily driven by the increasing adoption of remote and hybrid work models across organizations of all sizes. Small and Medium Enterprises (SMEs) are actively leveraging these solutions to enhance their professional image and streamline communication without the need for expensive traditional phone systems. Large enterprises, on the other hand, are integrating virtual phone number apps for improved global reach, advanced call management features, and enhanced customer service capabilities. The flexibility and cost-effectiveness offered by these applications are paramount in today's competitive business landscape.
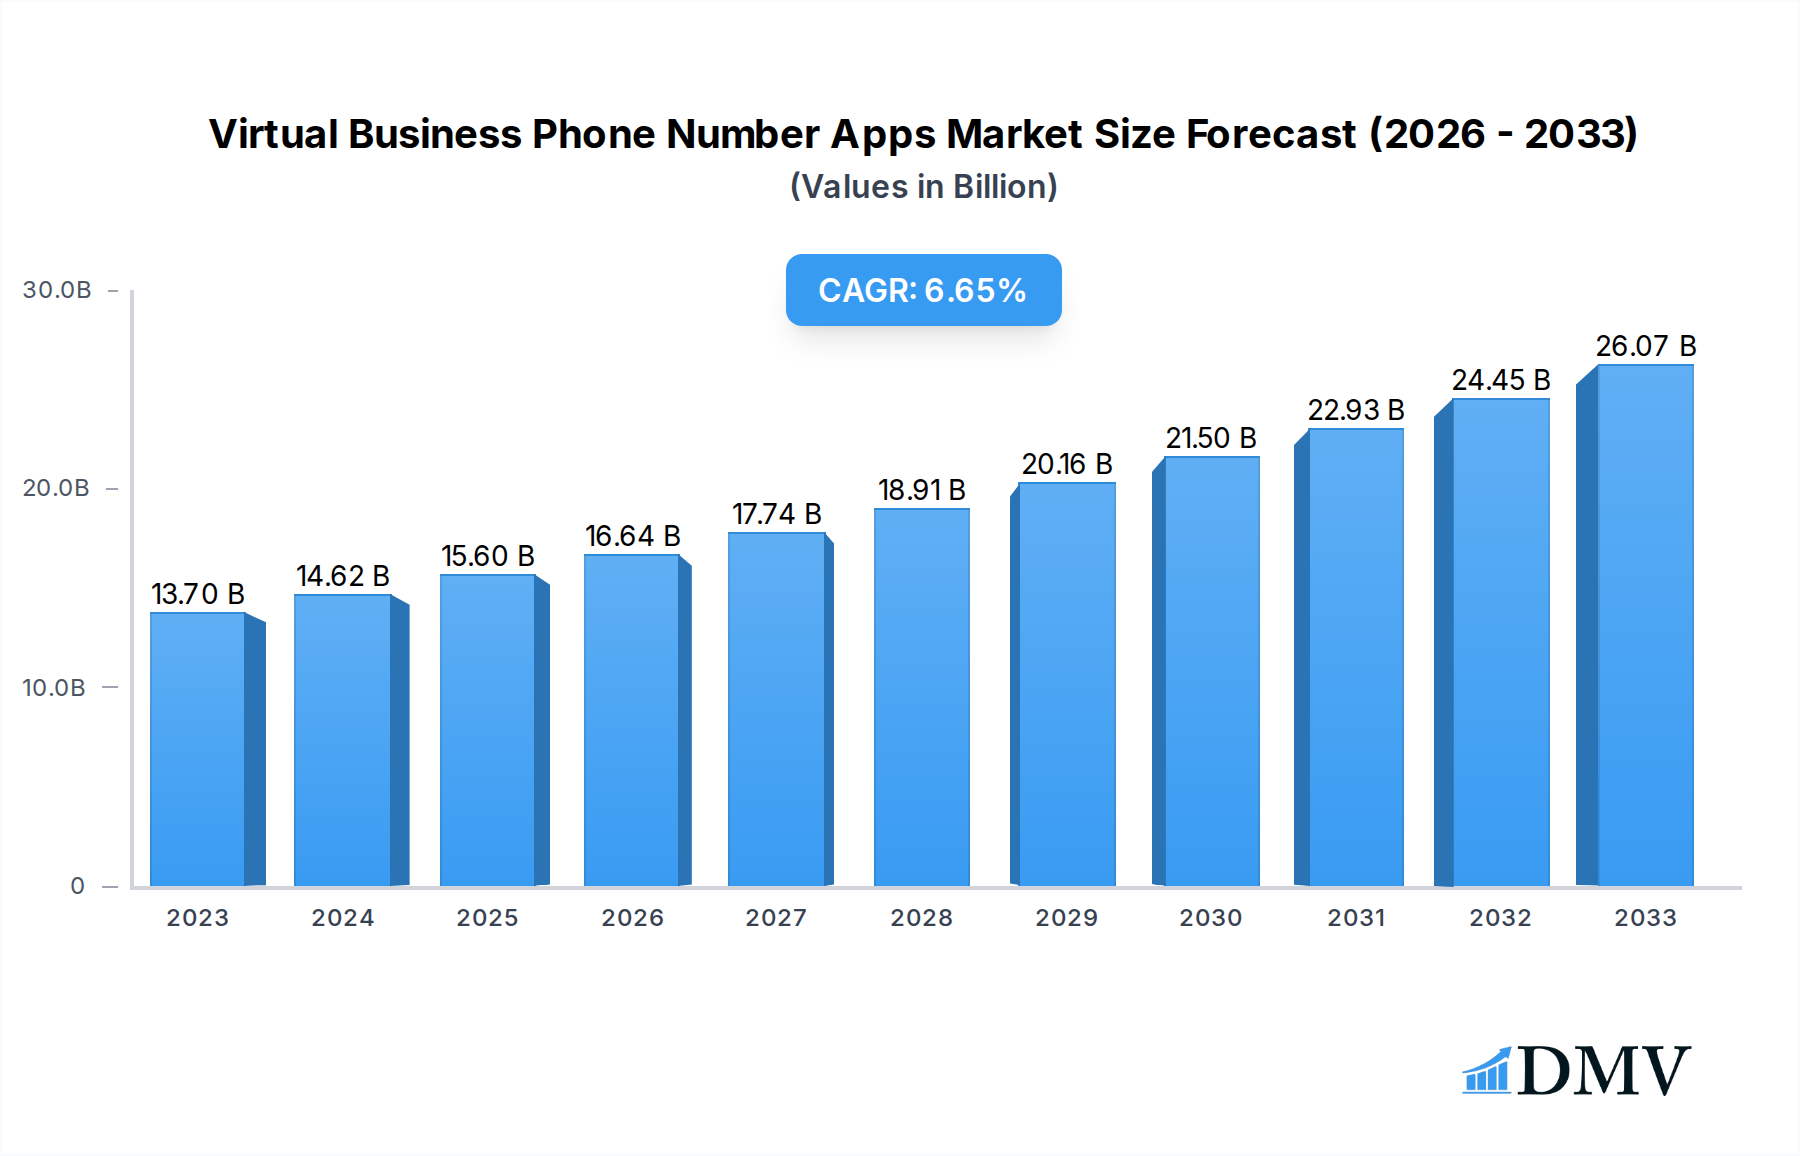
Virtual Business Phone Number Apps Market Size (In Billion)
Key trends shaping this market include the continuous evolution of Unified Communications as a Service (UCaaS) platforms, which are increasingly incorporating sophisticated virtual phone number functionalities. The growing demand for mobile-first communication solutions, catering to a workforce that operates predominantly from smartphones, is also a significant catalyst. Furthermore, the integration of artificial intelligence (AI) for features like intelligent call routing, automated customer service, and sentiment analysis is becoming a critical differentiator. While the market enjoys strong tailwinds, potential restraints could emerge from data privacy concerns and the need for robust cybersecurity measures to protect sensitive business communications. Despite these considerations, the overall trajectory for the Virtual Business Phone Number Apps market remains exceptionally positive, driven by innovation and the persistent need for agile and efficient business communication tools.

Virtual Business Phone Number Apps Company Market Share
Virtual Business Phone Number Apps Market Report: Comprehensive Analysis and Future Outlook
This in-depth report offers a definitive analysis of the global virtual business phone number apps market, examining its current landscape, historical trajectory, and projected future. We dissect key trends, competitive dynamics, and technological advancements that are reshaping how businesses communicate. This report is an indispensable resource for stakeholders seeking to understand market drivers, identify growth opportunities, and strategize for success in this rapidly evolving sector. The study period spans from 2019 to 2033, with a base year of 2025 and an estimated year also of 2025, followed by a comprehensive forecast period from 2025 to 2033, building upon the historical data from 2019 to 2024.
Virtual Business Phone Number Apps Market Composition & Trends
The virtual business phone number apps market exhibits a dynamic composition, characterized by a moderate level of market concentration with key players such as RingCentral, Dialpad, and 8x8 holding substantial market share, estimated to be around $50 billion in 2025. Innovation catalysts are primarily driven by the increasing demand for remote work solutions, unified communications (UCaaS) integration, and advanced AI-powered features like intelligent call routing and sentiment analysis. The regulatory landscape is evolving, with a focus on data privacy and security, influencing how providers manage sensitive business communications. Substitute products include traditional landlines and basic VoIP services, but the superior flexibility and feature set of virtual business phone number apps continue to drive their adoption. End-user profiles range from small and medium-sized enterprises (SMEs) seeking cost-effective and scalable communication solutions to large enterprises requiring robust, feature-rich platforms to manage extensive call volumes and diverse team needs. Mergers and acquisitions (M&A) activity is notable, with significant deal values, for instance, a projected $15 billion in M&A deals in 2024, indicating consolidation and strategic expansion within the industry. The market share distribution is highly competitive, with the top 5 players projected to control over 60% of the market by 2025, valued at approximately $80 billion.
Virtual Business Phone Number Apps Industry Evolution
The virtual business phone number apps industry has undergone a remarkable evolution, transforming from a niche offering to a mainstream business essential. Over the historical period from 2019 to 2024, the market experienced a compound annual growth rate (CAGR) of approximately 18%, propelled by the accelerated shift towards remote and hybrid work models. This necessitated robust, cloud-based communication solutions that could support seamless collaboration and business operations regardless of location. Technological advancements have been a significant driver, with the integration of artificial intelligence (AI) and machine learning (ML) leading to enhanced functionalities such as intelligent call routing, virtual assistants, automated transcription, and advanced analytics. The adoption of cloud-based infrastructure has enabled greater scalability, flexibility, and cost-efficiency for businesses of all sizes. Shifting consumer demands have also played a crucial role. Businesses are increasingly seeking integrated communication platforms that offer not just voice calls but also SMS, video conferencing, team chat, and CRM integration. This has pushed providers to develop comprehensive UCaaS solutions. The estimated market size for virtual business phone number apps in 2025 is projected to reach $100 billion, with a forecast CAGR of 15% for the period 2025–2033. Adoption metrics reveal a substantial increase in SMEs adopting these solutions, with over 70% of SMEs now utilizing virtual business phone number apps. For large enterprises, the adoption rate hovers around 85%, driven by the need for sophisticated call management and integration capabilities. The market growth trajectory is expected to continue its upward climb, fueled by ongoing digital transformation initiatives and the persistent need for efficient and adaptable business communication tools. For instance, the adoption of SMS functionalities within these apps has seen a growth of 25% annually from 2022-2024.
Leading Regions, Countries, or Segments in Virtual Business Phone Number Apps
North America currently leads the virtual business phone number apps market, driven by a confluence of factors including a mature technological infrastructure, a high concentration of tech-savvy SMEs and large enterprises, and early adoption of cloud-based solutions. The United States, in particular, represents a dominant force due to the presence of major industry players and a strong emphasis on innovation and digital transformation.
- Application: SMEs: Small and Medium-sized Enterprises (SMEs) represent the largest and fastest-growing segment within the virtual business phone number apps market. Their dominance is fueled by:
- Cost-Effectiveness: Virtual phone numbers offer a significantly lower cost of entry and operational expense compared to traditional business phone systems, with average savings estimated at 30% for SMEs.
- Scalability: As SMEs grow, virtual phone number apps can easily scale with their needs, adding or removing lines without complex hardware installations.
- Professional Image: These apps enable SMEs to project a professional image with dedicated business numbers and advanced features like auto-attendants, which were once only accessible to larger corporations.
- Flexibility: Support for remote work and mobile workforces is paramount for SMEs, and virtual phone number apps provide the necessary flexibility for employees to connect from anywhere.
- Types: Android OS & iOS: Both Android and iOS platforms are critical for the widespread adoption of virtual business phone number apps.
- Ubiquitous Access: The vast majority of smartphone users operate on either Android or iOS, ensuring broad accessibility for business users.
- Feature Richness: Mobile app development on these platforms allows for seamless integration of advanced features, including high-definition voice calls, video conferencing, messaging, and integration with other business applications.
- User Experience: Continuous innovation in mobile operating systems enhances the user experience, making it intuitive and efficient for business professionals to manage their communications.
- Market Penetration: The high penetration rates of these mobile operating systems globally ensure that virtual business phone number apps can reach a vast potential user base. The market for virtual business phone number apps on mobile devices is estimated to be worth $70 billion in 2025.
The dominance of North America is further bolstered by significant investment trends in UCaaS and cloud communications technologies, with venture capital funding in this sector exceeding $5 billion annually. Regulatory support for digital transformation and remote work policies also plays a crucial role. While other regions like Europe and Asia-Pacific are experiencing robust growth, North America's early adoption and innovation leadership position it as the primary driver of the global market. The market share for SMEs is projected to grow from 65% in 2024 to 70% by 2028, highlighting their increasing reliance on these solutions.
Virtual Business Phone Number Apps Product Innovations
Product innovations in virtual business phone number apps are increasingly focused on enhancing user experience and integrating advanced functionalities. Key advancements include the seamless integration of AI-powered chatbots for customer service automation, offering 24/7 support and reducing response times by an estimated 40%. Real-time call analytics and sentiment analysis are providing businesses with deeper insights into customer interactions, enabling proactive service improvements. Furthermore, the development of robust APIs allows for deeper integration with CRM systems like Salesforce and HubSpot, creating unified workflows and improving data management. Enhanced security features, including end-to-end encryption and multi-factor authentication, are also a priority, safeguarding sensitive business communications. The performance metrics are continuously improving, with lower latency and higher call quality, ensuring a professional and reliable communication experience for users.
Propelling Factors for Virtual Business Phone Number Apps Growth
The growth of the virtual business phone number apps market is propelled by several critical factors. The pervasive shift towards remote and hybrid work models necessitates flexible, cloud-based communication solutions. Technological advancements, particularly in AI and machine learning, are enhancing functionality with features like intelligent routing and virtual assistants, offering significant operational efficiencies. The increasing adoption of UCaaS platforms, which bundle voice, video, chat, and collaboration tools, streamlines business operations and fosters team productivity. Economic benefits, such as reduced infrastructure costs and pay-as-you-go pricing models, make these solutions attractive for businesses of all sizes. Finally, evolving regulatory landscapes that encourage digital transformation and data security also create a favorable environment for market expansion.
Obstacles in the Virtual Business Phone Number Apps Market
Despite robust growth, the virtual business phone number apps market faces several obstacles. Ensuring consistent and reliable internet connectivity, especially in regions with underdeveloped infrastructure, can hinder performance. Concerns about data security and privacy remain a significant restraint, particularly for businesses handling sensitive information, leading to a projected 10% increase in security audits by 2026. The complexity of integrating new virtual phone systems with existing legacy IT infrastructure can be a barrier for some enterprises, leading to extended implementation timelines. Intense competition and price sensitivity in certain market segments can also put pressure on profit margins. Furthermore, a lack of technical expertise among some end-users might lead to underutilization of advanced features, limiting the perceived value of the services.
Future Opportunities in Virtual Business Phone Number Apps
Emerging opportunities in the virtual business phone number apps market are abundant. The continued expansion of the metaverse and augmented reality (AR) presents opportunities for immersive communication experiences and virtual business interactions. The growing demand for specialized industry solutions, such as virtual phone numbers tailored for healthcare or legal sectors with specific compliance requirements, offers niche growth avenues. Advancements in AI are paving the way for more sophisticated predictive analytics and personalized customer engagement tools. The untapped potential in emerging economies, where businesses are increasingly adopting digital solutions, represents a significant market expansion opportunity. Furthermore, the integration of sustainability features, such as energy-efficient data management and reduced carbon footprints, could resonate with environmentally conscious businesses.
Major Players in the Virtual Business Phone Number Apps Ecosystem
- Zoom
- Rakuten Viber
- Cisco
- Microsoft
- Mitel
- RingCentral
- Avaya
- Twilio
- Meta
- 8x8
- Verizon
- Enreach
- GoTo
- Vonage
- Ooma
- TextNow
- Aircall
- AVOXI
- Dialpad
- Sangoma Technologies
- Dstny
- NFON
- Nextiva
- Grasshopper
- 3CX
- Ziff Davis
- OpenPhone
- CounterPath (Alianza)
Key Developments in Virtual Business Phone Number Apps Industry
- 2024 (Q1): RingCentral launches advanced AI-powered features for call summarization and sentiment analysis, aiming to improve customer service efficiency by an estimated 20%.
- 2024 (Q2): Dialpad secures $300 million in funding to accelerate its global expansion and further develop its AI-driven communication platform.
- 2024 (Q3): Microsoft integrates deeper calling functionalities into Microsoft Teams, enhancing its UCaaS offering and posing a stronger competitive threat to standalone providers.
- 2024 (Q4): Twilio announces a strategic partnership with a leading CRM provider to streamline customer communication workflows, underscoring the trend towards integration.
- 2025 (Q1): Aircall introduces enhanced compliance features for regulated industries, targeting a projected 15% increase in enterprise adoption.
- 2025 (Q2): 8x8 expands its global data center footprint, improving latency and reliability for its international customer base.
- 2025 (Q3): Nextiva acquires a cloud-based contact center solution provider to broaden its service portfolio and target larger enterprise clients.
- 2025 (Q4): Grasshopper enhances its mobile app with new team collaboration tools, catering to the evolving needs of remote workforces.
Strategic Virtual Business Phone Number Apps Market Forecast
The strategic forecast for the virtual business phone number apps market indicates sustained and robust growth, projected to exceed $300 billion by 2033. This expansion will be fueled by the continuous integration of advanced AI capabilities, leading to more intelligent automation and predictive insights that enhance customer engagement and operational efficiency. The ongoing digitalization of businesses across all sectors, coupled with the sustained demand for flexible and scalable communication solutions, will serve as primary growth catalysts. Furthermore, emerging markets present significant untapped potential, offering opportunities for widespread adoption as digital infrastructure improves. The market will also witness increased consolidation and strategic partnerships as companies aim to offer comprehensive UCaaS solutions, solidifying their competitive positions and catering to the evolving needs of a globally connected business environment.
Virtual Business Phone Number Apps Segmentation
-
1. Application
- 1.1. SMEs
- 1.2. Large Enterprises
-
2. Types
- 2.1. Android OS
- 2.2. iOS
- 2.3. Window OS
- 2.4. Others
Virtual Business Phone Number Apps Segmentation By Geography
-
1. North America
- 1.1. United States
- 1.2. Canada
- 1.3. Mexico
-
2. South America
- 2.1. Brazil
- 2.2. Argentina
- 2.3. Rest of South America
-
3. Europe
- 3.1. United Kingdom
- 3.2. Germany
- 3.3. France
- 3.4. Italy
- 3.5. Spain
- 3.6. Russia
- 3.7. Benelux
- 3.8. Nordics
- 3.9. Rest of Europe
-
4. Middle East & Africa
- 4.1. Turkey
- 4.2. Israel
- 4.3. GCC
- 4.4. North Africa
- 4.5. South Africa
- 4.6. Rest of Middle East & Africa
-
5. Asia Pacific
- 5.1. China
- 5.2. India
- 5.3. Japan
- 5.4. South Korea
- 5.5. ASEAN
- 5.6. Oceania
- 5.7. Rest of Asia Pacific
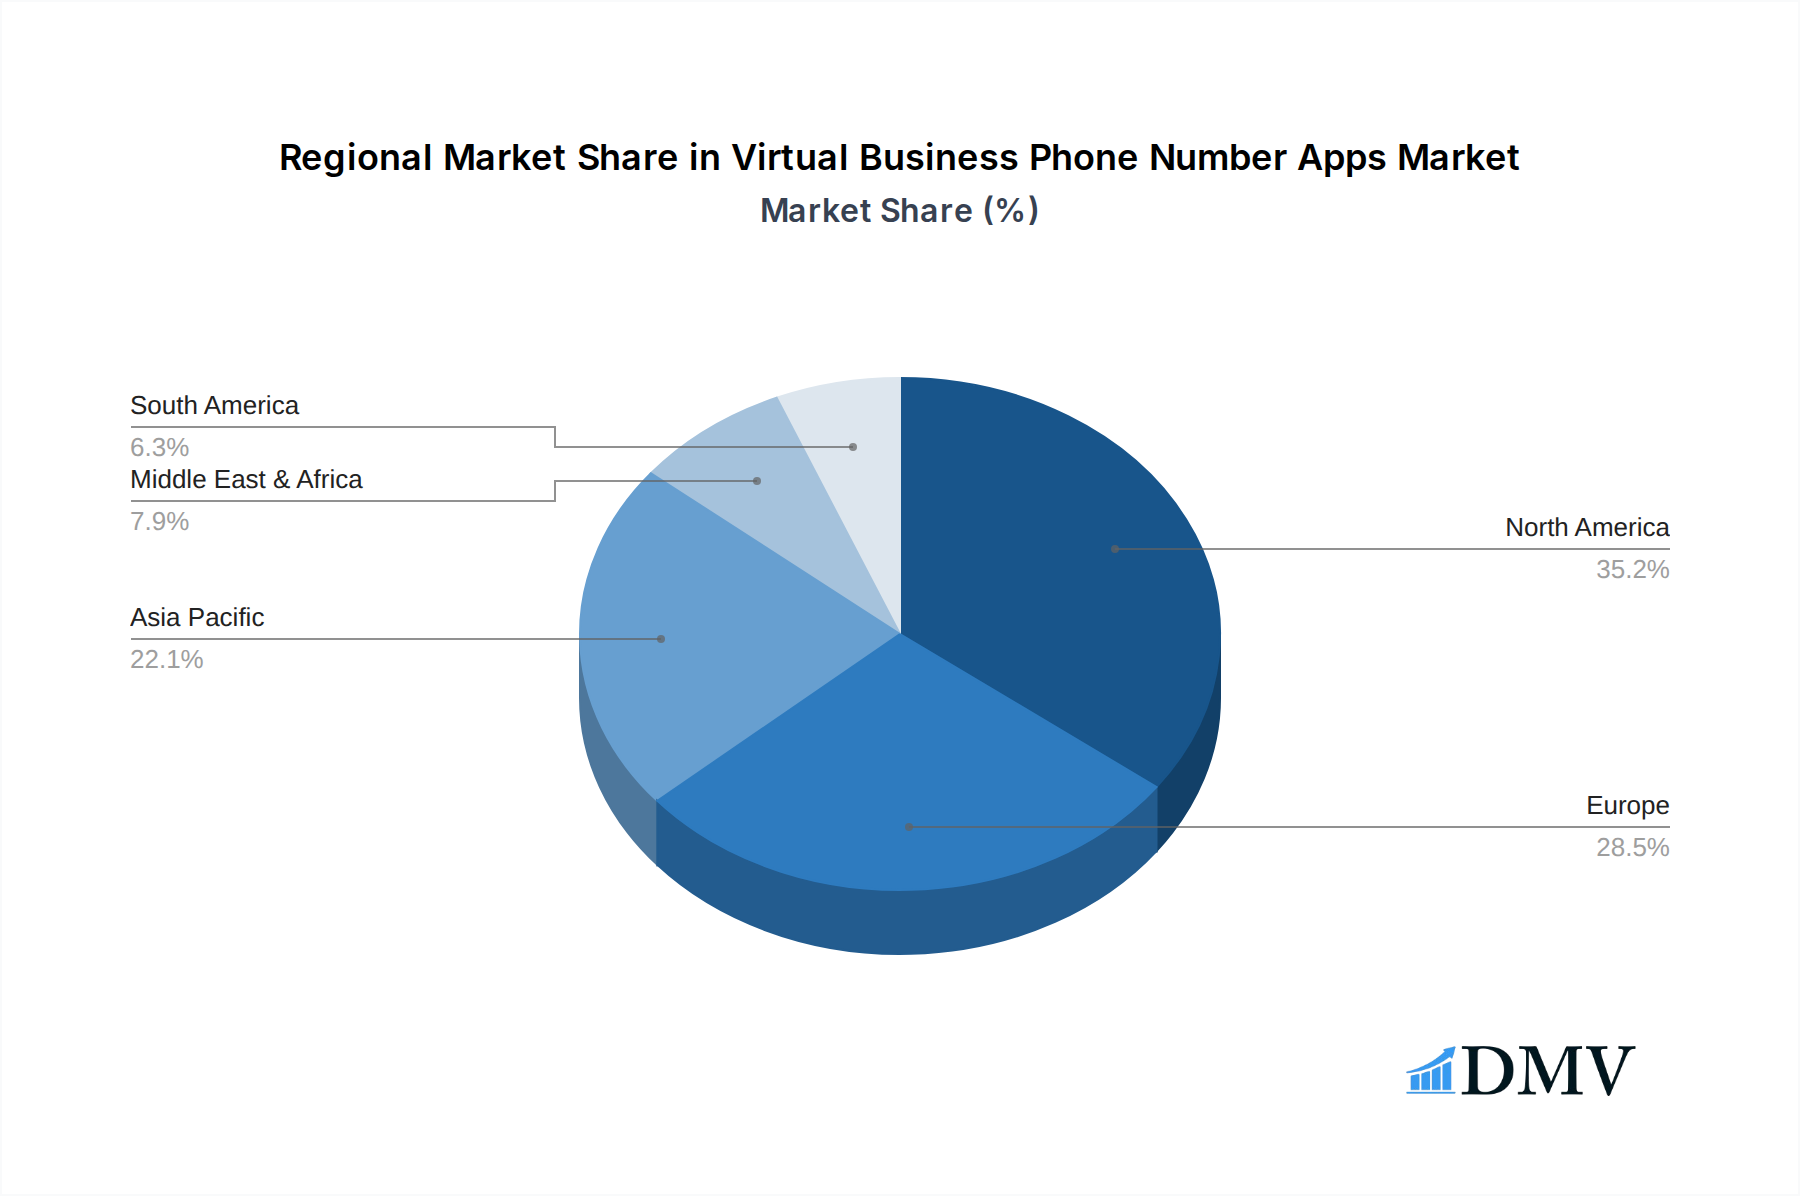
Virtual Business Phone Number Apps Regional Market Share
Geographic Coverage of Virtual Business Phone Number Apps
Virtual Business Phone Number Apps REPORT HIGHLIGHTS
| Aspects | Details |
|---|---|
| Study Period | 2020-2034 |
| Base Year | 2025 |
| Estimated Year | 2026 |
| Forecast Period | 2026-2034 |
| Historical Period | 2020-2025 |
| Growth Rate | CAGR of 6.5% from 2020-2034 |
| Segmentation |
|
Table of Contents
- 1. Introduction
- 1.1. Research Scope
- 1.2. Market Segmentation
- 1.3. Research Objective
- 1.4. Definitions and Assumptions
- 2. Executive Summary
- 2.1. Market Snapshot
- 3. Market Dynamics
- 3.1. Market Drivers
- 3.2. Market Restrains
- 3.3. Market Trends
- 3.4. Market Opportunities
- 4. Market Factor Analysis
- 4.1. Porters Five Forces
- 4.1.1. Bargaining Power of Suppliers
- 4.1.2. Bargaining Power of Buyers
- 4.1.3. Threat of New Entrants
- 4.1.4. Threat of Substitutes
- 4.1.5. Competitive Rivalry
- 4.2. PESTEL analysis
- 4.3. BCG Analysis
- 4.3.1. Stars (High Growth, High Market Share)
- 4.3.2. Cash Cows (Low Growth, High Market Share)
- 4.3.3. Question Mark (High Growth, Low Market Share)
- 4.3.4. Dogs (Low Growth, Low Market Share)
- 4.4. Ansoff Matrix Analysis
- 4.5. Supply Chain Analysis
- 4.6. Regulatory Landscape
- 4.7. Current Market Potential and Opportunity Assessment (TAM–SAM–SOM Framework)
- 4.8. DMV Analyst Note
- 4.1. Porters Five Forces
- 5. Market Analysis, Insights and Forecast 2021-2033
- 5.1. Market Analysis, Insights and Forecast - by Application
- 5.1.1. SMEs
- 5.1.2. Large Enterprises
- 5.2. Market Analysis, Insights and Forecast - by Types
- 5.2.1. Android OS
- 5.2.2. iOS
- 5.2.3. Window OS
- 5.2.4. Others
- 5.3. Market Analysis, Insights and Forecast - by Region
- 5.3.1. North America
- 5.3.2. South America
- 5.3.3. Europe
- 5.3.4. Middle East & Africa
- 5.3.5. Asia Pacific
- 5.1. Market Analysis, Insights and Forecast - by Application
- 6. Global Virtual Business Phone Number Apps Analysis, Insights and Forecast, 2021-2033
- 6.1. Market Analysis, Insights and Forecast - by Application
- 6.1.1. SMEs
- 6.1.2. Large Enterprises
- 6.2. Market Analysis, Insights and Forecast - by Types
- 6.2.1. Android OS
- 6.2.2. iOS
- 6.2.3. Window OS
- 6.2.4. Others
- 6.1. Market Analysis, Insights and Forecast - by Application
- 7. North America Virtual Business Phone Number Apps Analysis, Insights and Forecast, 2020-2032
- 7.1. Market Analysis, Insights and Forecast - by Application
- 7.1.1. SMEs
- 7.1.2. Large Enterprises
- 7.2. Market Analysis, Insights and Forecast - by Types
- 7.2.1. Android OS
- 7.2.2. iOS
- 7.2.3. Window OS
- 7.2.4. Others
- 7.1. Market Analysis, Insights and Forecast - by Application
- 8. South America Virtual Business Phone Number Apps Analysis, Insights and Forecast, 2020-2032
- 8.1. Market Analysis, Insights and Forecast - by Application
- 8.1.1. SMEs
- 8.1.2. Large Enterprises
- 8.2. Market Analysis, Insights and Forecast - by Types
- 8.2.1. Android OS
- 8.2.2. iOS
- 8.2.3. Window OS
- 8.2.4. Others
- 8.1. Market Analysis, Insights and Forecast - by Application
- 9. Europe Virtual Business Phone Number Apps Analysis, Insights and Forecast, 2020-2032
- 9.1. Market Analysis, Insights and Forecast - by Application
- 9.1.1. SMEs
- 9.1.2. Large Enterprises
- 9.2. Market Analysis, Insights and Forecast - by Types
- 9.2.1. Android OS
- 9.2.2. iOS
- 9.2.3. Window OS
- 9.2.4. Others
- 9.1. Market Analysis, Insights and Forecast - by Application
- 10. Middle East & Africa Virtual Business Phone Number Apps Analysis, Insights and Forecast, 2020-2032
- 10.1. Market Analysis, Insights and Forecast - by Application
- 10.1.1. SMEs
- 10.1.2. Large Enterprises
- 10.2. Market Analysis, Insights and Forecast - by Types
- 10.2.1. Android OS
- 10.2.2. iOS
- 10.2.3. Window OS
- 10.2.4. Others
- 10.1. Market Analysis, Insights and Forecast - by Application
- 11. Asia Pacific Virtual Business Phone Number Apps Analysis, Insights and Forecast, 2020-2032
- 11.1. Market Analysis, Insights and Forecast - by Application
- 11.1.1. SMEs
- 11.1.2. Large Enterprises
- 11.2. Market Analysis, Insights and Forecast - by Types
- 11.2.1. Android OS
- 11.2.2. iOS
- 11.2.3. Window OS
- 11.2.4. Others
- 11.1. Market Analysis, Insights and Forecast - by Application
- 12. Competitive Analysis
- 12.1. Company Profiles
- 12.1.1 Zoom
- 12.1.1.1. Company Overview
- 12.1.1.2. Products
- 12.1.1.3. Company Financials
- 12.1.1.4. SWOT Analysis
- 12.1.2 Rakuten Viber
- 12.1.2.1. Company Overview
- 12.1.2.2. Products
- 12.1.2.3. Company Financials
- 12.1.2.4. SWOT Analysis
- 12.1.3 Cisco
- 12.1.3.1. Company Overview
- 12.1.3.2. Products
- 12.1.3.3. Company Financials
- 12.1.3.4. SWOT Analysis
- 12.1.4 Microsoft
- 12.1.4.1. Company Overview
- 12.1.4.2. Products
- 12.1.4.3. Company Financials
- 12.1.4.4. SWOT Analysis
- 12.1.5 Mitel
- 12.1.5.1. Company Overview
- 12.1.5.2. Products
- 12.1.5.3. Company Financials
- 12.1.5.4. SWOT Analysis
- 12.1.6 RingCentral
- 12.1.6.1. Company Overview
- 12.1.6.2. Products
- 12.1.6.3. Company Financials
- 12.1.6.4. SWOT Analysis
- 12.1.7 Avaya
- 12.1.7.1. Company Overview
- 12.1.7.2. Products
- 12.1.7.3. Company Financials
- 12.1.7.4. SWOT Analysis
- 12.1.8 Twilio
- 12.1.8.1. Company Overview
- 12.1.8.2. Products
- 12.1.8.3. Company Financials
- 12.1.8.4. SWOT Analysis
- 12.1.9 Meta
- 12.1.9.1. Company Overview
- 12.1.9.2. Products
- 12.1.9.3. Company Financials
- 12.1.9.4. SWOT Analysis
- 12.1.10 8x8
- 12.1.10.1. Company Overview
- 12.1.10.2. Products
- 12.1.10.3. Company Financials
- 12.1.10.4. SWOT Analysis
- 12.1.11 Verizon
- 12.1.11.1. Company Overview
- 12.1.11.2. Products
- 12.1.11.3. Company Financials
- 12.1.11.4. SWOT Analysis
- 12.1.12 Enreach
- 12.1.12.1. Company Overview
- 12.1.12.2. Products
- 12.1.12.3. Company Financials
- 12.1.12.4. SWOT Analysis
- 12.1.13 GoTo
- 12.1.13.1. Company Overview
- 12.1.13.2. Products
- 12.1.13.3. Company Financials
- 12.1.13.4. SWOT Analysis
- 12.1.14 Vonage
- 12.1.14.1. Company Overview
- 12.1.14.2. Products
- 12.1.14.3. Company Financials
- 12.1.14.4. SWOT Analysis
- 12.1.15 Ooma
- 12.1.15.1. Company Overview
- 12.1.15.2. Products
- 12.1.15.3. Company Financials
- 12.1.15.4. SWOT Analysis
- 12.1.16 TextNow
- 12.1.16.1. Company Overview
- 12.1.16.2. Products
- 12.1.16.3. Company Financials
- 12.1.16.4. SWOT Analysis
- 12.1.17 Aircall
- 12.1.17.1. Company Overview
- 12.1.17.2. Products
- 12.1.17.3. Company Financials
- 12.1.17.4. SWOT Analysis
- 12.1.18 AVOXI
- 12.1.18.1. Company Overview
- 12.1.18.2. Products
- 12.1.18.3. Company Financials
- 12.1.18.4. SWOT Analysis
- 12.1.19 Dialpad
- 12.1.19.1. Company Overview
- 12.1.19.2. Products
- 12.1.19.3. Company Financials
- 12.1.19.4. SWOT Analysis
- 12.1.20 Sangoma Technologies
- 12.1.20.1. Company Overview
- 12.1.20.2. Products
- 12.1.20.3. Company Financials
- 12.1.20.4. SWOT Analysis
- 12.1.21 Dstny
- 12.1.21.1. Company Overview
- 12.1.21.2. Products
- 12.1.21.3. Company Financials
- 12.1.21.4. SWOT Analysis
- 12.1.22 NFON
- 12.1.22.1. Company Overview
- 12.1.22.2. Products
- 12.1.22.3. Company Financials
- 12.1.22.4. SWOT Analysis
- 12.1.23 Nextiva
- 12.1.23.1. Company Overview
- 12.1.23.2. Products
- 12.1.23.3. Company Financials
- 12.1.23.4. SWOT Analysis
- 12.1.24 Grasshopper
- 12.1.24.1. Company Overview
- 12.1.24.2. Products
- 12.1.24.3. Company Financials
- 12.1.24.4. SWOT Analysis
- 12.1.25 3CX
- 12.1.25.1. Company Overview
- 12.1.25.2. Products
- 12.1.25.3. Company Financials
- 12.1.25.4. SWOT Analysis
- 12.1.26 Google
- 12.1.26.1. Company Overview
- 12.1.26.2. Products
- 12.1.26.3. Company Financials
- 12.1.26.4. SWOT Analysis
- 12.1.27 Ziff Davis
- 12.1.27.1. Company Overview
- 12.1.27.2. Products
- 12.1.27.3. Company Financials
- 12.1.27.4. SWOT Analysis
- 12.1.28 OpenPhone
- 12.1.28.1. Company Overview
- 12.1.28.2. Products
- 12.1.28.3. Company Financials
- 12.1.28.4. SWOT Analysis
- 12.1.29 CounterPath (Alianza)
- 12.1.29.1. Company Overview
- 12.1.29.2. Products
- 12.1.29.3. Company Financials
- 12.1.29.4. SWOT Analysis
- 12.1.1 Zoom
- 12.2. Market Entropy
- 12.2.1 Company's Key Areas Served
- 12.2.2 Recent Developments
- 12.3. Company Market Share Analysis 2025
- 12.3.1 Top 5 Companies Market Share Analysis
- 12.3.2 Top 3 Companies Market Share Analysis
- 12.4. List of Potential Customers
- 13. Research Methodology
List of Figures
- Figure 1: Global Virtual Business Phone Number Apps Revenue Breakdown (undefined, %) by Region 2025 & 2033
- Figure 2: North America Virtual Business Phone Number Apps Revenue (undefined), by Application 2025 & 2033
- Figure 3: North America Virtual Business Phone Number Apps Revenue Share (%), by Application 2025 & 2033
- Figure 4: North America Virtual Business Phone Number Apps Revenue (undefined), by Types 2025 & 2033
- Figure 5: North America Virtual Business Phone Number Apps Revenue Share (%), by Types 2025 & 2033
- Figure 6: North America Virtual Business Phone Number Apps Revenue (undefined), by Country 2025 & 2033
- Figure 7: North America Virtual Business Phone Number Apps Revenue Share (%), by Country 2025 & 2033
- Figure 8: South America Virtual Business Phone Number Apps Revenue (undefined), by Application 2025 & 2033
- Figure 9: South America Virtual Business Phone Number Apps Revenue Share (%), by Application 2025 & 2033
- Figure 10: South America Virtual Business Phone Number Apps Revenue (undefined), by Types 2025 & 2033
- Figure 11: South America Virtual Business Phone Number Apps Revenue Share (%), by Types 2025 & 2033
- Figure 12: South America Virtual Business Phone Number Apps Revenue (undefined), by Country 2025 & 2033
- Figure 13: South America Virtual Business Phone Number Apps Revenue Share (%), by Country 2025 & 2033
- Figure 14: Europe Virtual Business Phone Number Apps Revenue (undefined), by Application 2025 & 2033
- Figure 15: Europe Virtual Business Phone Number Apps Revenue Share (%), by Application 2025 & 2033
- Figure 16: Europe Virtual Business Phone Number Apps Revenue (undefined), by Types 2025 & 2033
- Figure 17: Europe Virtual Business Phone Number Apps Revenue Share (%), by Types 2025 & 2033
- Figure 18: Europe Virtual Business Phone Number Apps Revenue (undefined), by Country 2025 & 2033
- Figure 19: Europe Virtual Business Phone Number Apps Revenue Share (%), by Country 2025 & 2033
- Figure 20: Middle East & Africa Virtual Business Phone Number Apps Revenue (undefined), by Application 2025 & 2033
- Figure 21: Middle East & Africa Virtual Business Phone Number Apps Revenue Share (%), by Application 2025 & 2033
- Figure 22: Middle East & Africa Virtual Business Phone Number Apps Revenue (undefined), by Types 2025 & 2033
- Figure 23: Middle East & Africa Virtual Business Phone Number Apps Revenue Share (%), by Types 2025 & 2033
- Figure 24: Middle East & Africa Virtual Business Phone Number Apps Revenue (undefined), by Country 2025 & 2033
- Figure 25: Middle East & Africa Virtual Business Phone Number Apps Revenue Share (%), by Country 2025 & 2033
- Figure 26: Asia Pacific Virtual Business Phone Number Apps Revenue (undefined), by Application 2025 & 2033
- Figure 27: Asia Pacific Virtual Business Phone Number Apps Revenue Share (%), by Application 2025 & 2033
- Figure 28: Asia Pacific Virtual Business Phone Number Apps Revenue (undefined), by Types 2025 & 2033
- Figure 29: Asia Pacific Virtual Business Phone Number Apps Revenue Share (%), by Types 2025 & 2033
- Figure 30: Asia Pacific Virtual Business Phone Number Apps Revenue (undefined), by Country 2025 & 2033
- Figure 31: Asia Pacific Virtual Business Phone Number Apps Revenue Share (%), by Country 2025 & 2033
List of Tables
- Table 1: Global Virtual Business Phone Number Apps Revenue undefined Forecast, by Application 2020 & 2033
- Table 2: Global Virtual Business Phone Number Apps Revenue undefined Forecast, by Types 2020 & 2033
- Table 3: Global Virtual Business Phone Number Apps Revenue undefined Forecast, by Region 2020 & 2033
- Table 4: Global Virtual Business Phone Number Apps Revenue undefined Forecast, by Application 2020 & 2033
- Table 5: Global Virtual Business Phone Number Apps Revenue undefined Forecast, by Types 2020 & 2033
- Table 6: Global Virtual Business Phone Number Apps Revenue undefined Forecast, by Country 2020 & 2033
- Table 7: United States Virtual Business Phone Number Apps Revenue (undefined) Forecast, by Application 2020 & 2033
- Table 8: Canada Virtual Business Phone Number Apps Revenue (undefined) Forecast, by Application 2020 & 2033
- Table 9: Mexico Virtual Business Phone Number Apps Revenue (undefined) Forecast, by Application 2020 & 2033
- Table 10: Global Virtual Business Phone Number Apps Revenue undefined Forecast, by Application 2020 & 2033
- Table 11: Global Virtual Business Phone Number Apps Revenue undefined Forecast, by Types 2020 & 2033
- Table 12: Global Virtual Business Phone Number Apps Revenue undefined Forecast, by Country 2020 & 2033
- Table 13: Brazil Virtual Business Phone Number Apps Revenue (undefined) Forecast, by Application 2020 & 2033
- Table 14: Argentina Virtual Business Phone Number Apps Revenue (undefined) Forecast, by Application 2020 & 2033
- Table 15: Rest of South America Virtual Business Phone Number Apps Revenue (undefined) Forecast, by Application 2020 & 2033
- Table 16: Global Virtual Business Phone Number Apps Revenue undefined Forecast, by Application 2020 & 2033
- Table 17: Global Virtual Business Phone Number Apps Revenue undefined Forecast, by Types 2020 & 2033
- Table 18: Global Virtual Business Phone Number Apps Revenue undefined Forecast, by Country 2020 & 2033
- Table 19: United Kingdom Virtual Business Phone Number Apps Revenue (undefined) Forecast, by Application 2020 & 2033
- Table 20: Germany Virtual Business Phone Number Apps Revenue (undefined) Forecast, by Application 2020 & 2033
- Table 21: France Virtual Business Phone Number Apps Revenue (undefined) Forecast, by Application 2020 & 2033
- Table 22: Italy Virtual Business Phone Number Apps Revenue (undefined) Forecast, by Application 2020 & 2033
- Table 23: Spain Virtual Business Phone Number Apps Revenue (undefined) Forecast, by Application 2020 & 2033
- Table 24: Russia Virtual Business Phone Number Apps Revenue (undefined) Forecast, by Application 2020 & 2033
- Table 25: Benelux Virtual Business Phone Number Apps Revenue (undefined) Forecast, by Application 2020 & 2033
- Table 26: Nordics Virtual Business Phone Number Apps Revenue (undefined) Forecast, by Application 2020 & 2033
- Table 27: Rest of Europe Virtual Business Phone Number Apps Revenue (undefined) Forecast, by Application 2020 & 2033
- Table 28: Global Virtual Business Phone Number Apps Revenue undefined Forecast, by Application 2020 & 2033
- Table 29: Global Virtual Business Phone Number Apps Revenue undefined Forecast, by Types 2020 & 2033
- Table 30: Global Virtual Business Phone Number Apps Revenue undefined Forecast, by Country 2020 & 2033
- Table 31: Turkey Virtual Business Phone Number Apps Revenue (undefined) Forecast, by Application 2020 & 2033
- Table 32: Israel Virtual Business Phone Number Apps Revenue (undefined) Forecast, by Application 2020 & 2033
- Table 33: GCC Virtual Business Phone Number Apps Revenue (undefined) Forecast, by Application 2020 & 2033
- Table 34: North Africa Virtual Business Phone Number Apps Revenue (undefined) Forecast, by Application 2020 & 2033
- Table 35: South Africa Virtual Business Phone Number Apps Revenue (undefined) Forecast, by Application 2020 & 2033
- Table 36: Rest of Middle East & Africa Virtual Business Phone Number Apps Revenue (undefined) Forecast, by Application 2020 & 2033
- Table 37: Global Virtual Business Phone Number Apps Revenue undefined Forecast, by Application 2020 & 2033
- Table 38: Global Virtual Business Phone Number Apps Revenue undefined Forecast, by Types 2020 & 2033
- Table 39: Global Virtual Business Phone Number Apps Revenue undefined Forecast, by Country 2020 & 2033
- Table 40: China Virtual Business Phone Number Apps Revenue (undefined) Forecast, by Application 2020 & 2033
- Table 41: India Virtual Business Phone Number Apps Revenue (undefined) Forecast, by Application 2020 & 2033
- Table 42: Japan Virtual Business Phone Number Apps Revenue (undefined) Forecast, by Application 2020 & 2033
- Table 43: South Korea Virtual Business Phone Number Apps Revenue (undefined) Forecast, by Application 2020 & 2033
- Table 44: ASEAN Virtual Business Phone Number Apps Revenue (undefined) Forecast, by Application 2020 & 2033
- Table 45: Oceania Virtual Business Phone Number Apps Revenue (undefined) Forecast, by Application 2020 & 2033
- Table 46: Rest of Asia Pacific Virtual Business Phone Number Apps Revenue (undefined) Forecast, by Application 2020 & 2033
Frequently Asked Questions
1. What is the projected Compound Annual Growth Rate (CAGR) of the Virtual Business Phone Number Apps?
The projected CAGR is approximately 6.5%.
2. Which companies are prominent players in the Virtual Business Phone Number Apps?
Key companies in the market include Zoom, Rakuten Viber, Cisco, Microsoft, Mitel, RingCentral, Avaya, Twilio, Meta, 8x8, Verizon, Enreach, GoTo, Vonage, Ooma, TextNow, Aircall, AVOXI, Dialpad, Sangoma Technologies, Dstny, NFON, Nextiva, Grasshopper, 3CX, Google, Ziff Davis, OpenPhone, CounterPath (Alianza).
3. What are the main segments of the Virtual Business Phone Number Apps?
The market segments include Application, Types.
4. Can you provide details about the market size?
The market size is estimated to be USD XXX N/A as of 2022.
5. What are some drivers contributing to market growth?
N/A
6. What are the notable trends driving market growth?
N/A
7. Are there any restraints impacting market growth?
N/A
8. Can you provide examples of recent developments in the market?
N/A
9. What pricing options are available for accessing the report?
Pricing options include single-user, multi-user, and enterprise licenses priced at USD 3350.00, USD 5025.00, and USD 6700.00 respectively.
10. Is the market size provided in terms of value or volume?
The market size is provided in terms of value, measured in N/A.
11. Are there any specific market keywords associated with the report?
Yes, the market keyword associated with the report is "Virtual Business Phone Number Apps," which aids in identifying and referencing the specific market segment covered.
12. How do I determine which pricing option suits my needs best?
The pricing options vary based on user requirements and access needs. Individual users may opt for single-user licenses, while businesses requiring broader access may choose multi-user or enterprise licenses for cost-effective access to the report.
13. Are there any additional resources or data provided in the Virtual Business Phone Number Apps report?
While the report offers comprehensive insights, it's advisable to review the specific contents or supplementary materials provided to ascertain if additional resources or data are available.
14. How can I stay updated on further developments or reports in the Virtual Business Phone Number Apps?
To stay informed about further developments, trends, and reports in the Virtual Business Phone Number Apps, consider subscribing to industry newsletters, following relevant companies and organizations, or regularly checking reputable industry news sources and publications.
Methodology
Step 1 - Identification of Relevant Samples Size from Population Database


Step 2 - Approaches for Defining Global Market Size (Value, Volume* & Price*)

Note*: In applicable scenarios
Step 3 - Data Sources
Primary Research
- Web Analytics
- Survey Reports
- Research Institute
- Latest Research Reports
- Opinion Leaders
Secondary Research
- Annual Reports
- White Paper
- Latest Press Release
- Industry Association
- Paid Database
- Investor Presentations

Step 4 - Data Triangulation
Involves using different sources of information in order to increase the validity of a study
These sources are likely to be stakeholders in a program - participants, other researchers, program staff, other community members, and so on.
Then we put all data in single framework & apply various statistical tools to find out the dynamic on the market.
During the analysis stage, feedback from the stakeholder groups would be compared to determine areas of agreement as well as areas of divergence